White Latin Americans
White Latin Americans, or European Latin Americans, are Latin Americans who are considered white, typically due to European, or in some cases Levantine, descent. Latin American countries have often encouraged mixing of different ethnic groups for procreation, and even a small amount of European ancestry could entail significant upwards social mobility.[23][24][25]
| Total population | |
|---|---|
| 178.6 million – 219.4 million[1][2] 31.8 – 39.0% of Latin American population
| |
| Regions with significant populations | |
| 99M[3] | |
| 12.7M–56M (est.)[4][5][6][7] | |
| 38M[2] | |
| 18M[8] | |
| 13M[9][10] | |
| 10M (est.)[2] | |
| 7.16M[11] | |
| 0.03M[12] | |
| 4M[2] | |
| 2.9M[13] | |
| 1.3M[14] | |
| 2.6M[15] | |
| 1.8M[16] | |
| 1.6M[17] | |
| 1.3M[2] | |
| 1M–4.3M (est.)[18] | |
| 0.950M[19] | |
| 0.950M | |
| 0.812M | |
| 0.366 [20] | |
| Languages | |
| Major languages Spanish and Portuguese Minor languages Italian, French, English, German, Dutch, and other languages[21] | |
| Religion | |
| Predominantly Christian (mainly Roman Catholics, with a minority of Protestants),[22] Judaism | |
| Related ethnic groups | |
| Spaniards, Portuguese people, French people, Italians, Romanians, British people, Irish people, Germans, Danes, Norwegians, Dutch people, Belgians, Swedes, Poles, Ukrainians, Russians, Croats, Swiss people, Hungarians, Greeks, Semitic peoples, Armenians | |
aWhites and mulattos | |
People descended from European settlers who arrived in the Americas during the colonial and post-independence periods can be found throughout Latin America. Most of the earliest settlers were Spanish and Portuguese; after independence, the most numerous immigrants have been Europeans (Spanish, Portuguese, French, Italians, and Germans), followed by Levantine Semites, Armenians, and other Europeans (Romanians, Poles, Irish, British, Russians, Belgians, Dutch, Danes, Norwegians, Swedes, Ukrainians, Hungarians, Croats, Swiss, Greeks).[26][27][28]
Composing from 33% to 36% of the population as of 2010, according to some sources,[1][2][29] White Latin Americans constitute the largest racial-ethnic group in the region. White is the self-identification of many Latin Americans in some national censuses. According to a survey conducted by Cohesión Social in Latin America, conducted on a sample of 10,000 people from seven countries of the region, 34% of those interviewed identified themselves as white.[30]
Being white
Being white is a term that emerged from a tradition of racial classification that developed as Europeans colonized large parts of the world and employed classificatory systems to distinguish themselves from the local inhabitants. However, while most present-day racial classifications include a concept of being white that is ideologically connected to European heritage and specific phenotypic and biological features associated with European heritage, there are differences in how people are classified. These differences arise from the various historical processes and social contexts in which a given racial classification is used. As Latin America is characterized by differing histories and social contexts, there is also variance in the perception of whiteness throughout Latin America.[31]
According to Peter Wade, a specialist in race concepts of Latin America,
...racial categories and racial ideologies are not simply those that elaborate social constructions on the basis of phenotypical variation or ideas about innate difference but those that do so using the particular aspects of phenotypical variation that were worked into vital signifiers of difference during European colonial encounters with others.[32]
In many parts of Latin America being white is more a matter of socio-economic status than specific phenotypic traits, and it is often said that in Latin America "money whitens".[33] Within Latin America there are variations in how racial boundaries have been defined. In Argentina, for example, the notion of mixture has been downplayed. Alternately, in countries like Mexico and Brazil mixture has been emphasized as fundamental for nation-building, resulting in a large group of bi-racial mestizos, in Mexico, or tri-racial pardos, in Brazil,[34][35] who are considered neither fully white nor fully non-white.[36]
Unlike in the United States where ancestry may be used exclusively to define race, by the 1970s, Latin American scholars came to agree that race in Latin America could not be understood as the "genetic composition of individuals" but instead must be "based upon a combination of cultural, social, and somatic considerations". In Latin America, a person's ancestry may not be decisive in racial classification. For example, full-blooded siblings can often be classified as belonging to different races (Harris 1964).[37][38]
For these reasons the distinction between "white" and "mixed", and between "mixed" and "black" and "indigenous", is largely subjective and situational, meaning that any attempt to classify by discrete racial categories is fraught with problems.[39]
History

People of European origin began to arrive in the Americas in the 15th century since the first voyage of Christopher Columbus in 1492. After the Wars of Independence, the elites of most of the countries of the region concluded that their underdevelopment was caused by their populations being mostly Amerindian, Mestizo or Mulatto;[40] so a major process of "whitening" was required, or at least desirable.[41][42] Most Latin American countries then implemented blanqueamiento policies to promote European immigration, and some were quite successful, especially Argentina, Uruguay, and Brazil. From the late 19th century to the early 20th century, the number of European immigrants who arrived far surpassed the number of original colonists. Between 1821 and 1932, of a total 15 million immigrants who arrived in Latin America,[26] Argentina received 6.4 million, and Brazil 5.5 million.[43]
Historical demographic growth
The following table shows estimates (in thousands) of white, black/mulatto, Amerindian, and mestizo populations of Latin America, from the 17th to the 20th centuries. The figures shown are, for the years between 1650 and 1980, from the Arias' The Cry of My People...,[44] for 2000, from Lizcano's Composición Étnica....[2] Percentages are by the editor.
| Year | White | Black | Amerindian | Mestizo | Total |
|---|---|---|---|---|---|
| 1650 | 138 | 67 | 12,000 | 670 | 12,875 |
| Percentages | 1.1% | 0.5% | 93.2% | 5.2% | 100% |
| 1825 | 4,350 | 4,100 | 8,000 | 6,200 | 22,650 |
| Percentages | 19.2% | 18.1% | 35.3% | 27.3% | 100% |
| 1950 | 72,000 | 13,729 | 14,000 | 61,000 | 160,729 |
| Percentages | 44.8% | 8.5% | 8.7% | 37.9% | 100% |
| 1980 | 150,000 | 27,000 | 30,000 | 140,000 | 347,000 |
| Percentages | 43.2% | 7.7% | 8.6% | 40.3% | 100% |
| 2000 | 181,296 | 119,055 | 46,434 | 152,380 | 502,784 |
| Percentages | 36.1% | 23.6% | 9.2% | 30.3% | 100% |
Admixture
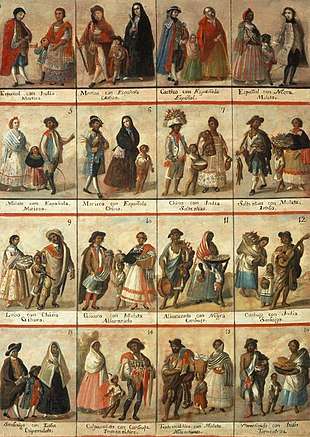
Since European colonization, Latin America's population has had a long history of intermixing, so that many Latin Americans who have Native American or sub-Saharan African or, rarely, East Asian ancestry have European ancestry as well. The casta system, a primarily race-based classification that was used in colonial Latin America designated people according to its racial background, with the main classifications being indio (used to refer to Native American people), criollo (those of complete European ancestry born in Latin America, or in cases, people who were 7/8 or more European and 1/8 Indigenous or less), castizo (3/4 European, 1/4 Indigenous), or mestizo (1/2 European, 1/2 Indigenous), negro (Sub-Saharan Africans), mulato (1/2 European, 1/2 African), zambo (1/2 African, 1/2 Indigenous), Pardo (persons with European, African and Indigenous ancestry), and Peninsulares who were Europeans born in Spain or other European countries such as Portugal in the case of Portuguese colonies.
As in Spain, persons of even remote Jewish or Moorish ancestry were not allowed to enroll in the Spanish Army or the Catholic Church in the colonies. Applicants to both institutions, and their spouses, had to obtain a Limpieza de sangre (purity of blood) certificate that proved that they had no Jewish or Moorish ancestors, in the same way as those in the Peninsula did. However, being a medieval concept that targeted exclusively those religious groups, it was never an issue among the native population in the colonies of the Spanish Empire, which by law allowed people from all racial groups to join the army, with being of the Catholic faith the only prerequisite. One notable example was that of Francisco Menendez, a freed-black military officer of the Spanish Army during the 18th century at the Gracia Real de Santa Teresa de Mose fort in St. Augustine, Florida.[45]
Although historically both Colonial and Imperial Brazil had institutionalized discrimination against citizens who were deemed people of color, it never had a casta system like that of Hispanic America. White Brazilians equivalent in status to the Hispanic criollo could have less than 80% European (overwhelmingly Portuguese) ancestry. Having some Amerindian and black African ancestry—which is widespread among white Brazilians, among all social classes in its five geographic regions since the 16th to 17th centuries–as well as having Moorish, Jewish, Arab, or Romani ancestry, affected social status less than in Hispanic America, This does not mean that the social status of "fully non-white" people (people of color who are not mulattoes, mestizos, zambos, pardos, etc.—in short, Mixed-race Brazilians—even with Caucasian features), "westernized" Brazilians with non-Caucasian phenotypes, or people with known non-European ancestry was equal to that of Brazilian elites.
Populations
The largest white population in Latin America is in Brazil, with 91 million whites out of 190.7 million total Brazilians,[46] or 47.7% of the total population, as of the 2010 census. Brazil's southern region contains the highest concentration, at 79% of the population.[3] Argentina also contains a large numbers of whites. In terms of percentage of the total population, Uruguay has the highest concentrations of whites, who constitute 92% of their total population, while Honduras has the smallest white population, with only 1%.
| Country | Percentage of the local population | Population in (millions) |
|---|---|---|
| 92[47] | 3.2 | |
| 52[48]-85[49][50][51] | 38 | |
| 82.7[52][53] | 3.2 | |
| 75.8[54] | 2.6 | |
| 64.1[55] | 7.16 | |
| 52[53] | 9.1 | |
| 47.7[56][57] | 91 | |
| 10[4] - 47[5][6] | 12.7 - 56 | |
| 43.6[9][10] | 13.1 | |
| 37[8][30] | 18.2 | |
| 20.0[2] | 1.7 | |
| 18.5[14] | 2.7 | |
| 17[18][58] | 4.3 | |
| 16[59][60] | 2.0 | |
| 12.0[61][62] | 0.6 | |
| 10[63] | 0.720 | |
| 6.1[19] | 0.883 | |
| 5.9[64] | 1.3 | |
| 5[65] | 0.950 | |
| 5 (est.)[66] | 0.524 (est.) | |
| 1.0[67][68] | 0.089 |
North America
Mexico


.jpg)
White Mexicans are for the most part descendants of Spanish immigrants who arrived mainly from northern regions of Spain such as Cantabria, Navarra, Galicia and the Basque Country;[69] however in the 19th and 20th century many non-Iberian immigrants arrived to the country, either motivated by economic opportunity (Americans, Canadians, English), government programs (Italians, Irish, Germans) or political motives such as the French during the Second Mexican Empire.[70][71] In the 20th century, international political instability was a key factor to drive immigration to Mexico; in this era Greeks, Romanians, Portuguese, Armenians, Poles, Russians, Lebanese, Palestinians and Jews,[71] along with many Spanish refugees fleeing the Spanish Civil War, also settled in Mexico[72] whereas in the 21st century, due to Mexico's economic growth, immigration from Europe has increased (mainly France and Spain), people from the United States have arrived as well, nowadays making up more than three-quarters of Mexico's roughly one million legal migrants. In that time, more people from the United States have been added to the population of Mexico than Mexicans to that of the United States, according to government data in both nations.[73]
Mexico's northern and western regions have the highest percentages of European population, according to the American historian Howard F. Cline the majority of Mexicans in these regions have no native admixture and their aspect resemble that of northern Spaniards.[74] In the north and west of Mexico, the indigenous tribes were substantially smaller than those found in central and southern Mexico, and also much less organized, thus they remained isolated from the rest of the population or even in some cases were hostile towards Mexican colonists. Because of this, Europeans often were the most numerous ethnic group within colonial cities in northern and western Mexico (albeit this trend is also seen in large central Mexican cities such as Mexico City) and became the regions with the highest proportion of whites during the Spanish colonial period.[75][76] However, recent immigrants from southern Mexico have been changing, to some degree, its demographic trends.
Estimates of Mexico's white population differ greatly in both, methodology and percentages given, extra-official sources such as the World factbook and Encyclopædia Britannica, which use the 1921 census results as the base of their estimations calculate Mexico's White population as only 9%[77] or between one tenth to one fifth[78] (the results of the 1921 census, however, have been contested by various historians and deemed inaccurate).[79] Surveys that account for phenotypical traits and have performed actual field research suggest rather higher percentages: using the presence of blond hair as reference to classify a Mexican as white, the Metropolitan Autonomous University of Mexico calculated the percentage of said ethnic group at 23%.[80] With a similar methodology, the American Sociological Association obtained a percentage of 18.8% having its higher frequency on the North region (22.3%–23.9%) followed by the Center region (18.4%–21.3%) and the South region (11.9%).[81] Another study made by the University College London in collaboration with Mexico's National Institute of Anthropology and History found that the frequencies of blond hair and light eyes in Mexicans are of 18% and 28% respectively,[82] surveys that use as reference skin color such as those made by Mexico's National Council to Prevent Discrimination and Mexico's National Institute of Statistics and Geography reported a percentages of 47% in 2010[83] and 49% in 2017[84][85] respectively. Another survey published in 2018 reported a percentage significantly lower at 29%,[86] this time however, the surveying of Mexicans from "vulnerable groups" was prioritized, which among other measures meant that states known to have high numbers of people from said groups surveyed more people.[87]
A study performed in hospitals of Mexico City reported that an average 51.8% of Mexican newborns presented the congenital skin birthmark known as the Mongolian spot whilst it was absent in 48.2% of the analyzed babies.[88] The Mongolian spot appears with a very high frequency (85-95%) in Asian, Native American, and African children.[89] The skin lesion reportedly almost always appears on South American[90] and Mexican children who are racially Mestizos,[91] while having a very low frequency (5–10%) in Caucasian children.[92] According to the Mexican Social Security Institute (shortened as IMSS) nationwide, around half of Mexican babies have the Mongolian spot.[93]
Genetic research

- 37.0% European; 56.0% Amerindian; 5.0% African (Ruiz-Linares et al., 2014). A study conducted by University College of London including several Latin American countries with the collaboration of each country's anthropology and genetics institutes, in the case of Mexico, above 90% of the analyzed samples hailed from southern Mexico and Mexico City, meaning that the northern and western regions of Mexico were underrepresented as 45% of Mexico's population lives there.
- 25.4%-48.7% European; 70.2%-46.2% Amerindian; 5.2%-2.8% African (Martínez-Cortés et al., 2017). Blood study, made from 114 polymorphisms by the Molecular Genetics Research Institute of the University of Guadalajara, in genetically heterogeneous sample, from Sinaloa, Jalisco, Yucatán and Mexico City.[96]
- In 2012, A study used a different format to present results: since from a sample in which all Mexicans participants self-identified as mestizos they were classified in a specific ethnic conglomerate depending on which was the genetic component controlling. Thus, 17.0% were classified in the African ethnic conglomerate, 44.0% in the Amerindian and 39.0% in the European. The samples came from Mexico City as well as from the states of Guanajuato, Querétaro and Puebla (Noris-Santana et al., 2012).[97]
The following four studies are etiological studies. Etiological studies are genetic studies on which all volunteers suffer of a specific health condition/disease, as the presence of diseases tend to be influenced by a determined genetic ancestry and in cases also by a person's socioeconomic level, the results of said studies are not accurate to represent the genetics of the population said volunteers belong to as a whole
- 27.3% European; 69.5% Amerindian; 3.2% African, for asthmatic children in Mexico City (Hancock et al., 2009).[98]
- 37.0% European; 61.0% Amerindian; 2.0% African, from 128 AIMs, for asthmatic Mexicans in Mexico City (Kosoy et al., 2009).[99]
- 30.0% European; 65.0% Amerindian; 5.0% African for Mexico City, from 69 AIMs, made for Mexicans with diabetes mellitus type 2 (Martínez-Marignac et al., 2007).[100]
- 38% European; 56.0% Amerindian; 6% African for northeastern Mexicans, from 74 AIMs, a study made in Nuevo León as part of a public health campaign for the detection of prostate cancer in northeastern Mexicans (Martínez-Fierro et al., 2009).[101]
While according to the 1921 census only 9.8% of the Mexican population self-identified as white in modern genetic studies Mexico consistently shows a European admixture comparable to countries whose white populations reportedly range from 52% to 77% such as Chile, (which reports a European genetic admixture of around 51%)[103] and Costa Rica (which reports a European admixture of around 60%).[104] Studies of the general Mexican population have found percentages with European ancestry of 56%,[105] 60%,[106] 64%,[107] and 78%.[108] Various authors assert that the reason for said discrepancies may lie in the "mestizaje" ideology promoted by the Mexican government at the time, which asserted that all Mexicans who didn't speak indigenous languages were "Mestizos" with no exception, thus leading white Mexicans to be identified as Mestizos.[109] The "mestizaje" ideology was completely installed in 1930, thus the white category disappeared from Mexican censuses.[110]
The aforementioned ideology has blurred the lines of race at an institutional level and has also had a significative influence in genetic studies done in Mexico:[111] As the criteria used in studies to determine if a Mexican is Mestizo or indigenous often lies in cultural traits such as the language spoken instead of racial self-identification or a phenotype-based selection there are studies on which populations who are considered to be Indigenous per virtue of the language spoken such as Nahua peoples from the state of Veracruz (located in central Mexico) show a higher degree of European genetic admixture than the one populations considered to be Mestizo report in other studies.[112] The opposite also happens, as there instances on which populations considered to be Mestizo show genetic frequencies very similar to continental European peoples in the case of Mestizos from the state of Durango (located in northern Mexico)[113] or to European derived Americans in the case of Mestizos from the state of Jalisco (located in western Mexico).[114]
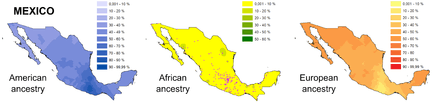
A 2012 study published by the Journal of Human Genetics found the ancestry of the Mexican mestizo population to be predominantly European (64.9%), followed by Native American (30.8%) and African (4.2%). Those with European ancestry were most prevalent in the north and west (66.7–95%), with Native American ancestry in the center and southeast (37–50%), and with African ancestry being evenly distributed throughout (0–8.8%).[107] The states that participated in this study were Aguascalientes, Chiapas, Chihuahua, Durango, Guerrero, Jalisco, Oaxaca, Sinaloa, Veracruz and Yucatan.[115]
Another study, conducted by Mexico's National Institute of Genomic Medicine (INMEGEN), reported that mestizo Mexicans were 58.96% European, 35.05% "Asian" (Amerindian mostly), and 5.03% African. Those in Sonora had the highest percentage of European ancestry (70.63%) and in Guerrero the lowest (51.98%), those in Guerrero also having shown the highest Asian percentage (37.17%). The African percentages ranged from 2.8%, in Sonora, to 11.13%, in Veracruz. 80% of the Mexican population was classed as mestizo (defined as "being racially mixed in some degree"). The study was conducted with volunteers from 6 states (Sonora, Zacatecas, Veracruz, Guanajuato, Oaxaca, and Yucatan) and an indigenous group known as Zapotecs.[116]
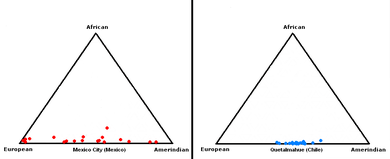
The same study found that the haplogroup of Mexico's population was most similar to that of Europeans, with the percentage of haplotypes shared being 81%, followed by the Asian haplogroup, at 74%, and finally the African haplogroup, at 64%. Investigators noted that the African admixture in general did not come from the African slaves brought by the Europeans, but was already part of the genetic makeup of the colonizers themselves.[117] Another study, of people in Mexico city, found the Mexican mestizo population—where individuals tend to be either predominantly European or Amerindian rather than tending toward an average—to be the one which shows the largest variation out of all the mestizo groups of Latin America. The results of this study are similar to the ones made by INMEGEN, with European admixture averaging 56.8%, followed by Asian (Native American) at 39.8% and African at 3.4%.[105] Additional studies suggests a higher European admixture correlates with higher socioeconomic status, and a higher Amerindian ancestry with lower: a study exclusively of low-income Mexicans found the mean admixture to be 59%, 34.8%, and 6.2% for Amerindian, European, and African respectively,[118] while a study made on Mexicans whose income was higher than the mean found their European admixture to be 81%.[119] Besides socioeconomic factors, it has been observed that European ancestry varies significativelly depending of the Mexican region that is analyzed, with it being the dominant ancestry in northern and western Mexico. Said increase however, is not progressive as European ancestry peaks in the inner-northern regions of Mexico, where states such as Zacatecas, San Luis Potosí and Nuevo León report an average of 78%.[108] Conversely, in towns and cities near the Mexico–United States border, Native American and African ancestry have a notorious resurgence.[120]
Caribbean
Cuba

White people in Cuba make up 64.1% of the total population, according to the 2012 census,[121][122] with the majority being of diverse Spanish descent. However, after the mass exodus resulting from the Cuban Revolution in 1959, the number of white Cubans actually residing in Cuba diminished. Today, the various records that claim to show the percentage of whites in Cuba are conflicting and uncertain; some reports (usually coming from Cuba) still report a similar-to-pre-1959 number of 65%, and others (usually from outside observers) report 40–45%. Despite most white Cubans being of Spanish descent, many others are of French, Portuguese, German, Italian, or Russian descent.[123] During the 18th, 19th, and early 20th centuries, large waves of Canarians, Catalans, Andalusians, Castilians, and Galicians immigrated to Cuba. Between 1901 and 1958, more than a million Spaniards arrived in Cuba from Spain; many of these and their descendants left after Castro's Communist regime took power. One further significant ethnic influx was from various Middle Eastern ethnic groups, and many Jews in particular.[124]
An autosomal study from 2014 found the genetic makeup in Cuba to be 72% European, 20% African, and 8% Native American with different proportions depending on the self-reported ancestry (White, Mulatto or Mestizo, and Black). According to this study Whites are on average 86% European, 6.7% African and 7.8% Native American with European ancestry ranging from 65% to 99%. 75% of whites are over 80% European and 50% are over 88% European[125] According to a study in 2011 Whites are on average 5.8% African with African ancestry ranging from 0% to 13%. 75% of whites are under 8% African and 50% are under 5% African[126] A study from 2009 analysed the genetic structure of the three principal ethnic groups from Havana City (209 individuals), and the contribution of parental populations to its genetic pool. A contribution from Indigenous peoples of the Americas was not detectable in the studied sample.[127]
| Self-reported ancestry | European | African | Native American |
| White | 86% | 6.7% | 7.8% |
| White (Havana) | 86% | 14% | 0% |
| Mulatto/Mestizo | 50.8% | 45.5% | 3.7% |
| Mulatto/Mestizo (Havana) | 60% | 40% | 0% |
| Black | 29% | 65.5% | 5.5% |
| Black (Havana) | 23% | 77% | 0% |
Dominican Republic


The 1750 estimates show that there were 30,863 whites, out of a total population of 70,625, in the colony of Santo Domingo.[128] The census of 1920 was the first national enumeration. The second census, taken in 1935, covered race, religion, literacy, nationality, labor force, and urban–rural residence.[129]
| Self-identifies as European / white 1750-1960 Census | ||||
|---|---|---|---|---|
| Year | Population | Percent | Total population | Ref(s) |
| 1750 | 30,863 | 43.7% | 70,625 | [128][130] |
| 1790 | 40,000 | 32.0% | 125,000 | [131][132] |
| 1846 | 80,000 | 48.5% | [133] | |
| 1920 | 223,144 | 24.9% | 894,665 | [134] |
| 1935 | 192,732 | 13.0% | 1,479,417 | [135][136] |
| 1950 | 600,994 | 28.14% | 2,135,872 | [134] |
| 1960 | 489,580 | 16.1% | 3,047,070 | [137][138] |
| 2006 Survey | 1.6 Million | 13.6% | [139] | |
According to the CIA World Factbook, white persons in the Dominican Republic are 16% of the total population,[17] with the vast majority being of Spanish descent. Notable other ancestries includes French, Italian, Lebanese, German, and Portuguese.[140][141][142]
The government of Rafael Leónidas Trujillo made a point of increasing the white population, or "whitening" the racial composition of the country, by rejecting black immigrants from Haiti and local blacks as foreigners.[143] He also welcomed Jewish refugees in 1938 and Spanish farmers in the 1950s as part of this plan.[144][145] The country's German minority is the largest in the Caribbean.[146]
Haiti
The white and the mulatto population of Haiti make up about 5% of its population, while 95% is "black".[66]
That 5% minority group comprises people of many different ethnic and national backgrounds, who are French, Spanish, Portuguese, Russian, Dutch, Swiss, Armenian, Poles (Polish legion),[147][148] Middle Eastern (especially the Jewish diaspora, arriving from the Polish legion and during the Holocaust),[147][149] Germans (18th century and World War I),[150][151] and Italian.
Martinique
White people in Martinique represent 5% of the population. As Martinique is an overseas French department, most whites are French.[152]
Puerto Rico
An early census on the island was conducted by Governor Francisco Manuel de Lando in 1530. An exhaustive 1765 census was taken by Lieutenant General Alexander O'Reilly, which, according to some sources, showed 17,572 whites out of a total population of 44,883.[128][153] The censuses from 1765 to 1887 were taken by the Spanish government who conducted them at irregular intervals. The 1899 census was taken by the United States War Department. Since 1910, Puerto Rico has been included in every decennial census taken by the United States.
_(29236398233).jpg)
| European / white population 1530-2010 per census | |||||||
|---|---|---|---|---|---|---|---|
| Year | Population | Percent | Ref(s) | Year | Population | Percent | Ref(s) |
| 1530 | 333a, 426b | 8-10.0 | a[154]b[155] | 1887 | 474,933 | 59.5 | [156] |
| 1765 | 17,572 | 39.2 | [128][130] | 1897 | 573,187 | 64.3 | [156] |
| 1775 | 30,709 | 40.4 | [157] | 1899 | 589,426 | 61.8 | [156] |
| 1787 | 46,756 | 45.5 | [157] | 1910 | 732,555 | 65.5 | [158] |
| 1802 | 78,281 | 48.0 | [156] | 1920 | 948,709 | 73.0 | [158] |
| 1812 | 85,662 | 46.8 | [156] | 1930 | 1,146,719 | 74.3 | [158] |
| 1820 | 102,432 | 44.4 | [156] | 1940 | 1,430,744 | 76.5 | [159] |
| 1827 | 150,311 | 49.7 | [156] | 1950 | 1,762,411 | 79.7 | [159] |
| 1830 | 162,311 | 50.1 | [156] | 2000 | 3,064,862 | 80.5 | [160] |
| 1836 | 188,869 | 52.9 | [156] | 2010 | 2,825,100 | 75.8 | [161] |
| 1860 | 300,406 | 51.5 | [156] | ||||
| 1877 | 411,712 | 56.3 | [156] | ||||
White Puerto Ricans of European, mostly Spanish, descent are said to comprise the majority, with 75.8% of the population identifying as white.[162] In 1899, one year after the U.S invaded and took control of the island, 61.8% identified as white. In 2000, for the first time in fifty years, the census asked people to define their race and found the percentage of whites had risen to 80.5% (3,064,862); not because there has been an influx of whites to the island (or an exodus of non-White people), but a change of race perceptions, mainly because Puerto Rican elites wished to portray Puerto Rico as the "white island of the Antilles", partly as a response to scientific racism.[163]
From the beginning of the 20th century, American observers remarked on the "surprising preponderance of the white race" on the island. One travel writer called Puerto Rico "the whitest of the Antilles". In a widely distributed piece, a geologist wrote that the island was "notable among the West Indian group for the reason that its preponderant population is of the white race". In a more academic book he reiterated that "Porto Rico, at least, has not become Africanized".[164]
During the 19th century, hundreds of Corsican, French, Middle Eastern, and Portuguese families, along with large numbers of immigrants from Spain (mainly from Catalonia, Asturias, Galicia, the Balearic Islands, Andalusia, and the Canary Islands) and numerous Spanish loyalists from Spain's former colonies in South America, arrived in Puerto Rico. Other settlers have included Irish, Scots, Germans, and Italians. Thousands of immigrants were granted land from Spain during the Real Cedula de Gracias de 1815 (Royal Decree of Graces of 1815), which allowed European Catholics to settle in the island with a certain amount of free land.
According to a genetic research by the University of Brasilia, Puerto Rican genetic admixture consists in a 60.3% European, 26.4% African, and 13.2% Amerindian ancestry.[165]
Saint Barthélemy
Most of the population in Saint Barthélemy are French-speaking descendants of the first settlers from Normandy and Brittany.[166]
Central America
Costa Rica

From the late 19th century to when the Panama Canal opened, European migrants used Costa Rica to get across the isthmus of Central America to reach the west coast of the United States (California).
In Costa Rica, estimates of the percentage of white people vary between 77%[52] and 82%,[2] or about 3.1–3.5 million people. The white and mestizo populations combined equal 83%, according to the CIA World Factbook.[167] Costa Rican European ancestry is mostly Spanish, although a significant number is descended from Italian, Greek, German, English, Dutch, French, Irish, Portuguese, Lebanese, or Polish families. Other ethnic groups include Russians, Danes, Belgians, Croats, Hungarians, Turks, Armenians and Georgians.[168]
Many of the first Spanish colonists in Costa Rica may have been Jewish converts to Christianity who were expelled from Spain in 1492 and fled to colonial backwaters to avoid the Inquisition.[169] The first sizable group of self-identified Jews immigrated from diaspora communities in Poland, beginning in 1929. From the 1930s to the early 1950s, journalistic and official anti-Semitic campaigns fueled harassment of Jews; however, by the 1950s and 1960s, the immigrants won greater acceptance. Most of the 3,500 Costa Rican Jews today are not highly observant, but they remain largely endogamous.[170]
El Salvador
According to the official 2007 Census in El Salvador, 12.7% of Salvadorans identified with being white.[171]
According to genetic research by the University of Brasilia, Salvadoran genetic admixture shows an average of 45.2% Amerindian, 45.2% European, and 9.7% African ancestry.[165]
Guatemala
| Guatemalan census | |||||
|---|---|---|---|---|---|
| Year | White | Mayan | Mestizo | Others/immigrants | |
| 1898 | 8.0 | 74.7 | 15.1 | 2.2 | |
| 1940 | 29.0 | 53.2 | 15.1 | 2.7 | |
| 1980 | 13.0 | 46.5 | 38.9 | 1.6 | |
| 2002 | 16.4 | 42.5 | 39.4 | 1.7 | |
| 2010 | 18.5 | 38.2 | 41.3 | 2.0 | |
| Census[14][172][172][173][174] Racial composition by (%) | |||||
A 2010-2012 national study estimated that white Guatemalans are 18.5% of the population (2.7 million),[14] with the majority descendants of Germans, followed those of Spaniards, French, Italians, English, Swedish, Belgian, Swiss, Danish, Norwegian, Dutch, Russian, Scottish, Irish, Welsh, and other parts of Europe. There are also descendants of Americans, Canadians, and whites from Latin American nations such as Argentina and Costa Rica.
During the 19th and 20th centuries, Guatemala had massive immigration from Germany, Belgium, and Italy, as well as, to a lesser extent, Spain, France, Great Britain, Denmark, Switzerland, Netherlands, Scandinavian countries, Ireland, and other European countries. From the mid-nineteenth century to the early twentieth, immigration from Russia, Poland, and Greece was encouraged by grants of land for coffee fincas and vineyards in the areas of Cobán, Zacapa, Guatemala City, Quetzaltenango, Chiquimula, El Progreso, and other places.[175]
By 1940, the percentage of Guatemalans of European origin had reached 29%, becoming the majority in the capital and in the east, with significant populations in Verapaces, Quetzaltenango, and several areas in the southwest. But by 1980, with a fall-off of European immigration, and a significant increase in indigenous and mestizo families, that figure had fallen to 13%. Later, after armed conflict that destroyed many non-white families, the percentage had risen, as well as that of castizos (mixture of the mestizo population and European descent) and mestizos with European predominance.[173]
Nicaragua
According to a 2014 research published in the journal Genetics and Molecular Biology and to a 2010 research published in the journal "Physical Anthropology", European ancestry predominates in majority of Nicaraguans at 69% genetic contribution, followed by Native American ancestry at 20%, and lastly Northwest African ancestry at 11%, making Nicaragua the country with one of the highest proportion of European ancestry in Latin America.[177][178] Non-genetic self-reported data from the CIA World Factbook consider that Nicaragua's population averages phenotypically at 69% Mestizo/Castizo, 17% White, 9% Afro-Latino and 5% Native American.[179] This fluctuates with changes in migration patterns. The population is 58% urban as of 2013.[180] Nicaraguan whites are mainly of Spanish, German, French, Italian, Portuguese and Belgian ancestry.
In the 19th century, Nicaragua experienced a wave of immigration, primarily from Western Europe. In particular, families moved to Nicaragua to set up businesses with the money they brought from the old continent. They established many agricultural businesses, such as coffee and sugarcane plantations, as well as newspapers, hotels, and banks.
There is also a small but important Middle Eastern–Nicaraguan community of Syrian, Armenian, Palestinian, Jewish, and Lebanese descent in Nicaragua, with a total population of about approximately 30,000.
A Japanese study called "Genomic Components in America’s demography" published in 2017, estimates that the average Nicaraguan has from 58% and 62% of European genetic background, primarily of Spanish (43.63%) but also of German, French, and Italian ancestry; 28% of indigenous American ancestry; and 14% of Northwest African origins.[181]
Panama
White Panamanians are 6.7% of the population,[182] with those of Spanish ancestry being in the majority. Other ancestries includes Dutch, English, French, German, Swiss, Danish, Irish, Greek, Italian, Lebanese, Portuguese, Polish, Russian, and Ukrainian. There is also a sizable and influential Jewish community.
Honduras
Honduras contains perhaps the smallest percentage of whites in Latin America, with only about 1% (about 89,000) of the total population being classified in this group.[12] Of these, the majority are people of Spanish descent. A white population—descendants of Palestinians—is found in the city of San Pedro Sula, and another—descended from Caymanian settlers with English, Irish, Scottish, French, German, Italian, and Greek ancestries—in the Bay Islands Department.
South America
Argentina
The ancestry of Argentines is mostly European, with both Native American and African contributions. A 2009 autosomal DNA study found the Argentine population to average 78.5 percent European, 17.3 percent Native American, and 4.2 percent sub-Saharan African, in which 63.6% of the tested group had at least one ancestor who was Indigenous[183] A 2012 autosomal DNA study found the genetic composition of Argentines to be 65% European, 31% Native American, and 4% African.[184]
Argentina's National Institute of Statistics and Censuses (INDEC) does not conduct ethnic/racial censuses; so, no official data exist on the percentage of white Argentines today. Nevertheless, various sources estimate the white population of European descent to be between 85% and 86.4%.[2][185][186][187] These figures increase to between 86.1% and 89.7% if non-European Caucasian groups (such as Jews, Lebanese, Armenians, and other Middle Easterners) are also counted. These percentages show an estimated population of 34-36 million white people in Argentina.

White Argentines are dispersed throughout the country, but their greatest concentration is in the east-central region of Pampas, the southern region of Patagonia, and in the west-central region of Cuyo. Their concentration is smaller in the north-eastern region of Litoral, and is much smaller in the north-western provinces of Salta, Jujuy, Tucumán, Catamarca, La Rioja, and Santiago del Estero, which was the most densely populated region of the country (mainly by Amerindian and Mestizo people) before the wave of immigration of 1857-1940 and was the area where European newcomers settled the least.[188][189] During the last few decades, due to internal migration from the northern provinces—as well as to immigration from Bolivia, Peru, and Paraguay—the percentage of white Argentines in certain areas of Greater Buenos Aires and the provinces of Salta and Jujuy has decreased significantly.[190]
The white population residing in Argentina is mostly descended from immigrants who arrived from Europe and the Middle East between the late 19th and early 20th centuries, with a smaller proportion from Spaniards of the colonial period. From 1506 to 1650—according to M. Möner, Peter Muschamp, and Boyd-Bowman—out of a total of 437,669 Spaniards who settled in the American Spanish colonies, between 10,500 and 13,125 Peninsulares settled in the Río de la Plata region.[191] The colonial censuses conducted after the creation of the Viceroyalty of the Río de la Plata showed that the proportion of Spaniards and Criollos was significant in the cities and surrounding countryside, but not so much in the rural areas. The 1778 census of Buenos Aires, ordered by Viceroy Juan José de Vértiz, revealed that, of a total population of 37,130 inhabitants (in both the city and surrounding countryside), the Spaniards and Criollos numbered 25,451, or 68.55% of the total. Another census, carried out in the Corregimiento de Cuyo in 1777, showed that the Spaniards and Criollos numbered 4,491 (or 51.24%) out of a population of 8,765 inhabitants. In Córdoba (city and countryside) the Spanish/Criollo people comprised a 39.36% (about 14,170) of 36,000 inhabitants.[192]
Data provided by Argentina's Dirección Nacional de Migraciones (National Bureau of Migrations) states that the country received a total 6,611,000 European and Middle Eastern immigrants during the period from 1857 to 1940.[193] The main immigrant group was 2,970,000 Italians (44.9% of the total), who came initially from Piedmont, Veneto, and Lombardy, and later from Campania, Calabria, and Sicily.[194] The second group in importance was Spaniards, some 2,080,000 (31.4% of the total), who were mostly Galicians and Basques, but also Asturians, Cantabrians, Catalans, and Andalucians. In smaller but significant numbers came Frenchmen from Occitania (239,000, 3.6% of the total) and Poles (180,000 – 2.7%). From the Russian Empire came some 177,000 people (2.6%), who were not only ethnic Russians, but also Ukrainians, Belarusians, Volga Germans, Lithuanians, etc. From the Ottoman Empire the contribution was mainly Armenians, Lebanese, and Syrians, some 174,000 in all (2.6%). Then come the immigrants from the German Empire, some 152,000 (2.2%). From the Austro-Hungarian Empire came 111,000 people (1.6%), among them Austríans, Hungarians, Croatians, Bosniaks, Serbs, Ruthenians, and Montenegrins. 75,000 immigrants came from what was then the UK, of these the majority were Irish who were escaping the potato famine or British rule. Other minor groups were the Portuguese (65,000), Slavic peoples from Yugoslavia (48,000), the Swiss (44,000), Belgians (26,000), Danes (18,000), white Americans (12,000), the Dutch (10,000), and the Swedish (7,000). Even colonists from Australia, and Boers from South Africa, can be found in the Argentine immigration records.
In the 1910s, when immigration reached its peak, more than 30% of Argentina's population had been born in Europe, and over half of the population of the city of Buenos Aires had been born abroad. According to the 1914 national census, 80% out of a total population of 7,903,662 were people who were either European, or the children and grandchildren of same. Among the remaining 20% (the descendants of the population previous to the immigratory wave), about one third were white. That makes for 86.6%, or about 6.8 million whites residing in Argentina.[197] European immigration continued to account for over half the population growth during the 1920s,[198] and for smaller percentages after World War II, many Europeans migrating to Argentina after the great conflict to escape hunger and destitution. According to Argentine records, 392,603 people from the Old World entered the country in the 1940s. In the following decade, the flow diminished because the Marshall Plan improved Europe's economy, and emigration was not such a necessity; but even then, between 1951 and 1970 another 256,252 Europeans entered Argentina.[199] From the 1960s—when whites were 76.1% of the total—onward, increasing immigration from countries on Argentina's northern border (Bolivia, Peru, and Paraguay)[200] significantly increased the process of Mestizaje in certain areas of Argentina, especially Greater Buenos Aires, because those countries have Amerindian and Mestizo majorities.[201][202][203]
In 1992, after the fall of the Communist regimes of the Soviet Union and its allies, the governments of Western Europe were worried about a possible mass exodus from Central Europe and Russia. President Carlos Menem offered to receive part of that emigratory wave in Argentina. On December 19, 1994, Resolution 4632/94 was enacted, allowing "special treatment" for applicants who wished to emigrate from the republics of the ex-Soviet Union. From January 1994 until December 2000, a total 9,399 Central and Eastern Europeans traveled and settled in Argentina. Of the total, 6,720 were Ukrainians (71.5%), 1,598 Russians (17%), 526 Romanians, Bulgarians, Armenians, Georgians, Moldovans, and Poles, and 555 (5.9%) traveled with a Soviet passport.[204] 85% of the newcomers were under age 45 and 51% had tertiary-level education, so most of them integrated quite rapidly into Argentine society, although some had to work for lower wages than expected at the beginning.[205]
Genetic studies of Argentina population:
- Homburguer et al., 2015, PLOS Genetics: 67% European, 28% Amerindian, 4% African and 1,4% Asian.[206]
- Avena et al., 2012, PLOS One: 65% European, 31% Amerindian, and 4% African.[207]
- Buenos Aires Province: 76% European and 24% others.
- South Zone (Chubut Province): 54% European and 46% others.
- Northeast Zone (Misiones, Corrientes, Chaco & Formosa provinces): 54% European and 46% others.
- Northwest Zone (Salta Province): 33% European and 67% others.
- Oliveira, 2008, on Universidade de Brasília: 60% European, 31% Amerindian and 9% African.[208]
- National Geographic: 52% European, 27% Amerindian ancestry, 9% African and 9% others.[209]
Bolivia
White people in Bolivia make up 5% of the nation's population.[65] The white population consists mostly of criollos, which consist of families of unmixed Spanish ancestry descended from the Spanish colonists and Spanish refugees fleeing the 1936–1939 Spanish Civil War. These two groups have constituted much of the aristocracy since independence. Other groups within the white population are Germans, who founded the national airline Lloyd Aéreo Boliviano, as well as Italians, Americans, Basques, Lebanese, Croats, Russians, Polish, English, Irish, and other minorities, many of whose members descend from families that have lived in Bolivia for several generations.
Brazil


Brazil is one of the few countries in Latin America that includes racial categories in its censuses: Branco (White), Negro (Black), Pardo (Multiracial), Amarelo (Yellow) and Indígena (Amerindian), with categorization being by self-identification. Taking into account the data provided by the last National Household Survey, conducted in 2010, Brazil would possess the most numerous white population in Latin America, given that a 47.7% – 91 million people – of Brazilians self-declared as "Brancos".[3] Comparing this survey with previous censuses, a slow but constant decrease in the percentage of self-identified white Brazilians can be seen: in the 2000 Census it was 53.7%,[215][216] in the 2006 Household Survey it was 49.9%,[217] and in the last, 2008, survey it decreased to the current 48.4%.[218] Some analysts believe that this decrease is evidence that more Brazilians have come to appreciate their mixed ancestry, re-classifying themselves as "Pardos".[219] Furthermore, some demographers estimate that a 9% of the self-declared white Brazilians have a certain degree of African and Amerindian ancestry, which, if the "one-drop rule" were applied, would classify them as "Pardos".[220]
The white Brazilian population is spread throughout the country, but it is concentrated in the four southernmost states, where 79.8% of the population self-identify as white.[217] The states with the highest percentage of white people are Santa Catarina (86.9%), Rio Grande do Sul (82.3%), Paraná (77.2%) and São Paulo (70.4%). Another five states that have significant proportions of whites are Rio de Janeiro (55.8%), Mato Grosso do Sul (51.7%), Espírito Santo (50.4%), Minas Gerais (47.2%) and Goiás (43.6%). São Paulo has the largest population in absolute numbers with 30 million whites.[221]
In the 18th century, an estimated 600,000 Portuguese arrived, including wealthy immigrants, as well as poor peasants, attracted by the Brazil Gold Rush in Minas Gerais.[222] By the time of Brazilian independence, declared by emperor Pedro I in 1822, an estimated 600,000 to 800,000 Europeans had come to Brazil, most of them male settlers from Portugal.[223][224] Rich immigrants who established the first sugarcane plantations in Pernambuco and Bahia, and New Christians and Gypsies fleeing from religious persecution, were among the early settlers.
After independence, Brazil saw several campaigns to attract European immigrants, which were prompted by a policy of Branqueamento (Whitening).[41] During the 19th century, the slave labor force was gradually replaced by European immigrants, especially Italians.[225] This mostly took place after 1850, as a result of the end of the slave trade in the Atlantic Ocean and the growth of coffee plantations in the São Paulo region.[226][227] European immigration was at its peak between the mid-19th and the mid-20th centuries, when nearly five million Europeans immigrated to Brazil, most of them Italians (58.5%), Portuguese (20%), Germans, Spaniards, Poles, Lithuanians, and Ukrainians. Between 1877 and 1903, 1,927,992 immigrants entered Brazil, an average of 71,000 people per year, with the peak year being 1891, when 215,239 Europeans arrived.[228]
After the First World War, the Portuguese once more became the main immigrant group, and Italians fell to third place. Spanish immigrants rose to second place because of the poverty that was affecting millions of rural workers.[229] Germans were fourth place on the list; they arrived especially during the Weimar Republic, due to poverty and unemployment caused by the First World War.[230] The numbers of Europeans of other ethnicities increased; among them were people from Poland, Russia, and Romania, who emigrated in the 1920s, probably because of politic persecution. Other peoples emigrated from the Middle East, especially from what now are Syria and Lebanon.[228] During the period 1821–1932, Brazil received an estimated 4,431,000 European immigrants.[43]
After the end of the Second World War, European immigration diminished significantly, although between 1931 and 1963 1.1 million immigrants entered Brazil, mostly Portuguese.[225] By the mid-1970s, many Portuguese had immigrated to Brazil after the independence of Portugal's African colonies—from Angola, Mozambique and Guinea-Bissau. Some came from Macao, because of the dictatorship there.[231][232]
Genetic studies
A 2015 autosomal genetic study, which also analysed data of 25 studies of 38 different Brazilian populations, concluded the following: "European (EUR) ancestry is the major contributor to the genetic background of Brazilians, followed by African (AFR), and Amerindian (AMR) ancestries. The pooled ancestry contributions were 0.62 EUR, 0.21 AFR, and 0.17AMR. The Southern region had a greater EUR contribution (0.77) than other regions. Individuals from the Northeast (NE) region had the highest AFR contribution (0.27) whereas individuals from the North regions had more AMR contribution (0.32)".[233]
| Region[233] | European | African | Native American |
|---|---|---|---|
| North Region | 51% | 16% | 32% |
| Northeast Region | 58% | 27% | 15% |
| Central-West Region | 64% | 24% | 12% |
| Southeast Region | 67% | 23% | 10% |
| South Region | 77% | 12% | 11% |
An autosomal study from 2013, of nearly 1,300 samples from all regions of Brazil, found predominantly European ancestry, combined with African and Native American contributions in varying degrees:
Following an increasing North to South gradient, European ancestry was the most prevalent in all urban populations (with values up to 74%). The populations in the North consisted of a significant proportion of Native American ancestry that was about two times higher than the African contribution. Conversely, in the Northeast, Center-West and Southeast, African ancestry was the second most prevalent. At an intrapopulation level, all urban populations were highly admixed, and most of the variation in ancestry proportions was observed between individuals within each population rather than among population.[234]
| Region | European | African | Native American |
|---|---|---|---|
| North Region | 51% | 17% | 32% |
| Northeast Region | 56% | 28% | 16% |
| Central-West Region | 58% | 26% | 16% |
| Southeast Region | 61% | 27% | 12% |
| South Region | 74% | 15% | 11% |
According to an autosomal DNA study conducted in 2011—of nearly 1000 white, pardo, and black samples proportional to population—European ancestry is predominant in all regions of Brazil, with African and Native American contributions. According to this study, European ancestry accounts for 70% of the population.[235] This study verified that Brazilians from different regions are genetically more homogenous than some expected.[236] The 2011 autosomal study samples came from blood donors (the lowest classes constituting the great majority of blood donors in Brazil),[237] as well as public health personnel and students.
| Region [235] | European | African | Native American |
|---|---|---|---|
| Northern Brazil | 68.80% | 10.50% | 18.50% |
| Northeast of Brazil | 60.10% | 29.30% | 8.90% |
| Southeast Brazil | 74.20% | 17.30% | 7.30% |
| Southern Brazil | 79.50% | 10.30% | 9.40% |
According to a DNA study from 2010,
a new portrayal of each ethnicity contribution to the DNA of Brazilians, obtained with samples from the five regions of the country, has indicated that, on average, European ancestors are responsible for nearly 80% of the genetic heritage of the population. The variation between the regions is small, with the possible exception of the South, where the European contribution reaches nearly 90%.
The results, published by the scientific magazine American Journal of Human Biology by a team of the Catholic University of Brasília, show that, in Brazil, physical indicators such as skin, eye, and hair colour have little to do with the genetic makeup (regardless of census classification) of each person, as has been shown in previous studies.[238]
Ancestry informative SNPs can be useful to estimate individual and population biogeographical ancestry. Brazilian population is characterized by a genetic background of three parental populations (European, African, and Brazilian Native Amerindians) with a wide degree and diverse patterns of admixture. In this work we analyzed the information content of 28 ancestry-informative SNPs into multiplexed panels using three parental population sources (African, Amerindian, and European) to infer the genetic admixture in an urban sample of the five Brazilian geopolitical regions. The SNPs assigned apart the parental populations from each other and thus can be applied for ancestry estimation in a three hybrid admixed population. Data was used to infer genetic ancestry in Brazilians with an admixture model. Pairwise estimates of F(st) among the five Brazilian geopolitical regions suggested little genetic differentiation only between the South and the remaining regions. Estimates of ancestry results are consistent with the heterogeneous genetic profile of Brazilian population, with a major contribution of European ancestry (0.771) followed by African (0.143) and Amerindian contributions (0.085). The described multiplexed SNP panels can be useful tool for bio-anthropological studies but it can be mainly valuable to control for spurious results in genetic association studies in admixed populations.[239]
It is important to note that "the samples came from free of charge paternity test takers". Thus, as the researchers make explicit, "the paternity tests were free of charge, the population samples involved people of various socioeconomic strata, although "likely to be leaning slightly towards the pardo group".[240]
| Region[240] | European | African | Native American |
|---|---|---|---|
| North Region | 71.10% | 18.20% | 10.70% |
| Northeast Region | 77.40% | 13.60% | 8.90% |
| Central-West Region | 65.90% | 18.70% | 11.80% |
| Southeast Region | 79.90% | 14.10% | 6.10% |
| South Region | 87.70% | 7.70% | 5.20% |
An autosomal DNA study from 2009 found a similar profile: "all the Brazilian samples (regions) lie more closely to the European group than to the African populations or to the Mestizos from Mexico".[241]
| Region[242] | European | African | Native American |
|---|---|---|---|
| North Region | 60.6% | 21.3% | 18.1% |
| Northeast Region | 66.7% | 23.3% | 10.0% |
| Central-West Region | 66.3% | 21.7% | 12.0% |
| Southeast Region | 79.1% | 14.9% | 7.0% |
| South Region | 81.5% | 9.3% | 9.2% |
According to an autosomal genetic study by the University of Brasilia, in 2008, the composition of Brazil is about 65% European, 25% African, and 9% Native American.[165]
São Paulo state, the most populous state in Brazil, with about 40 million people, showed the following composition, according to an autosomal study from 2006: European genes account for 79% of the heritage of the people of São Paulo, 14% are of African origin, and 7% Native American.[243] A more recent study, from 2013, found the following composition in São Paulo state: 61.9% European, 25.5% African and 11.6% Native American.[244]
A genetic study presented by the Brazilian Journal of Medical and Biological Research found that, on average, "white" Brazilians have >70% European genomic ancestry, whereas "black" Brazilians have 37.1% European ancestry. It concluded that "The high ancestral variability observed in whites and blacks suggests that each Brazilian has a singular and quite individual proportion of European, African and Amerindian ancestry in his/her mosaic genomes. Thus, the only possible basis to deal with genetic variation in Brazilians is not by considering them as members of colour groups, but on a person-by-person basis, as 190 million human beings, with singular genome and life histories".[245]
Chile


- 67,9 % European; 32,1 % amerindian; (Valenzuela, 1984): Marco de referencia sociogenético para los estudios de salud pública en Chile, fuente: Revista Chilena de Pediatría.[246][247]
- 64,0 % European; 35,0 % amerindian; (Cruz-Coke, 1994): Genetic epidemiology of single gene defects in Chile, fuente: Universidad de Chile.[248]
- 57,2 % European; 38,7 % amerindian; 2,5 % African; 1,7 % Asiatic; (Homburger et al., 2015): Genomic Insights into the Ancestry and Demographic History of South America, fuente: PLOS Genetics.[249]
A 2015 autosomal DNA study found Chile to be 55.16% European, 42.38% Native American and 2.44% African, using LAMP-LD modeling; and 54.38% European, 43.22% Native American, and 2.40% African, using RFMix.[250] An autosomal DNA study from 2014 found the results to be 51.85% (± 5.44%) European, 44.34% (± 3.9%) Native American, and 3.81% (± 0.45%) African.[103][251]
Studies estimates the white population at 20%,[252] to 52.7% of the Chilean population.[2] According to genetic research by the University of Brasilia, Chilean genetic admixture consists of 51.6% European, 42.1% Amerindian, and 6.3% African ancestry.[165] According to an autosomal genetic study of 2014 carried out among soldiers in the city of Arica, Northern Chile, the European admixture goes from 56.8% in soldiers born in Magallanes to 41.2% for the ones who were born in Tarapacá.[253] According to a study from 2013, conducted by the Candela Project in Northern Chile as well, the genetic admixture of Chile is 52% European, 44% Native American, and 4% African.[254]
According to a study performed in 2014,[255] 37.9% of Chileans self-identified as white, a subsequent DNA tests showed that the average self identifying white was genetically 54% European.
Genotype and phenotype in Chileans vary according to social class. 13% of lower-class Chileans have at least one non-Hispanic European surname, compared to 72% of those who belong to the upper-middle-class.[256] Phenotypically, only 9.6% of lower-class girls have light-colored eyes—either green or blue—where 31.6% of upper-middle-class girls have such eyes.[256] Blonde hair is present in 2.2% and 21.3%, of lower-class and upper-middle girls respectively,[256] whilst black hair is more common among lower-class girls (24.5%) than upper-middle class ones (9.0%).[256]
Chile was usually an unattractive place for migrants, simply because it was far from Europe and relatively difficult to reach. However, during the 18th century an important flux of emigrants from Spain populated Chile. They were mostly Basques, who vitalized the economy and rose rapidly in the social hierarchy, becoming part of the political elite that still dominates the country.[257][258] An estimated 1.6 million (10%) to 3.2 million (20%) Chileans have a surname (one or both) of Basque origin.[259][260][261][262][263][264][265][266] The Basques liked Chile because of its similarity to their native land: cool climate, with similar geography, fruits, seafood, and wine.[258]
The Spanish was the most significant European immigration to Chile,[267] although there was never a massive immigration, such as happened in neighboring Argentina and Uruguay,[268] and, therefore, the Chilean population wasn't "whitened" to the same extent.[268] However, it is undeniable that immigrants have played a role in Chilean society.[268] Between 1851 and 1924, Chile received only 0.5% of the total European immigration to Latin America, compared to 46% for Argentina, 33% for Brazil, 14% for Cuba, and 4% for Uruguay.[267] This was because such migrants came across the Atlantic, not the Pacific, and before the construction of the Panama Canal,[267] Europeans preferring to settle in countries close to their homelands, instead of taking the long route through the Straits of Magellan or across the Andes.[267] In 1907, the European-born reached a peak of 2.4% of the Chilean population,[269] decreasing to 1.8% in 1920,[270] and 1.5% in 1930.[271]
It is estimated that nearly 5% of the Chilean population is of Asian descent, chiefly from the Middle East—i.e., Jews/Israelis, Palestinians, Syrians, and Lebanese—totaling about 800,000.[272][273] Chile is home to a large population of immigrants, mostly Christian, from the Levant.[272] Roughly 500,000 Palestinian descendants are believed to reside in Chile.[274][275][276][277][278]
About 5% of the Chilean population has some French ancestry.[279] Over 700,000 (4.5%) Chileans may be of British (English, Scottish and Welsh) or Irish origin.[280] Another significant immigrant group is Croatian. The number of their descendants today is estimated to be 380,000, or 2.4% of the population.[281][282] Other authors claim that close to 4.6% of the Chilean population must have some Croatian ancestry.[283]
After the failed liberal revolution of 1848 in the German states,[268][284] a significant German immigration took place, laying the foundation for the German-Chilean community. Sponsored by the Chilean government, to "unbarbarize" and colonize the southern region,[268] these Germans (including German-speaking Swiss, Silesians, Alsatians and Austrians) settled mainly in Valdivia, Llanquihue, Chiloé, and Los Ángeles.[285] The Chilean Embassy in Germany estimated that 150,000 to 200,000 Chileans are of German origin.[286][287]
184,000 are descendants of Italians.[288] Chileans of Greek descent are estimated to number 90,000 to 120,000,[289] most of them living in the Santiago or the Antofagasta areas, Chile being one of the top 5 countries in terms of number of Greek descendants.[290] The descendants of the Swiss number 90,000[291] Other groups of European descendants are found in smaller numbers.
Colombia
According to the 2005 Census 86% of Colombians do not identify with any ethnic group, thus being considered either White or Mestizo, which are not categorized separately. Though the census does not identify the number of white Colombians, Hudson estimates that 37% of the Colombian population can be categorized as white, forming the second largest racial group after Mestizo Colombians (at 49%).[292] According to genetic research by the University of Brasilia, Colombian genetic admixture indicates 45.9% European, 33.8% Amerindian, and 20.3% African ancestry.[165]


Within 100 years after the first Spanish settlement, nearly 95 percent of all Native Americans in Colombia had died. The majority of the deaths of Native Americans were the cause of diseases such as measles and smallpox, which were spread by European settlers. Many Native Americans were also killed by armed conflicts with European settlers.
White Colombians are mostly descendants of Spaniards, although Italian, German, Irish, Portuguese, Slavic, and Lebanese Colombians are found in significant numbers. Many Spanish colonists came searching for gold, while other Spaniards established themselves as leaders of social organizations teaching natives the Christian faith and the ways of European civilization. Catholic priests provided education for Native Americans that otherwise was unavailable.
Between 1540 and 1559, 8.9 percent of the residents of Colombia were of Basque origin. It has been suggested that the present day incidence of business entrepreneurship in the region of Antioquia is attributable to the Basque immigration and character traits. Today many Colombians of the Department of Antioquia region preserve their Basque ethnic heritage. In Bogota, there is a small district/colonies of Basque families who emigrated as a consequence of Spain's Civil War or because of better opportunities.[294] Basque priests were the ones that introduced handball into Colombia. Basque immigrants in Colombia were devoted to teaching and public administration. In the first years of the Andean Multinational Company, Basque sailors navigated as captains and pilots on the majority of the ships until the country was able to train its own crews.[295]
The first and largest wave of immigration from the Middle East began around 1880, and continued during the first two decades of the twentieth century. The immigrants were mainly Maronite Christians from Greater Syria (Syria and Lebanon) and Palestine, fleeing those then Ottoman territories.[296] Syrians, Palestinians, and Lebanese have continued to settle in Colombia. Due to a lack of information, it is impossible to know the exact number of Lebanese and Syrians that immigrated to Colombia; but for 1880 to 1930, 5,000–10,000 is estimated. Syrians and Lebanese are perhaps the biggest immigrant group next to the Spanish since independence. Those who left their homeland in the Middle East to settle in Colombia left for different religious, economic, and political reasons. In 1945, Barranquilla, Cartagena, Cali, and Bogota are the cities with the largest numbers of Arabic-speakers in Colombia.[297] The Arabs that went to Maicao were mostly Sunni Muslim, with some Druze and Shiites, as well as Orthodox and Maronite Christians. The mosque of Maicao is the second largest mosque in Latin America. Middle Easterns are generally called Turcos (Turkish).[296]
In December 1941 the United States government estimated that there were 4,000 Germans living in Colombia. There were some Nazi agitators in Colombia, such as Barranquilla businessman Emil Prufurt. Colombia invited Germans who were on the U.S. blacklist to leave.[298] SCADTA, a Colombian-German air transport corporation, which was established by German expatriates in 1919, was the first commercial airline in the western hemisphere.[299] In recent years, the celebration of Colombian-German heritage has grown increasingly popular in Bogota, Cartagena, and Bucaramanga. There are many annual festivals that focus German cuisine, specially pastry arts and beer. Since 2009, there has been a considerable increase in collaborative research through advanced business and educational exchanges, such as those promoted by COLCIENCIAS and AIESEC. There are many Colombian-German companies focused on finance, science, education, technology and innovation, and engineering.[300]
Ecuador
According to the 2010 National Population Census, 6.1% of the population self-identified as white, down from 10.5% in 2001.[301] In Ecuador, being white is more an indication of social class than of ethnicity. Classifying oneself as white is often done to claim membership to the middle class and to distance oneself from the lower class, which is associated being "Indian". For this reason the status of blanco is claimed by people who are not primarily of European heritage.[302] According to genetic research by the University of Brasilia, Ecuadorian genetic admixture indicates 64.6% Amerindian, 31.0% European, and 4.4% African ancestry.[165]
White Ecuadorians, mostly criollos, are descendants of Spanish colonists and also Spanish refugees fleeing the 1936–1939 Spanish Civil War. Most still hold large amounts of lands, mainly in the northern Sierra, and live in Quito or Guayaquil. There is also a large number of white people in Cuenca, a city in the southern Andes of Ecuador, due to the arrival of Frenchmen in the area, who came to measure the arc of the Earth. Cuenca, Loja, and the Galápagos attracted German immigration during the early 20th century. The Galápagos also had a small Norwegian fishing community until they were asked to leave. There are sizable populations of Italian, French, German, Basque, Portuguese, and Greek descent, as well as a small Ecuadorian Jewish population. Ecuador's Jews consists of Sephardic Jews arriving in the South of the country in the 16th and 17th centuries and Ashkenazi Jews during the 1930s in the main cities of Quito and Cuenca.[303]
French Guiana
12% of the population is white, mostly French.[304]
Paraguay
Ethnically, culturally, and socially, Paraguay has one of the most homogeneous populations in South America. Because of José Gaspar Rodríguez de Francia's 1814 policy that no white Spaniards and Europeans could intermarry among themselves (they could only marry blacks, mulattoes, mestizos or the native Guaraní), a measure taken to avoid a white majority occurring in Paraguay (De Francia believed that all men were equal as well), it was within little more than one generation that most of the population were of mixed racial origin.
The exact percentage of the white Paraguayan population is not known because the Paraguayan census does not include racial or ethnic identification, save for the indigenous population,[305] which was 1.7% of the country's total in the 2002 census.[306] Other sources estimate the sizes of other groups, the mestizo population being estimated at 95% by the CIA World Factbook, with all other groups totaling 5%.[307][308] Thus, whites and the remaining groups (Asians, Afro-Paraguayans, others) make up approximately 3.3% of the total population. According to Lizcano, in 2005 a fifth of population or 20% are white and 75% approximately is mestizo.[2] Such a reading is complicated, because, as elsewhere in Latin America, "white" and "mestizo" are not mutually exclusive (people may identify as both).
Due to the European migration in the 19th and 20th centuries, the majority of whites are of German descent (including Mennonites), with others being of French, Italian, Spanish, and Portuguese descent.[309] Many are southern and southeastern Brazilians (brasiguayos), as well as Argentines and Uruguayans, and their descendants.[309] People from such regions are generally descendants of colonial settlers and/or more recent immigrants.[309]
In 2005, 600 families of Volga Germans who migrated to Germany after the fall of the Soviet Union, re-migrated and established a new colony, Neufeld, near Yuty (Caazapá Department), in southeastern Paraguay.[310]
Peru

According to the 2017 census 5.9% or 1.3 million people self-identified as white of the population who were aged 12 and above. This was the first time the census had asked an ancestral identity question. The highest proportion was in the La Libertad Region with 10% identifying as white.[64] They are descendants primarily of Spanish colonists, and also of Spanish refugees fleeing the Spanish Civil War. After World War II, many German refugees fled to Peru and settled in large cities, while others descend from Italian, French (mainly Basques), Austrian or German, Portuguese, British, Russians, Croats, Lebanese, Jordanian, and Syrian immigrant families. The majority of whites live in the largest cities, and are concentrated in the northern coastal cities of Trujillo, Chiclayo, Piura, and the capital, Lima. Cajamarca, the Amazonas and San Martín regions, and the highlands of northwestern Peru are also places with strong Spanish, and other European, ethnic presence. The only southern city with a significant white population is Arequipa.
According to a genetic research by the University of Brasilia, Peruvian genetic admixture indicates 73.0% Amerindian, 15.1% European, and 11.9% African ancestry.[165]
Uruguay

.jpg)

A 2009 DNA study in the American Journal of Human Biology showed the genetic composition of Uruguay as primarily European, with Native American ancestry ranging from one to 20 percent and sub-Saharan African from seven to 15 percent, depending on the region.[311]
Between the mid-19th and the early 20th centuries, Uruguay received part of the same migratory influx as Argentina, although the process started a bit earlier. During 1850–1900, the country welcomed four waves of European immigrants, mainly Spaniards, Italians and Frenchmen. In smaller numbers came British, Germans, Swiss, Russians, Portuguese, Poles, Bulgarians, Hungarians, Ukrainians, Lithuanians, Estonians, Dutch, Belgians, Croatians, Lebanese, Armenians, Greeks, Scandinavians, and Irish. The demographic impact of these migratory waves was greater than in Argentina, Uruguay going from having 70,000 inhabitants in 1830, to 450,000 in 1875, and a million inhabitants by 1900, its population thus increasing fourteen-fold in only 70 years. Between 1840 and 1890, 50%–60% of Montevideo's population was born abroad, almost all in Europe. The Census conducted in 1860 showed that 35% of the country's population was made up by foreigners, although by the time of the 1908 Census this figure had dropped to 17%.[312]
From 1996 to 1997, the National Institute of Statistics (INE) of Uruguay conducted a Continuous Household Survey, of 40,000 homes, that included the topic of race in the country. Its results were based on "the explicit statements of the interviewee about the race they consider they belong themselves". These results were extrapolated, and the INE estimated that out of 2,790,600 inhabitants, some 2,602,200 were white (93.2%), some 164,200 (5.9%) were totally or partially black, some 12,100 were totally or partially Amerindian (0.4%), and the remaining 12,000 considered themselves Yellow.[313]
In 2006, a new Enhanced National Household Survey touched on the topic again, but this time emphasizing ancestry, not race; the results revealed 5.8% more Uruguayans stated having total or partial black and/or Amerindian ancestry. This reduction in the percentage of self-declared "pure whites" between surveys could be caused by the phenomenon of the interviewee giving new value to their African heritage, similar to what has happened in Brazil in the last three censuses. Anyway, it is worth noting that 2,897,525 interviewées declared having only white ancestry (87.4%), 302,460 declared having total or partial black ancestry (9.1%), 106,368 total or partial Amerindian ancestry (2.9%) and 6,549 total or partial Yellow ancestry (0.2%).[314] This figure matches external estimates for white population in Uruguay of 87.4%,[315] 88%,[2][316] or 90%.[317]
Recently many European and American immigrants have entered the country seeking peace and security, or escaping from the pollution and voracious tax systems in their countries of origin. In 1997, the Uruguayan government granted residence rights to only 200 European/American citizens; in 2008 the number of residence rights granted increased to 927.[318]
Venezuela


According to the official Venezuelan census, although "white" literally involves external issues such as light skin, shape and color of hair and eyes, among others, the term "white" has been used in different ways in different historical periods and places, and so its precise definition is somewhat confusing.[9] For this reason, White Venezuelan is used to describe the Venezuelan citizen of European origin.
According to the 2011 National Population and Housing Census, 43.6% of the population identified themselves as white people.[9] A genomic study shows that about 60.6% of the Venezuelan gene pool has European origin. Among the Latin American countries in the study (Argentina, Bahamas, Brazil, Chile, Costa Rica, Colombia, El Salvador, Ecuador, Jamaica, Mexico, Peru, Puerto Rico, and Venezuela), Colombia, Brazil, Venezuela, and Argentina exhibit the highest European contribution.[319]
The Venezuelan gene pool indicates a 60.6% European, 23.0% Amerindian, and 16.3% African ancestry.[165] Spaniards were introduced into Venezuela during the colonial period. Most of them were from Andalusia, Galicia, Basque Country and from the Canary Islands. Until the last years of World War II, a large part of European immigrants to Venezuela came from the Canary Islands, and their cultural impact was significant, influencing its gastronomy, customs and the development of Castilian in the country. With the beginning of oil production during the first decades of the 20th century, employees of oil companies from the United States, United Kingdom, and the Netherlands established themselves in Venezuela. Later, in the middle of the century, there was a new wave of immigrants originating from Spain (mainly from Galicia, Andalucia, and Basque country, some being refugees from the Spanish Civil War), Italy (mainly from southern Italy and the Veneto region), and Portugal (from Madeira), as well as from Germany, France, England, Croatia, the Netherlands, other European countries, and the Middle East (Lebanon and Syria), encouraged by a welcoming immigration policy to a prosperous, rapidly developing country where educated and skilled immigrants were needed.
Representation in the media
Some American media outlets have criticized Latin American media for allegedly featuring a disproportionate number of blond and blue-eyed white actors and actresses in telenovelas, relative to non-whites.[320][321][322][323][324][325][326][327]
See also
References
- CIA data from The World Factbook's Field Listing :: Ethnic groups and Field Listing :: Population, retrieved on May 09 2011. They show 191,543,213 whites from a total population of 579,092,570. For a few countries the percentage of white population is not provided as a standalone figure, and thus that datum is considered to be not available; for example, in Chile's case the CIA states "white and white-Amerindian 95.4%". Unequivocal data are given for the following: Argentina 41,769,726 * 97% white = 40,516,634; Bolivia 10,118,683 * 5% white = 505,934; Brazil 203,429,773 * 53.7% white = 109,241,788; Colombia 44,725,543 * 20% white = 8,945,109; Cuba 11,087,330 * 65.1% white = 7,217,852; Dominican Republic 9,956,648 * 16% white = 1,593,064; El Salvador 6,071,774 * 9% white = 546,460; Honduras 8,143,564 * 1% white = 81,436; Mexico 113,724,226 * 9% white = 10,235,180; Nicaragua 5,666,301 * 17% white = 963,272; Panama 3,460,462 * 10% white = 346,046; Peru 29,248,943 * 15% white = 4,387,342; Puerto Rico 3,989,133 * 76.2% white = 3,039,719; Uruguay 3,308,535 * 88% white = 2,911,511. Total white population in these countries: 191,543,213, i.e 33.07% of the region's population.
- Lizcano Fernández, Francisco (May–August 2005). "Composición Étnica de las Tres Áreas Culturales del Continente Americano al Comienzo del Siglo XXI" (PDF). Convergencia (in Spanish). Mexico: Universidad Autónoma del Estado de México, Centro de Investigación en Ciencias Sociales y Humanidades. 38: 185–232, table on p. 218. ISSN 1405-1435. Archived from the original (PDF) on 20 September 2008.
- "Censo Demográfico 2010: Características gerais da população, religião e pessoas com deficiência" [Census 2010: general characteristics of the population, religion and people with disabilities]. Instituto Brasileiro de Geografia e Estatística (in Portuguese). 2010. Retrieved 7 October 2016.
- "The World Factbook: North America: Mexico". Central Intelligence Agency. 2020. Retrieved 17 May 2020.
- "21 de Marzo Día Internacional de la Eliminación de la Discriminación Racial" pag.7, CONAPRED, Mexico, 21 March. Retrieved on 28 April 2017.
- "Encuesta Nacional Sobre Discriminación en Mexico", "CONAPRED", Mexico DF, June 2011. Retrieved on 28 April 2017.
- "Documento Informativo Sobre Discriminación Racial En México", CONAPRED, Mexico, 21 March 2011, retrieved on 28 April 2017.
- "Colombia: A Country Study" (PDF). Federal Research Division of the Library of Congress. The Library of Congress of the United States of America. 2010. pp. 86–87.
- "Resultado Básico del XIV Censo Nacional de Población y Vivienda 2011 (Mayo 2014)" (PDF). Ine.gov.ve. p. 29. Retrieved 8 September 2014.
- "DEMOGRÁFICOS : Censos de Población y Vivienda". Ine.gov.ve. Retrieved 8 October 2017.
- The Official 2012 Cuba Census Archived June 3, 2014, at the Wayback Machine
- "Honduras; People; Ethnic groups". CIA World Factbook. Retrieved 2007-11-21.
- "Uruguay: People and Society". CIA World Factbook. Retrieved 5 February 2014.
- "Caracterización estadística República de Guatemala 2012" (PDF). INE. Archived from the original on November 2012. Retrieved 2014-11-02.
- "American Fact Finder". United States Census Bureau. 2010. Archived from the original on 12 February 2020. Retrieved 25 Sep 2013.
- "Perú: Perfil Sociodemográfico" (PDF). Instituto Nacional de Estadística e Informática. p. 220.
- "D.R.: People; Ethnic groups". CIA World Factbook. Retrieved 2007-11-26.
- "Reconstructing the Population History of Nicaragua by Means of mtDNA, Y-Chromosome STRs, and Autosomal STR Markers". Retrieved 2019-07-15.
- "Resultados del Censo 2010". Instituto Nacional de Estadística y Censos. 2010. Retrieved 1 November 2013.
- José Reyes Alveo. "Población panameña (página 2)". Monografias.com. Retrieved 8 October 2017.
- More precisely, these are the chief languages of Latin America, as per CIA – The World Factbook – Field Listing :: Languages, accessed 2010-02-24.
- The religious profile of the Latin American countries can be seen in CIA – The World Factbook – Field Listing :: Religions (accessed 2010-02-24). As such, it is not the religious profile of white Latin Americans in particular, but is a good indication of white religious affiliation in the region's white-majority countries, especially.
- Schaefer, Richard T. (ed.) (2008). Encyclopedia of Race, Ethnicity and Society. Sage. p. 900. ISBN 978-1-4129-2694-2.
In New Spain, there was no strict idea of race (something that continued in Mexico). The Indians that had lost their connections with their communities and had adopted different cultural elements could "pass" and be considered mestizos. The same applied to blacks and castas. Rather, the factor that distinguished the various social groups was their calidad ("quality"); this concept was related to an idea of blood as conferring status, but there were also other elements, such as occupation and marriage, that could have the effect of blanqueamiento (whitening) on people and influence their upward social mobility.
CS1 maint: extra text: authors list (link) - Chambers, Sarah C. (2003). "Little Middle Ground The Instability of a Mestizo Identity in the Andes, 18th and 19th centuries". In Nancy P. Appelbaum (ed.). Race and Nation in Modern Latin American. University of North Carolina Press.
This blending of culture and genealogy is also reflected in the use of the terms "Spanish" and "white". For most of the colonial period, Americans of European descent were simply referred to as "Spaniards"; beginning in the late 18th century, the term "blanco" (white) came into increasing but not exclusive use. Even those of presumably mixed ancestry may have felt justified in claiming to be Spanish (and later white) if they participated in the dominant culture by, for example, speaking Spanish and wearing European clothing.(p. 33)
- Schaefer, Richard T. (ed.) (2008). Encyclopedia of Race, Ethnicity and Society. Sage. p. 1096. ISBN 978-1-4129-2694-2.
The variation of racial groupings between nations is at least partially explained by an unstable coupling between historical patterns of colonization and miscegenation. First, divergent patterns of colonization may account for differences in the construction of racial groupings, as evidenced in Latin America, which was colonized primarily by the Spanish. The Spanish colonials had a longer history of tolerance of non-White racial groupings through their interactions with the Moors and North African social groups, as well as a different understanding of the rights of colonized subjects and a different pattern of economic development.
CS1 maint: extra text: authors list (link) - South America: Postindependence overseas immigrants. Encyclopædia Britannica Retrieved 26-11-2007
- Schrover, Marlou. "Migration to Latin America". Retrieved 2010-02-24.
- CELADE (Organization) (2001). International migration and development in the Americas. ISBN 9789211213287.
- "Las etnias centroamericanas en la segunda mitad del siglo XX" (PDF). Retrieved 2011-05-04. Cite journal requires
|journal=(help) - Schwartzman, Simon (2007). "Etnia, condiciones de vida y discriminacion" (PDF). Schwartzman.org.br. Retrieved 8 October 2017.
- Chambers, Sarah C. (2003). "Little Middle Ground The Instability of a Mestizo Identity in the Andes, 18th and 19th centuries". In Nancy P. Appelbaum (ed.). Race and Nation in Modern Latin American. University of North Carolina Press.
This blending of culture and genealogy is also reflected in the use of the terms Spanish and white. For most of the colonial period, Americans of European descent were simply referred to as Spaniards; beginning in the late 18th century, the term blanco (white) came into increasing but not exclusive use. Even those of presumably mixed ancestry may have felt justified in claiming to be Spanish (and later white) if they participated in the dominant culture by, for example, speaking Spanish and wearing European clothing.(p. 33)
- Wade, Peter. 1997. Race and Ethnicity in Latin America. Critical Studies On Latin America. Pluto Press p. 15
- Levine-Rasky, Cynthia. 2002. "Working through whiteness: international perspectives. SUNY Press (p. 73) " 'Money whitens' If any phrase encapsulates the association of whiteness and the modern in Latin America, this is it. It is a cliché formulated and reformulated throughout the region, a truism dependent upon the social experience that wealth is associated with whiteness, and that in obtaining the former one may become aligned with the latter (and vice versa)."
- IBGE. "IBGE - sala de imprensa - notícias". ibge.gov.br.
- Do pensamento racial ao pensamento racional Archived May 22, 2014, at the Wayback Machine, laboratoriogene.com.br.
- Wade, Peter (2008). "Race in Latin America". In Poole, Deborah (ed.). Companion to Latin American Anthropology. Blackwell publishing. p. 182.
The nature of Latin American societies as mestizo – with the variations that run from Argentina, where the image of mixture is downplayed in favor of whiteness, to Brazil or Mexico, where mixture is foregrounded in discourse on the nation – has powerfully shaped ideas about race in the region.
- "Sample Chapter for Telles, E.E.: Race in Another America: The Significance of Skin Color in Brazil". princeton.edu. Archived from the original on 2012-01-25. Retrieved 2011-12-05.
- The Japanese in multiracial Peru, 1899-1942. eScholarship (Thesis). UC San Diego. 2009.
- Wade, Peter (2008). "Race in Latin America". In Poole, Deborah (ed.). Companion to Latin American Anthropology. Blackwell publishing. p. 184.
However, "black" and "indigenous" are often vaguely defined and there is an indecisive, subjective distinction between them and "mixed" and between the latter and "white" (hence the problems of enumerating these populations).
- "L'emigració dels europeus cap a Amèrica" [The Emigration of Europeans to America] (PDF). EduAlter.org (in Catalan). Retrieved 26 March 2018.
- Ideologia do Branqueamento - Racismo á Brasileira? por Andreas Haufbauer
- "Whiteness in Latin America: Measurement and Meaning in National Censuses (1850-1950)" Archived 2011-09-27 at the Wayback Machine by Mara Loveman. Journal de la Société des Américanistes. Vol. 95-2, 2009.
- Argentina. by Arthur P. Whitaker. New Jersey: Prentice Hall Inc, 1984. Cited in Yale immigration study
- The Cry of My People. Out of Captivity in Latin America, escrita por Esther and Mortimer Arias. Editorial New York Friendship Press. 1980. Páginas 17 y 18.
- Landers, Jane (1999). Black society in Spanish Florida. University of Illinois Press. p. 29. ISBN 0-252-06753-3.
- "IBGE | Portal do IBGE | IBGE". www.ibge.gov.br. Archived from the original on January 17, 2013.
- Central Intelligence Agency (2016). "Uruguay". The World Factbook. Langley, Virginia: Central Intelligence Agency. Retrieved 1 January 2017.
- "Reference Populations – Geno 2.0 Next Generation". National Geographic. 7 February 2017. Retrieved 3 June 2020.
- "El 56% de los argentinos tiene antepasados indígenas". www.clarin.com.
- "Archived copy" (PDF). Archived from the original (PDF) on 2015-11-17. Retrieved 2015-12-02.CS1 maint: archived copy as title (link)
- Levinas, Gabriel (2015-09-01). Doble agente. ISBN 9789500753944.
- "Costa Rica". worldstatesmen.org.
- "LUN.COM Mobile".
- "Puerto Rico: People; Ethnic groups". 2010.census.gov. Archived from the original on 2011-01-02. Retrieved 2011-04-14.
- official 2012 Census Archived June 3, 2014, at the Wayback Machine |
- "Tabela 1.3.1 - População residente, por cor ou raça, segundo o sexo e os Sexo e grupos de idade População residente" (PDF). Ibge.gov.br. Retrieved 8 October 2017.
- "Brancos são menos da metade da população pela primeira vez no Brasil". Cotidiano.
- Salzano, F. M.; Sans, M. (2013). "Interethnic admixture and the evolution of Latin American populations". Genetics and Molecular Biology. 37 (1 Suppl): 151–170. doi:10.1590/S1415-47572014000200003. PMC 3983580. PMID 24764751.
- "Republica Dominicana, Dominican Republic". Dominicanonline.org. Archived from the original on 9 October 2017. Retrieved 8 October 2017.
- "El racismo en la República Dominicana II". El Nuevo Diario. Archived from the original on 21 January 2017. Retrieved 8 October 2017.
- "Archived copy" (PDF). Archived from the original (PDF) on 2015-12-22. Retrieved 2015-12-12.CS1 maint: archived copy as title (link)
- "Cultura y Etnias". Espana.panamaemb.gob.pa. Retrieved 8 October 2017.
- "Perú: Perfil Sociodemográfico" (PDF). Instituto Nacional de Estadística e Informática. p. 214.
- "Bolivia: People; Ethnic groups". CIA World Factbook. Retrieved 2007-11-26.
- CIA World Factbook : Haiti.
- "Embajada de Honduras en México". Embajadahonduras.org.mx. Archived from the original on 2015-12-22.
- "Conozca más de nuestras costumbres y tradiciones". Diario La Tribuna Honduras.
- David A. Branding; Borah, Woodrow (1975). Mineros y comerciantes en el México borbónico (1763-1810). Fondo de Cultura Económica. p. 150. ISBN 9789681613402. Retrieved January 27, 2018.
- "Asociaciones de Inmigrantes Extranjeros en la Ciudad de México. Una Mirada a Fines del Siglo XX" (PDF). Cite journal requires
|journal=(help) - "Los Extranjeros en México, La inmigración y el gobierno ¿Tolerancia o intolerancia religiosa?" (PDF). Archived from the original (PDF) on 2009-03-27.
- "HISTORY TV Schedule". HISTORY.
- "For Migrants, New Land of Opportunity Is Mexico". The New York Times. 22 September 2013.
- Howard F. Cline (1963). THE UNITED STATES AND MEXICO. Harvard University Press. p. 104. ISBN 9780674497061. Retrieved May 18, 2017.
- Sherburne Friend Cook; Borah, Woodrow (1998). Ensayos sobre historia de la población. México y el Caribe 2. Siglo XXI. p. 223. ISBN 9789682301063. Retrieved September 12, 2017.
- "Household Mobility and Persistence in Guadalajara, Mexico: 1811–1842, page 62", fsu org, 8 December 2016. Retrieved on 9 December 2018.
- "The World Factbook: North America: Mexico: People and Society". The World Factbook, Central Intelligence Agency (CIA). Retrieved August 23, 2017.
mestizo (Amerindian-Spanish) 62%, predominantly Amerindian 21%, Amerindian 7%, other 10% (mostly European)
- "Mexico: Ethnic groups". Encyclopædia Britannica. Retrieved August 23, 2017: Ethnic composition (2010): 64.3% mestizo; 15% Mexican white; 10.5% detribalized Amerindian; 7.5% other Amerindian; 1% Arab; 0.5% Mexican black; 1.2% other.
- Navarrete, Federico (2016). Mexico Racista. Penguin Random house Grupo Editorial Mexico. p. 86. ISBN 9786073143646. Retrieved February 23, 2018.
- "Racismo y salud mental en estudiantes universitarios en la Ciudad de México", Scielo, Cuernavaca, April–March 2011. Retrieved on 28 April 2017.
- "Stratification by Skin Color in Contemporary Mexico", Jstor org, available creating a free account , Retrieved on 27 January 2018.
- "Admixture in Latin America: Geographic Structure, Phenotypic Diversity and Self-Perception of Ancestry Based on 7,342 Individuals" table 1, Plosgenetics, 25 September 2014. Retrieved on 9 May 2017.
- "21 de Marzo: Día Internacional de la Eliminación de la Discriminación Racial" [March 21: International Day for the Elimination of Racial Discrimination] (PDF) (in Spanish). Mexico: CONAPRED. 2017. p. 7. Retrieved August 23, 2017.
- " Visión INEGI 2021 Dr. Julio Santaella Castell", INEGI, 03 July 2017, Retrieved on 30 April 2018.
- "Resultados del Modulo de Movilidad Social Intergeneracional" Archived 2018-07-09 at the Wayback Machine, INEGI, 16 June 2017, Retrieved on 30 April 2018.
- "Encuesta Nacional sobre Discriminación 2017", CNDH, 6 August 2018, Retrieved on 10 August 2018.
- "Encuesta Nacional sobre Discriminación 2017. ENADIS. Diseño muestral. 2018", INEGI, 6 August 2018, Retrieved on 10 August 2018.
- "Alteraciones cutáneas del neonato en dos grupos de población de México", Scielo, March/April 2005. Retrieved on 18 May 2017.
- Miller (1999). Nursing Care of Older Adults: Theory and Practice (3, illustrated ed.). Lippincott Williams & Wilkins. p. 90. ISBN 0781720761. Retrieved May 17, 2014.
- "Congenital Dermal Melanocytosis (Mongolian Spot): Background, Pathophysiology, Epidemiology". EMedicine.medscape.com. 7 January 2017. Retrieved 8 October 2017.
- Lawrence C. Parish; Larry E. Millikan, eds. (2012). Global Dermatology: Diagnosis and Management According to Geography, Climate, and Culture. M. Amer, R.A.C. Graham-Brown, S.N. Klaus, J.L. Pace. Springer Science & Business Media. p. 197. ISBN 978-1461226147. Retrieved May 17, 2014.
- "About Mongolian Spot". tokyo-med.ac.jp. Archived from the original on 8 December 2008. Retrieved 1 October 2015.
- "Tienen manchas mongólicas 50% de bebés", El Universal, January 2012. Retrieved on 3 July 2017.
- Ruiz-Linares et al (2014). «Admixture in Latin America: Geographic Structure, Phenotypic Diversity and Self-Perception of Ancestry Based on 7,342 Individuals». University College de Londres
- Ruiz-Linares, Andrés; et al. (25 September 2014). "Admixture in Latin America: Geographic Structure, Phenotypic Diversity and Self-Perception of Ancestry Based on 7,342 Individuals". PLOS Genetics. 10 (9): e1004572. doi:10.1371/journal.pgen.1004572. PMC 4177621. PMID 25254375.
- Martínez-Cortés, G.; Zúñiga-Castellanos, R.; García-Aceves, M.; Salcido, V.; Cortés-Trujillo, I.; Rangel-Villalobos, H. (2017). "Genetic diversity of Mexican-Mestizo populations using 114 INDEL polymorphisms". Forensic Science International: Genetics Supplement Series. 6: e423–e425. doi:10.1016/j.fsigss.2017.09.153.
- Mexican mestizo population sub-structure: effects on genetic and forensic statistical parameters. Molecular biology reports. September 2012.
- Hancock, Dana B.; Romieu, Isabelle; Shi, Min; Sienra-Monge, Juan-Jose; Wu, Hao; Chiu, Grace Y.; Li, Huiling; Rio-Navarro, Blanca Estela del; Willis-Owens, Saffron A. G.; Weiss, Scott T.; Raby, Benjamin A.; Gao, Hong; Eng, Celeste; Chapela, Rocio; Burchard, Esteban G.; Tang, Hua; Sullivan, Patrick F.; London, Stephanie J. (2009). "Genome-Wide Association Study Implicates Chromosome 9q21.31 as a Susceptibility Locus for Asthma in Mexican Children". PLOS Genetics. 5 (8): e1000623. doi:10.1371/journal.pgen.1000623. PMC 2722731. PMID 19714205.
- Kosoy, R.; Nassir, R.; Tian, C.; White, P. A.; Butler, L. M.; Silva, G.; Kittles, R.; Alarcon-Riquelme, M. E.; Gregersen, P. K.; Belmont, J. W.; de la Vega, F. M.; Seldin, M. F. (2009). "Ancestry informative marker sets for determining continental origin and admixture proportions in common populations in America". Human Mutation. 30 (1): 69–78. doi:10.1002/humu.20822. PMC 3073397. PMID 18683858.
- Martinez-Marignac, V. L.; Valladares, A.; Cameron, E.; Chan, A.; Perera, A.; Globus-Goldberg, R.; Wacher, N.; Kumate, J.; McKeigue, P.; O'Donnell, D.; Shriver, M. D.; Cruz, M.; Parra, E. J. (2007). "Admixture in Mexico City: Implications for admixture mapping of type 2 diabetes genetic risk factors". Human Genetics. 120 (6): 807–19. doi:10.1007/s00439-006-0273-3. PMID 17066296.
- Martinez-Fierro, M. L.; Beuten, J.; Leach, R. J.; Parra, E. J.; Cruz-Lopez, M.; Rangel-Villalobos, H.; Riego-Ruiz, L. R.; Ortiz-Lopez, R.; Martinez-Rodriguez, H. G.; Rojas-Martinez, A. (2009). "Ancestry informative markers and admixture proportions in northeastern Mexico". Journal of Human Genetics. 54 (9): 504–9. doi:10.1038/jhg.2009.65. PMID 19680268.
- Fuentes M; et al. (2014). "Gene geography of Chile: regional distribution of American, European and African genetic contributions". Revista Médica de Chile. 142 (3): 281–9. doi:10.4067/S0034-98872014000300001. PMID 25052264.
- Morera B, Barrantes R, Marin-Rojas R (2013-03-25). "Gene admixture in the Costa Rican population". Ann. Hum. Genet. 67 (Pt 1): 71–80. doi:10.1046/j.1469-1809.2003.00010.x. PMID 12556237.
- Wang, S; Ray, N; Rojas, W; et al. (2008-03-21). "Geographic Patterns of Genome Admixture in Latin American Mestizos". PLOS Genetics. 4 (3): e1000037. doi:10.1371/journal.pgen.1000037. PMC 2265669. PMID 18369456.
- Cerda-Flores RM; et al. (2002). "Genetic admixture in three Mexican Mestizo populations based on D1S80 and HLA-DQA1 loci". Am J Hum Biol. 14 (2): 257–63. doi:10.1002/ajhb.10020. PMID 11891937.
- Martínez-Cortés, G; Salazar-Flores, J; Fernández-Rodríguez, LG; Rubi-Castellanos, R; Rodríguez-Loya, C; Velarde-Félix, JS; Muñoz-Valle, JF; Parra-Rojas, I; Rangel-Villalobos, H (2012). "Admixture and population structure in Mexican-Mestizos based on paternal lineages". Journal of Human Genetics. 57 (9): 568–574. doi:10.1038/jhg.2012.67. PMID 22832385.
In the total population sample, paternal ancestry was predominantly European (64.9%), followed by Native American (30.8%) and African (4.2%). However, the European ancestry was prevalent in the north and west (66.7–95%) and, conversely, Native American ancestry increased in the center and southeast (37–50%), whereas the African ancestry was low and relatively homogeneous (0–8.8%)
- Cerda-Flores RM; et al. (June 1991). "Genetic structure of the populations migrating from San Luis Potosi and Zacatecas to Nuevo León in Mexico". Human Biology. 63 (3): 309–27. PMID 2055589.
- "Composición Étnica de las Tres Áreas Culturales del Continente Americano al Comienzo del Siglo XXI" (PDF). Academic investigation (in Spanish). university of the State of Mexico. 2005. p. 196. Archived from the original (PDF) on 2013-10-22. Retrieved 2014-06-10.
- "en el censo de 1930 el gobierno mexicano dejó de clasificar a la población del país en tres categorías raciales, blanco, mestizo e indígena, y adoptó una nueva clasificación étnica que distinguía a los hablantes de lenguas indígenas del resto de la población, es decir de los hablantes de español". Archived from the original on August 23, 2013.
- "The Map of the Mexican's Genome": overlapping national identity, and population genomics", Springer, Retrieved on 01 April 2018.
- Buentello-Malo, L; Peñaloza-Espinosa, RI; Salamanca-Gómez, F; Cerda-Flores, RM (2008). "Genetic admixture of eight Mexican indigenous populations: based on five polymarker, HLA-DQA1, ABO, and RH loci". Am J Hum Biol. 20 (6): 647–50. doi:10.1002/ajhb.20747. PMID 18770527.
- Sosa-Macías, Martha (2006). "CYP2D6Genotype and Phenotype in Amerindians of Tepehuano Origin and Mestizos of Durango, Mexico". The Journal of Clinical Pharmacology. 46 (5): 527–536. doi:10.1177/0091270006287586. PMID 16638736.
- "Renin gene haplotype diversity and linkage disequilibrium in two Mexican and one German population samples", Sagepub, Retrieved on 21 February 2018.
- Martínez-Cortés, G; Salazar-Flores, J; Fernández-Rodríguez, LG; Rubi-Castellanos, R; Rodríguez-Loya, C; Velarde-Félix, JS; Muñoz-Valle, JF; Parra-Rojas, I; Rangel-Villalobos, H (2012). "Admixture and population structure in Mexican-Mestizos based on paternal lineages". J. Hum. Genet. 57 (9): 568–74. doi:10.1038/jhg.2012.67. PMID 22832385.
- J.K. Estrada, A. Hidalgo-Miranda, I. Silva-Zolezzi and G. Jimenez-Sanchez. "Evaluation of Ancestry and Linkage Disequilibrium Sharing in Admixed Population in Mexico". ASHG. Retrieved July 18, 2012.CS1 maint: multiple names: authors list (link)
- "Genoma destapa diferencias de mexicanos". CNN Expansión. 2009-06-06. Retrieved 2013-09-09.
- Lisker, Rubén (2005-05-27). "Racial admixture in a Mestizo population from Mexico City". American Journal of Human Biology. 7 (2): 213–216. doi:10.1002/ajhb.1310070210. PMID 28557218.
- "Admixture in Mexico City: implications for admixture mapping of Type 2 diabetes genetic risk factors" (PDF). Utm.utoronto.ca. 2006-10-02. Archived from the original (PDF) on 2013-10-22. Retrieved 2013-09-09.
- Loya Méndez, Y; Reyes Leal, G; Sánchez González, A; Portillo Reyes, V; Reyes Ruvalcaba, D; Bojórquez Rangel, G (2014). "[SNP-19 genotypic variants of CAPN10 gene and its relation to diabetes mellitus type 2 in a population of Ciudad Juarez, Mexico]". Nutr Hosp. 31 (2): 744–50. doi:10.3305/nh.2015.31.2.7729. PMID 25617558.
- "2012 Cuban Census". One.cu. 2006-04-28. Retrieved 2014-04-23.
- Copesa, Grupo (8 November 2013). "Censo en Cuba concluye que la población decrece, envejece y se vuelve cada vez más mestiza". latercera.com.
- "Etat des propriétés rurales appartenant à des Français dans l'île de Cuba". (from Cuban Genealogy Center)
- "In Cuba, Finding a Tiny Corner of Jewish Life". The New York Times. 2007-02-04. Retrieved 2008-11-19.
- Marcheco-Teruel, B; Parra, EJ; Fuentes-Smith, E; Salas, A; Buttenschøn, HN; et al. (2014). "Cuba: Exploring the History of Admixture and the Genetic Basis of Pigmentation Using Autosomal and Uniparental Markers". PLOS Genetics. 10 (7): e1004488. doi:10.1371/journal.pgen.1004488. PMC 4109857. PMID 25058410.
- Beatriz Marcheco-Teruel et al.2011, Interactions between genetic admixture, ethnic identity, APOE genotype and dementia prevalence in an admixed Cuban sample; a cross-sectional population survey and nested case-control study
- Cintado, A.; Companioni, O.; Nazabal, M.; Camacho, H.; Ferrer, A.; De Cossio, M. E.; Marrero, A.; Ale, M.; Villarreal, A.; Leal, L.; Casalvilla, R.; Benitez, J.; Novoa, L.; Diaz-Horta, O.; Dueñas, M. (2009). "Admixture estimates for the population of Havana City". Annals of Human Biology. 36 (3): 350–60. doi:10.1080/03014460902817984. PMID 19381988.
- A Population History of North America By Michael R. Haines, Richard H. Steckel
- Dominican Republic, Summary of Biostatistics: Maps and Charts, Population ... By United States. Bureau of the Census
- Stanley J. Engerman, Barry W. Higman, "The demographic structures of the Caribbean Slaves Societies in the Eighteenth and Nineteenth Centuries", General History of the Caribbean: The Slave Societies of the Caribbean, vol. III, London, 1997, pp. 48–49.
PUERTO RICO: 17,572 whites; 5,037 slaves; 22,274 freed coloured people; total- 44,883. CUBA: 116,947 whites; 28,760 slaves; 24,293 freed coloured people; total- 170,000. SANTO DOMINGO: 30,863 whites; 8,900 slaves; 30,862 freed coloured people; total- 70,625. TOTAL SPANISH COLONIES: 165,382 whites; 42,967 slaves; 77,429 freed coloured people; total- 285,508.
- Dominican Republic Foreign Policy and Government Guide Volume 1 Strategic By IBP, Inc.
- Helen Chapin Metz, ed. (December 1999). "The first colony". Dominican Republic : country studies. Washington, DC: Federal Research Division, Library of Congress. ISBN 0844410446. Retrieved 3 August 2013. Lay summary.
As a result of the stimulus provided by the trade reforms, the population of the colony of Santo Domingo increased from about 6,000 in 1737 to approximately 125,000 in 1790. Of this number, about 40,000 were white landowners, about 25,000 were black or mulatto freedmen, and some 60,000 were slaves. The composition of Santo Domingo's population contrasted sharply with that of the neighboring French colony of Saint-Domingue, where some 30,000 whites and 27,000 freedmen extracted labor from at least 500,000 black slaves. To the Spanish colonists, Saint- Domingue represented a powder keg, the eventual explosion of which would echo throughout the island.
- Franco Pichardo, Franklin J. (2009). Historia del Pueblo Dominicano (in Spanish). Santo Domingo: Ediciones Taller. p. 217. Retrieved 23 May 2013.
- Frank Moya Pons (1999). Breve Historia Contemporánea de la República Dominicana (in Spanish). Fondo De Cultura Economica USA. p. 62.
Según los datos del primer censo nacional, la población dominicana estaba compuesta por un 24.9% de blancos, (...) en 1920 había 223 144 blancos (...)
- Dominican Republic, Summary of Biostatistics: Maps and Charts, Population ...(Page 41).
- Historia de la República Dominicana, Volume 2 By Frank Moya Pons
- Cuarto censo nacional de población, 1960. Oficina Nacional del Censo. 1966. p. 32.
- Power and Television in Latin America: The Dominican Case By Antonio V. Menéndez Alarcó
- La variable étnico racial en los censos de población en la República Dominicana. Encuesta Latin American Public Opinion Project 2006.
- "Origen de la población dominicana".
- "Revista Electrónica de Geografía y Ciencias Sociales". Universidad de Barcelona.
- "Sitios patrimonio de la humanidad: San Pedro de Macorís, República Dominicana". Archived from the original on 2009-01-14.
- Sagás, Ernesto. "A Case of Mistaken Identity: Antihaitianismo in Dominican Culture". Archived from the original on 2007-10-08. Retrieved 2007-12-08.
- Levy, Lauren. "The Dominican Republic's Haven for Jewish Refugees". Jerusalem Post. Retrieved 2007-12-08.
- "...no hicieron Las Américas". El País. Archived from the original on 2007-12-12. Retrieved 2007-12-08.
- "Archived copy". Archived from the original on 2006-10-20. Retrieved 2011-09-28.CS1 maint: archived copy as title (link)
- "The Polish Influence in Casale, Haiti and Contribution to the Haitian Revolution". Archived from the original on 25 February 2014. Retrieved 7 February 2014.
- "Polish Haitians: How They Came to Be". 2011-02-17. Retrieved 6 February 2014.
- "Haiti". Jewish Virtual Library. Retrieved 2014-02-07.
- "Haiti And The German Connection". Retrieved 30 January 2014.
- "Haiti Net Foreign Relations". Retrieved 30 January 2014.
- Martinique: People: Ethnic Groups. World Factbook of CIA (2003)
- El crecimiento poblacional en Puerto Rico: 1493 al presente Archived 2015-10-03 at the Wayback Machine (Population of Puerto Rico 1493 - present) Page 11.
- "Wayback Machine" (PDF). Sp.rcm.upr.edu. 4 October 2015. Archived from the original on 4 October 2015. Retrieved 8 October 2017.CS1 maint: BOT: original-url status unknown (link)
- HISTORIA DE PUERTO RICO Page 17.
- Report on the census of Porto Rico, 1899 Census of "Porto Rico" (Old Spelling) Page 57.
- El crecimiento poblacional en Puerto Rico: 1493 al presente Archived 2015-10-03 at the Wayback Machine (Population of Puerto Rico 1493 - present)
- "Puerto Rico Census of 1910, 1920 & 1930" (PDF). 2.census.gov. p. 136. Retrieved 8 October 2017.
- The population of the United States and Puerto Rico See (page 53-26).
- Summary Population, Housing Characteristics. Puerto Rico: 2000 Census. (Page 52).
- Puerto Rico: 2010 - Summary Population and Housing Characteristics 2010 Census of Population and Housing.
- 2010.census.gov Archived January 2, 2011, at the Wayback Machine
- How Puerto Rico Became White—University of Wisconsin-Madison Archived 2012-02-07 at the Wayback Machine. (PDF).
- "Department of Literatures in English | Department of Literatures in English | The University of the West Indies at Mona, Jamaica". www.mona.uwi.edu. Archived from the original on
|archive-url=requires|archive-date=(help). - Godinho, Neide Maria de Oliveira (2008). "O impacto das migrações na constituição genética de populações latino-americanas" (PDF). Universidade de Brasília. Retrieved 29 October 2012.
- "Fact Sheet on St. Barthélemy -- 1995". cieux.com.
- "The World Factbook". cia.gov.
- Herrera Balharry, Eugenio (1988). Los alemanes y el estado cafetalero. Costa Rica. pp. 100–130. ISBN 9977-64-405-5.
- "The Jewish Community in Costa Rica". jcpa.org.
- "Culture of Costa Rica - history, people, women, beliefs, food, customs, family, social, marriage". everyculture.com.
- "Archived copy" (PDF). Archived from the original (PDF) on 2015-09-23. Retrieved 2015-12-20.CS1 maint: archived copy as title (link)
- "XI Censo nacional de población y VI de habitación (Guatemala) - Fadep News". fadep.org.
- Recolection of ethic groups and census of latin americans Stanford University Library. Consulted, 23-05-2015.
- "Guatemala: 2002 Census includes disability". disabilityworld.org. Archived from the original on 2016-03-04.
- La cara Europea de Guatemala Tuesday, March 9, 2010.
- Europa Press (12 December 2006). "Enrique Bolaños expone sus recelos sobre la futura gestión de Daniel Ortega y agradece a España su apoyo". europapress.es.
- Francisco Mauro Salzano; Sans, Mónica (2014). "Interethnic admixture and the evolution of Latin American populations" (PDF). Genetics and Molecular Biology. Brazil: Sociedade Brasileira de Genética. 37 (1 (suppl)): 151–170. doi:10.1590/s1415-47572014000200003. ISSN 1415-4757. PMC 3983580. PMID 24764751.
- Nuñez, Carolina; Baeta, Miriam (2010). "Reconstructing the population history of Nicaragua by means of mtDNA, Y-chromosome STRs, and autosomal STR markers". Physical Antropology. United States of America: American Association of Physical Antropology. 143 (4): 591–600. doi:10.1002/ajpa.21355. ISSN 1415-4757. PMID 20721944.
- "Central America: Nicaragua". CIA: The World Factbook. Retrieved 10 September 2019.
- "Urban population (% of total)". World Bank. Retrieved 26 June 2015.
- Fraiman, Michael (13 October 2017). "This Man Went Missing in Nicaragua. Have You Seen Him?". Outpost Magazine. Retrieved 18 July 2019.
- "Panama; People; Ethnic groups". CIA World Factbook. Retrieved 2007-11-21.
- Corach D; Lao O; Bobillo C; et al. (2009-12-15). "Inferring Continental Ancestry of Argentineans from Autosomal, Y-Chromosomal and Mitochondrial DNA". Annals of Human Genetics. 74 (1): 65–76. doi:10.1111/j.1469-1809.2009.00556.x. PMID 20059473.
- Avena, S; Via, M; Ziv, E; Pérez-Stable, EJ; Gignoux, CR; et al. (2012). "Heterogeneity in Genetic Admixture across Different Regions of Argentina". PLOS One. 7 (4): e34695. Bibcode:2012PLoSO...734695A. doi:10.1371/journal.pone.0034695. PMC 3323559. PMID 22506044.
- Ethnic Groups Worldwide: A Ready Reference Handbook by David Levinson. Page 313. Greenwood Publishing Group, 1998. ISBN 1-57356-019-7
- World Fact File. Dorling Kindersley Books Limited, London. This source gives the following percentages: Indo-European 83%, Mestizos 14%, Jewish 2%, Amerindians 1%.
- "Argentina". worldstatesmen.org.
- "Indigenous or Criollo: The Myth of White Argentina in Tucumán's Calchaquí Valley", escrito por Oscar Chamosa. Paginas 77-79. Hispanic American Historical Review. Duke University Press. 2008
- Los hombres barbados en la América precolombina: razas indígenas americanas. Dick Edgar Ibarra Grasso. p. 10. Editorial Kier. Buenos Aires, 1997.
- "Bolivianos en la Argentina: cómo viven este momento histórico de su país". www.clarin.com.
- Luis Vita: Introducción a una teoría de la historia para América Latina. Chapter IV. Editorial Planeta. Buenos Aires, 1992.
- Fuente: Argentina: de la Conquista a la Independencia. por C. S. Assadourian – C. Beato – J. C. Chiaramonte. Ed. Hyspamérica. Buenos Aires, 1986. Citado en Revisionistas. La Otra Historia de los Argentinos.
- "90.01.06: South American Immigration: Argentina". yale.edu.
- "Feditalia - Confederación General de Federaciones Italianas en Argentina". feditalia.org.ar.
- Construyendo Puentes Archived 2011-09-30 at the Wayback Machine
- Municipalidad de Crespo. Consultado 13-01-2010
- History of Argentina, de Ricardo.Levene. University of North Carolina Press, 1937.
- Argentina: 1516-1982 From Spanish Colonisation to the Falklands War escrito por David Rock. University of California Press, 1987. ISBN 0-520-05189-0
- Migration and Nationality Patterns in Argentina. Archived 2012-02-18 at the Wayback Machine Fuente: Dirección Nacional de Migraciones, 1976.
- Inmigración, Cambio Demográfico y Desarrollo Industrial en la Argentina. Alfredo Lattes y Ruth Sautu. Cuaderno Nº 5 del CENEP (1978). Citado en Argentina: 1516-1982 From Spanish Colonisation to the Falklands War by David Rock. University of California Press, 1987. ISBN 0-520-05189-0
- "Bolivia". worldstatesmen.org.
- "Peru". worldstatesmen.org.
- "Paraguay". worldstatesmen.org.
- Recent Migration from Central and Eastern Europe to Argentina, a Special Treatment? (in Spanish) by María José Marcogliese. Revista Argentina de Sociología, 2003
- "Ukrainians, Russians and Armenians, from professionals to security guardians" (in Spanish) by Florencia Tateossian. Le Monde Diplomatique, June 2001.
- Homburger; et al. (2015). "Genomic Insights into the Ancestry and Demographic History of South America". PLOS Genetics. 11 (12): e1005602. doi:10.1371/journal.pgen.1005602. PMC 4670080. PMID 26636962.
- Avena; et al. (2012). "Heterogeneity in Genetic Admixture across Different Regions of Argentina". PLOS One. 7 (4): e34695. Bibcode:2012PLoSO...734695A. doi:10.1371/journal.pone.0034695. PMC 3323559. PMID 22506044.
- "O impacto das migrações na constituição genética de populações latino-americanas" (PDF). Repositorio.unb.br. Archived (PDF) from the original on 1 October 2018. Retrieved 15 January 2018.
- "Reference Populations – Geno 2.0 Next Generation". Genographic.nationalgeographic.com. Archived from the original on 24 November 2017. Retrieved 15 January 2018.
- "BBC News - MUSIC - Girl from Ipanema fights for title". bbc.co.uk. 2001-07-14.
- Bellos, Alex (2006-06-17). "World Cup 2006: Privileged Kaka could be Brazil's best". The Guardian. London. Retrieved 2008-11-29.
- Solomon, Brian (14 June 2012). "The World's Highest Paid Models". Forbes. Retrieved 6 December 2014.
- "The World's Highest-Paid Models Of 2014: Gisele, Doutzen And Adriana Steal The Show". Forbes. 18 August 2014. Retrieved 28 August 2014.
- "Brazil - the Country and its People" (PDF). www.brazil.org.uk. Archived from the original (PDF) on October 21, 2014. Retrieved December 3, 2014.
- "The World Factbook". cia.gov.
- "Brazil". worldstatesmen.org.
- PNAD 2006 Archived 2012-02-22 at the Wayback Machine
- "Sistema IBGE de Recuperação Automática - SIDRA". ibge.gov.br. Archived from the original on 2011-06-14.
- Duarte, Alessandra (29 April 2011). "Censo 2010: população do Brasil deixa de ser predominantemente branca". O Globo (in Portuguese). Rio de Janeiro. Infoglobo Comunicação e Participações S.A. Archived from the original on 24 January 2014. Retrieved 24 January 2014.
(...) A população branca foi, assim, a única que diminuiu. Paula Miranda-Ribeiro, professora de demografia do Centro de Desenvolvimento e Planejamento Regional da UFMG, sublinha essa mudança cultural.
— «O Brasil está mais preto, algo mais próximo da realidade» — diz Paula, para quem a principal razão é a maior identificação de pretos e pardos com sua cor. — «É a chamada desejabilidade social. Historicamente, pretos e pardos eram desvalorizados socialmente, o que fazia com que pretos desejassem ser pardos, e pardos, brancos. Agora, pretos e pardos quiseram se identificar assim. Isso pode ter a ver, ainda, com a afirmação dessa população como forte consumidor atualmente, que se refletiu em afirmação de identidade.» (...) - Blacks in Brazil: the myth and the reality. by Charles Whitaker. Ebony Magazine, 1991.
- "Sistema IBGE de Recuperação Automática - SIDRA". ibge.gov.br.
- "IBGE | Portal do IBGE | IBGE". www.ibge.gov.br. Archived from the original on April 19, 2009.
- "IBGE | Portal do IBGE | IBGE". www.ibge.gov.br. Archived from the original on November 20, 2007.
- Carvalho-Silva DR, Santos FR, Rocha J, Pena SD (January 2001). "The Phylogeography of Brazilian Y-Chromosome Lineages". Am. J. Hum. Genet. 68 (1): 281–6. doi:10.1086/316931. PMC 1234928. PMID 11090340.
- "Entrada de estrangeiros no Brasil". Scielo.br. Retrieved 8 October 2017.
- "Fim da escravidão gera medidas de apoio à imigração no Brasil - 16/02/2005 - Resumos - História do Brasil". uol.com.br.
- "Café atrai imigrante europeu para o Brasil - 22/02/2005 - Resumos - História do Brasil". uol.com.br.
- Levy, Maria Stella Ferreira (1974). "O papel da migração internacional na evolução da população brasileira (1872 a 1972)". Revista de Saúde Pública. 8: 49–90. doi:10.1590/S0034-89101974000500003.
- "IBGE | Portal do IBGE | IBGE". www.ibge.gov.br. Archived from the original on July 5, 2009.
- Seyferth, Giralda (1997). "A assimilação dos imigrantes como questão nacional". Mana. 3: 95–131. doi:10.1590/S0104-93131997000100004.
- "Memórias da Emigração Portuguesa". sapo.pt. Archived from the original on 2012-05-16.
- Flight from Angola, The Economist, August 16, 1975
- Moura, RR; Coelho, AV; Balbino Vde, Q; Crovella, S; Brandão, LA (2015). "Meta-analysis of Brazilian genetic admixture and comparison with other Latin America countries". American Journal of Human Biology. 27 (5): 674–680. doi:10.1002/ajhb.22714. PMID 25820814.
- Saloum De Neves Manta, Fernanda; Pereira, Rui; Vianna, Romulo; Rodolfo Beuttenmüller De Araújo, Alfredo; Leite Góes Gitaí, Daniel; Aparecida Da Silva, Dayse; De Vargas Wolfgramm, Eldamária; Da Mota Pontes, Isabel; Ivan Aguiar, José; Ozório Moraes, Milton; Fagundes De Carvalho, Elizeu; Gusmão, Leonor (2013). "Revisiting the Genetic Ancestry of Brazilians Using Autosomal AIM-Indels". PLOS One. 8 (9): e75145. Bibcode:2013PLoSO...875145S. doi:10.1371/journal.pone.0075145. PMC 3779230. PMID 24073242.
- Pena, SD; Di Pietro, G; Fuchshuber-Moraes, M; et al. (2011). "The Genomic Ancestry of Individuals from Different Geographical Regions of Brazil Is More Uniform Than Expected". PLOS One. 6 (2): e17063. Bibcode:2011PLoSO...617063P. doi:10.1371/journal.pone.0017063. PMC 3040205. PMID 21359226.
- "Nossa herança europeia —" (in Portuguese). Cienciahoje.uol.com.br. Archived from the original on 2012-01-30. Retrieved 2012-05-23.
- "Profile of the Brazilian blood donor". Amigodoador.com.br. Archived from the original on 2012-05-02. Retrieved 2012-05-23.
- "DNA de brasileiro é 80% europeu, indica estudo". uol.com.br.
- Lins TC, Vieira RG, Abreu BS, Grattapaglia D, Pereira RW (2010). "Genetic composition of Brazilian population samples based on a set of twenty-eight ancestry informative SNPs". Am. J. Hum. Biol. 22 (2): 187–92. doi:10.1002/ajhb.20976. PMID 19639555.
- Lins TC, Vieira RG, Abreu BS, Grattapaglia D, Pereira RW (2010). "Genetic composition of Brazilian population samples based on a set of twenty-eight ancestry informative SNPs". Am. J. Hum. Biol. 22: 187–92. doi:10.1002/ajhb.20976. PMID 19639555.
- "Archived copy" (PDF). Archived from the original (PDF) on 2011-04-08. Retrieved 2011-04-08.CS1 maint: archived copy as title (link)
- Forensic Science International: Genetics. Allele frequencies of 15 STRs in a representative sample of the Brazilian population (inglés) Archived 2011-04-08 at WebCite basandos en estudios del IBGE de 2008. Se presentaron muestras de 12.886 individuos de distintas etnias, por regiones, provenían en un 8,26% del Norte, 23,86% del Nordeste, 4,79% del Centro-Oeste, 10,32% del Sudeste y 52,77% del Sur.
- Brandão Ferreira, Luzitano (2006). "Genomic ancestry of a sample population from the state of São Paulo, Brazil". American Journal of Human Biology. 18 (5): 702–705. doi:10.1002/ajhb.20474. PMID 16917899.
- Saloum; de Neves Manta, F; Pereira, R; Vianna, R; Rodolfo; et al. (2013). "Revisiting the Genetic Ancestry of Brazilians Using Autosomal AIM-Indels". PLOS One. 8 (9): e75145. Bibcode:2013PLoSO...875145S. doi:10.1371/journal.pone.0075145. PMC 3779230. PMID 24073242.
- Pena, S.D.J.; Bastos-Rodrigues, L.; Pimenta, J.R.; Bydlowski, S.P. (2009). "DNA tests probe the genomic ancestry of Brazilians". Brazilian Journal of Medical and Biological Research. 42 (10): 870–876. doi:10.1590/S0100-879X2009005000026. PMID 19738982.
- Valenzuela C. (1984). Marco de Referencia Sociogenético para los Estudios de Salud Pública en Chile. Revista Chilena de Pediatría; 55: 123-7.
- Vanegas l, Jairo; Villalón c, Marcelo; Valenzuela y, Carlos (2008). "Consideraciones acerca del uso de la variable etnia/Raza en investigación epidemiológica para la Salud Pública: A propósito de investigaciones en inequidades". Revista Médica de Chile. 136 (5). doi:10.4067/S0034-98872008000500014.
- Cruz-Coke, Ricardo & Moreno, Rodrigo (September 1994). "Genetic epidemiology of single gene defects in Chile". J. Med. Genet. (in Spanish). 31 (9): 702–6. doi:10.1136/jmg.31.9.702. PMC 1050080. PMID 7815439.
- Homburguer; et al. (2015). "Genomic Insights into the Ancestry and Demographic History of South America". PLOS Genetics. 11 (12): e1005602. doi:10.1371/journal.pgen.1005602. PMC 4670080. PMID 26636962.
- Eyheramendy, Susana; Martinez, Felipe I.; Manevy, Federico; Vial, Cecilia; Repetto, Gabriela M. (2015). "Genetic structure characterization of Chileans reflects historical immigration patterns". Nature Communications. 6: 6472. Bibcode:2015NatCo...6.6472E. doi:10.1038/ncomms7472. PMC 4382693. PMID 25778948.
- "Archived copy" (PDF). Archived from the original (PDF) on 2015-09-24. Retrieved 2015-10-15.CS1 maint: archived copy as title (link)
- "Chile". Encyclopædia Britannica. Retrieved 2012-09-15.
"Chile's ethnic makeup is largely a product of Spanish colonization. About three fourths of Chileans are mestizo, a mixture of European and Amerindian ancestries. One-fifth of Chileans are of white European (mainly Spanish) descent.
- El Gradiente Sociogenético Chileno y sus Implicaciones Etico-Sociales (2014)
- "LUN.COM Mobile". lun.com.
- Ruiz-Linares, Andrés; Adhikari, Kaustubh; Acuña-Alonzo, Victor; Quinto-Sanchez, Mirsha; Jaramillo, Claudia; Arias, William; Fuentes, Macarena; Pizarro, María; Everardo, Paola (2014-09-25). "Admixture in Latin America: Geographic Structure, Phenotypic Diversity and Self-Perception of Ancestry Based on 7,342 Individuals". PLOS Genetics. 10 (9): e1004572. doi:10.1371/journal.pgen.1004572. PMC 4177621. PMID 25254375.
- Valenzuela, Carlos Y.; Alvarado, Orlando; von Beck, Petra; Zemelman, Viviana (2002). "Sexual dimorphism in skin, eye and hair color and the presence of freckles in Chilean teenagers from two socioeconomic strata". Viviana Zemelman, Petra von Beck, Orlando Alvarado and Carlos y Valenzuela (in Spanish). 130 (8): 879–884. doi:10.4067/S0034-98872002000800006. PMID 12360796.
- "Chile". Encyclopædia Britannica. Retrieved 2012-09-15.
"...Basque families who migrated to Chile in the 18th century vitalized the economy and joined the old Castilian aristocracy to become the political elite that still dominates the country.
- De los Vascos, Oñati y los Elorza Archived 2013-08-19 at the Wayback Machine DE LOS VASCOS, OÑATI Y LOS ELORZA Waldo Ayarza Elorza. Page 68
- Vasco, Diario (2006-07-24). "Diariovasco.com - EDICIÓN IMPRESA - "Los jóvenes vasco-chilenos están al día de todo lo que está pasando en Euskadi"". diariovasco.com.
- "entrevista al Presidente de la Cámara vasca". Archived from the original on May 11, 2009.
- vascos Ainara Madariaga: Autora del estudio "Imaginarios vascos desde Chile La construcción de imaginarios vascos en Chile durante el siglo XX".
- "De los vascos en Chile y sus instituciones". euskonews.com.
- Contacto Interlingüístico e intercultural en el mundo hispano.instituto valenciano de lenguas y culturas. Universitat de València Cita: " Un 20% de la población chilena tiene su origen en el País Vasco".
- (in Spanish) La población chilena con ascendencia vasca bordea entre el 15% y el 20% del total, por lo que es uno de los países con mayor presencia de emigrantes venidos de Euskadi. Archived February 2, 2010, at the Wayback Machine
- De los Vascos, Oñati y los Elorza Archived 2013-08-19 at the Wayback Machine DE LOS VASCOS, OÑATI Y LOS ELORZA Waldo Ayarza Elorza.
- "Jon Erdozia, nuevo Delegado en Chile: 'Iniciativas vasco chilenas como Emprebask son exportables a otros países'". Euskal kultura.
- De los Vascos, Oñati y los Elorza Archived 2013-08-19 at the Wayback Machine DE LOS VASCOS, OÑATI Y LOS ELORZA Waldo Ayarza Elorza. Page 59, 65, 66
- Salazar Vergara, Gabriel; Pinto, Julio (1999). "La Presencia Inmigrante". Historia Contemporánea de Chile. Santiago de Chile: LOM Ediciones. pp. 76–81. ISBN 956-282-174-9. Retrieved September 16, 2012.
- "Archived copy" (PDF). Archived from the original (PDF) on 2016-03-04. Retrieved 2013-02-13.CS1 maint: archived copy as title (link)
- "Archived copy" (PDF). Archived from the original (PDF) on 2016-03-04. Retrieved 2012-12-05.CS1 maint: archived copy as title (link)
- "Archived copy" (PDF). Archived from the original (PDF) on 2016-03-03. Retrieved 2017-02-04.CS1 maint: archived copy as title (link)
- http://www.blog-v.com, BLOGG /. "Arabes en Chile". www.blog-v.com.
- "Aurora | Aurora". www.aurora-israel.co.il. Archived from the original on March 18, 2012.
- "Chile: Palestinian refugees arrive to warm welcome - Adnkronos Culture And Media". adnkronos.com.
- (in Spanish) 500,000 descendientes de primera y segunda generación de palestinos en Chile. Archived May 13, 2011, at the Wayback Machine
- "Santiago de Chile es un modelo de convivencia palestino-judía".
- "Exiling Palestinians to Chile". Archived from the original on May 16, 2008.
- "Comunidad palestina en Chile acusa "campaña de terror" tras nuevas pintadas | soitu.es". www.soitu.es.
- "5% de los chilenos tiene origen frances". Archived from the original on April 12, 2008.
- "Historia de Chile, Británicos y Anglosajones en Chile durante el siglo XIX". Retrieved 2009-04-26.
- (in Spanish) Diaspora Croata..
- "Naslovna". HRVATSKA MATICA ISELJENIKA. Archived from the original on September 17, 2011.
- "Hrvatski Dom - Inmigrantes Croatas". hrvatski.cl. Archived from the original on 2016-03-03.
- Durán, Hipólito (1997). "El crecimiento de la población latinoamericana y en especial de Chile • Academia Chilena de Medicina". Superpoblación. Madrid: Real Academia Nacional de Medicina. p. 217. ISBN 84-923901-0-7. Retrieved September 16, 2012.
- Pérez Rosales, Vicente (1975) [1860]. Recuerdos del Pasado. Santiago de Chile: Editorial Andrés Bello. Retrieved September 16, 2012.
- "Reisen Sie nach Chile? Reiseziele zu den wichtigsten touristischen Sehenswürdigkeiten" [Are you travelling to Chile? Major tourist destinations and attractions]. German Embassy in Chile (in German). 2008. Archived from the original on 5 August 2009.
- "Archived copy" (PDF). Archived from the original (PDF) on 2012-11-02. Retrieved 2012-11-11.CS1 maint: archived copy as title (link)
- "Italiani nel Mondo: diaspora italiana in cifre" (PDF) (in Italian). Migranti Torino. 30 April 2004. Archived from the original (PDF) on 10 February 2012. Retrieved 24 September 2012.
- "Embajada de Grecia en Chile". Archived from the original on October 16, 2015.
- (in Spanish) Griegos de Chile Archived 2015-10-16 at the Wayback Machine.
- "Domain im Kundenauftrag registriert". schweizergruppe.sv.tc. Archived from the original on September 25, 2009.
- Bushnell, David; Hudson, Rex A. (2010). "The Society and Its Environment" (PDF). In Rex A. Hudson (ed.). Colombia: a country study. Washington, D.C: Federal Research Division, Library of Congress. pp. 87, 92. ISBN 978-0-8444-9502-6. Archived from the original (PDF) on 15 February 2013.
- "Juanes is a Colombian musician who has Basque descent" (in Spanish). centroestudiovascoantioquia. Retrieved 28 May 2013.
- Amerikanuak: Basques in the New World by William A. Douglass, Jon Bilbao, P.167
- Possible paradises: Basque emigration to Latin America by José Manuel Azcona Pastor, P.203
- (in Spanish) webislam.com: La comunidad musulmana de Maicao (Colombia) webislam.com
- (in Spanish) Luis Angel Arango Library: Los sirio-libaneses en Colombia Archived 2006-10-25 at the Wayback Machine lablaa.org
- Latin America during World War II by Thomas M. Leonard, John F. Bratzel, P.117
- "SCADTA Joins the Fight". stampnotes.com.
- "Auswärtiges Amt - Colombia". Auswärtiges Amt.
- "Población del país es joven y mestiza, dice censo del INEC". El Universo. 2011-09-02.
- Levinson, David. 1998. Ethnic groups worldwide: a ready reference handbook. Greenwood Publishing Group. p. 346. "Blanco or White is more a social-class designation than an ethnic one, as identification as a Blanco is based on a combination of white skin color, European features, speaking Spanish, residence in the western part of the nation (especially in a city), and enough wealth or education to be classified as middle or upper class. However, in some rural regions, Mestizos refer to themselves as Blancos, to distinguish themselves from Native Americans and Quechua speakers. Blancos form the ruling elite in Ecuador, and categorization as a Blanco is considered desirable by people of full or partial European descent.
- "Jews in Ecuador". Jewish Virtual Library.
- French Guiana: People: Ethnic Groups. World Factbook of CIA
- "Paraguayan Census form" (PDF). Dgeec.gov.py. Archived from the original (PDF) on 9 November 2005. Retrieved 8 October 2017.
- "II CENSO NACIONAL INDÍGENA DE POBLACIÓN Y VIVIENDAS 2002. Pueblos Indígenas del Paraguay. Resultados Finales" (PDF). Dgeec.gov.py. Retrieved 8 October 2017.
- "Paraguay: People; Ethnic groups". CIA World Factbook. Retrieved 2007-11-26.
- "Paraguay". The World Factbook. Central Intelligence Agency.
- Benítez Martínez, María Victoria. "Inmigrantes Europeos en Paraguay 1818 1930" (PDF). XIV Encuentro de Latinoamericanistas Españoles (in Spanish). Paris, France: Université de Paris. Retrieved 24 January 2014.
- "Establecerán nueva colonia de alemanes en Paraguay". Abc.com (in Spanish). 26 August 2005. Retrieved 24 January 2014.
- Bonilla, Carolina (2004). "Substantial native American female contribution to the population of Tacuarembó, Uruguay, reveals past episodes of sex-biased gene flow". American Journal of Human Biology. 16 (3): 289–297. doi:10.1002/ajhb.20025. PMID 15101054. Archived from the original on 2012-12-11.
- "EL NACIMIENTO DEL URUGUAY MODERNO EN LA SEGUNDA MITAD DEL SIGLO XIX". www.rau.edu.uy.
- "Encuesta Contínua de Hogares 1996-1997" Archived 2011-10-19 at the Wayback Machine. Instituto Nacional de Estadística de Uruguay (in Spanish)
- "Perfil Demográfico y Socioeconómico de la Población Uruguaya según su Ascendencia Racial" Archived 2012-06-01 at the Wayback Machine por Marisa Bucheli y Wanda Cabela. Fuente: Encuesta Nacional de Hogares Ampliada 2006. INE (in Spanish)
- "Uruguay". worldstatesmen.org.
- "Uruguay: People: Ethnic Groups". Cia.gov. Retrieved 8 October 2017.
- "Higher Education - Pearson". Prenhall.com. Retrieved 8 October 2017.
- "Login". Antipro.com.uy. Retrieved 8 October 2017.
- Godinho, Neide Maria de Oliveira (2008). "O impacto das migrações na constituição genética de populações latino-americanas". Universidade de Brasília. Archived from the original on 29 January 2016. Retrieved 1 August 2012.
- Quinonez, Ernesto (2003-06-19). "Y Tu Black Mama Tambien". Retrieved 2008-05-02.
- "Washington Post: Breaking News, World, US, DC News & Analysis". Washington Post.
- "LatinoLA - Forum :: Blonde, Blue-Eyed, Euro-Cute Latinos on Spanish TV". LatinoLA.
- "What are Telenovelas?". bellaonline.com.
- "Racial Bias Charged On Spanish-language Tv". tribunedigital-sunsentinel.
- ":: BlackElectorate.com ::". www.blackelectorate.com.
- "Differences Between American and Castilian Spanish". antimoon.com.
- "Film Description - Corpus - POV - PBS". pbs.org.
Further reading
- Twinam, Ann. 2015. Purchasing whiteness: Pardos, mulattos, and the quest for social mobility in the Spanish Indies. Stanford: Stanford University Press.