2010 United States House of Representatives elections
The 2010 United States House of Representatives elections were held November 2, 2010 as part of the 2010 midterm elections during President Barack Obama's first term in office. Voters of the 50 U.S. states chose 435 U.S. Representatives. Also, voters of the U.S. territories, commonwealths, and the District of Columbia chose their non-voting delegates.[lower-alpha 1] U.S. Senate elections and various state and local elections were held on the same date.
| |||||||||||||||||||||||||||||||||||||
All 435 seats in the House of Representatives and 5 (of the 6) non-voting members 218 seats needed for a majority | |||||||||||||||||||||||||||||||||||||
|---|---|---|---|---|---|---|---|---|---|---|---|---|---|---|---|---|---|---|---|---|---|---|---|---|---|---|---|---|---|---|---|---|---|---|---|---|---|
| Turnout | 40.9%[1] | ||||||||||||||||||||||||||||||||||||
| |||||||||||||||||||||||||||||||||||||
 Results: Democratic hold Democratic gain Republican hold Republican gain | |||||||||||||||||||||||||||||||||||||
| |||||||||||||||||||||||||||||||||||||
Republicans regained control of the chamber they had lost in the 2006 midterm elections, picking up a net total of 63 seats and erasing the gains Democrats made in 2006 and 2008. Although the sitting U.S. President's party usually loses seats in a midterm election, the 2010 election resulted in the highest losses by a party in a House midterm election since 1938,[6][7] and the largest House swing since 1948.[8] Republicans made their largest gain in House seats since 1938.[9]
The heavy Democratic Party losses in 2010 were attributed to anger at President Obama, opposition to the Affordable Care Act, large budget deficits and the weak economy.[10][11][12]
Background

Following the 2006 elections, Democrats took control of the House as well as the Senate. In the 2008 elections, which coincided with Democrat Barack Obama's victory over Republican John McCain for the presidency, Democrats increased their majorities in both chambers. Of the 435 congressional districts, 242 were carried by Obama, while 193 voted for McCain. Of the districts Obama won, 34 elected a Republican to the House, while 49 of the districts McCain won elected a Democrat.[13]
Republican gains
The Republicans' 63-seat pickup in the House to take control of that chamber, as well as their gain of six Senate seats, signified a dramatic rollback of recent Democratic gains. In the election, Republicans won their greatest number of House seats since 1946.[14] This has been attributed to the continued economic recession, as well as President Obama's controversial stimulus and health care reform bills. Republicans also took control of 29 of the 50 state governorships and gained 690 seats in state legislatures, to hold their greatest number since the 1928 elections.[15]
Republicans also made historic gains in state legislatures, adding more than 675 state legislative seats, by far surpassing their state-legislative gains in 1994.[16][17] Republicans gained control of dozens of state legislative chambers,[16] and took control of "seven more legislatures outright than they did after 1994 and the most since 1952."[17] Republicans picked up control of the Alabama Legislature for the first time since Reconstruction; control of the North Carolina Senate for the first time since 1870; and control of the Minnesota Senate for the first time since the state returned to partisan elections in 1974.[16][17]
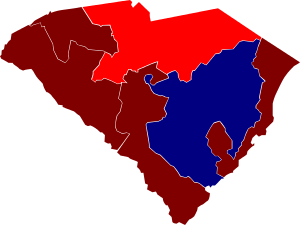
The Great Lakes region, which until then had recently favored the Democratic Party, went strongly Republican. In California and the Pacific Northwest, however, the Democrats retained the upper hand.[18] The biggest change in 2010 occurred in the Southeastern United States, which had previously been roughly evenly split between Democrats and Republicans for everything except for president. Just one white Democrat from the Deep South won reelection to the US House in 2010. Prior to 2010, many white conservative southerners had voted Republican for president, but Democratic for other offices.[19]
Results summary
| 193 | 242 | |
| Democratic | Republican | |
| Parties (and Independents) | Seats | Popular vote | ||||||
|---|---|---|---|---|---|---|---|---|
| 2008 | 2010 | Share | Vote | % | ||||
| Republican Party | 178 | 242 | 55.6% | 44,827,441 | 51.7% | |||
| Democratic Party | 257 | 193 | 44.4% | 38,980,192 | 44.9% | |||
| Libertarian Party | — | — | — | — | 1,010,891 | 1.2% | ||
| Independent | — | — | — | — | 519,043 | 0.6% | ||
| Green Party | — | — | — | — | 252,688 | 0.3% | ||
| Constitution Party | — | — | — | — | 195,008 | 0.2% | ||
| Independence Party | — | — | — | — | 139,473 | 0.2% | ||
| American Independent Party | — | — | — | — | 56,907 | 0.1% | ||
| Others | — | — | — | — | 803314 | 0.9% | — | |
| Totals | 435 | 435 | 0 | 100.0% | 86,784,957 | 100.0% | ||
Sources: House Clerk – Statistics of the Congressional Election, 2010
Voter demographics
| 2010 U.S. House vote by demographic subgroup | |||||||
|---|---|---|---|---|---|---|---|
| Demographic subgroup | DEM | GOP | Other | % of total vote | |||
| Total vote | 45 | 52 | 3 | 100 | |||
| Ideology | |||||||
| Liberals | 90 | 8 | 2 | 20 | |||
| Moderates | 55 | 42 | 3 | 38 | |||
| Conservatives | 13 | 84 | 3 | 42 | |||
| Party | |||||||
| Democrats | 91 | 7 | 2 | 35 | |||
| Republicans | 5 | 94 | 1 | 35 | |||
| Independents | 37 | 56 | 7 | 29 | |||
| Gender | |||||||
| Men | 41 | 55 | 4 | 48 | |||
| Women | 48 | 49 | 3 | 52 | |||
| Race/ethnicity | |||||||
| White | 37 | 60 | 3 | 77 | |||
| Black | 89 | 9 | 2 | 11 | |||
| Asian | 58 | 40 | 2 | 2 | |||
| Other | 53 | 44 | 3 | 2 | |||
| Hispanic (of any race) | 60 | 38 | 2 | 8 | |||
| Gender by race/ethnicity | |||||||
| White men | 34 | 62 | 4 | 38 | |||
| White women | 39 | 58 | 3 | 40 | |||
| Black men | 86 | 13 | 1 | 5 | |||
| Black women | 92 | 6 | 2 | 6 | |||
| Latino men (of any race) | 55 | 44 | 1 | 4 | |||
| Latino women (of any race) | 65 | 33 | 2 | 4 | |||
| All other races | 55 | 42 | 3 | 4 | |||
| Religion | |||||||
| Protestant | 38 | 59 | 3 | 55 | |||
| Catholic | 44 | 54 | 2 | 23 | |||
| Jewish | n/a | n/a | n/a | 2 | |||
| Other religion | 74 | 24 | 2 | 8 | |||
| None | 68 | 30 | 2 | 12 | |||
| Religious service attendance | |||||||
| Weekly | 40 | 58 | 2 | 48 | |||
| Less than weekly | 53 | 44 | 3 | 52 | |||
| White evangelical or born-again Christian | |||||||
| White evangelical or born-again Christian | 19 | 77 | 4 | 25 | |||
| Everyone else | 55 | 42 | 3 | 75 | |||
| Age | |||||||
| 18–24 years old | 57 | 39 | 4 | 6 | |||
| 25–29 years old | 54 | 44 | 2 | 6 | |||
| 30–39 years old | 47 | 48 | 5 | 14 | |||
| 40–49 years old | 43 | 54 | 3 | 21 | |||
| 50–64 years old | 46 | 52 | 2 | 32 | |||
| 65 and older | 38 | 59 | 3 | 21 | |||
| Sexual orientation | |||||||
| LGBT | 69 | 29 | 2 | 3 | |||
| Heterosexual | 46 | 52 | 2 | 97 | |||
| Education | |||||||
| Not a high school graduate | 57 | 36 | 7 | 3 | |||
| High school graduate | 46 | 52 | 2 | 17 | |||
| Some college education | 43 | 53 | 4 | 28 | |||
| College graduate | 40 | 58 | 2 | 30 | |||
| Postgraduate education | 53 | 45 | 2 | 21 | |||
| Education by race/ethnicity | |||||||
| White college graduates | 39 | 58 | 3 | 42 | |||
| White no college degree | 33 | 63 | 4 | 35 | |||
| Non-white college graduates | 70 | 28 | 2 | 9 | |||
| Non-white no college degree | 75 | 23 | 2 | 13 | |||
| Family income | |||||||
| Under $30,000 | 57 | 40 | 3 | 17 | |||
| $30,000–49,999 | 51 | 46 | 3 | 19 | |||
| $50,000–74,999 | 45 | 51 | 4 | 21 | |||
| $75,000–99,999 | 42 | 56 | 2 | 15 | |||
| $100,000–199,999 | 43 | 56 | 1 | 19 | |||
| Over $200,000 | 34 | 64 | 2 | 8 | |||
| Family income by race | |||||||
| Whites under $50,000 | 42 | 54 | 4 | 25 | |||
| Whites over $50,000 | 37 | 61 | 3 | 53 | |||
| Non-whites under $50,000 | 80 | 19 | 1 | 11 | |||
| Non-whites over $50,000 | 69 | 29 | 2 | 11 | |||
| Union households | |||||||
| Union | 61 | 37 | 2 | 17 | |||
| Non-union | 43 | 54 | 3 | 83 | |||
| Issue regarded as most important | |||||||
| War in Afghanistan | 58 | 40 | 2 | 7 | |||
| Health care | 51 | 47 | 2 | 18 | |||
| Economy | 43 | 54 | 3 | 63 | |||
| Illegal immigration | 26 | 68 | 6 | 8 | |||
| Region | |||||||
| Northeast | 54 | 44 | 2 | 21 | |||
| Midwest | 44 | 53 | 3 | 25 | |||
| South | 37 | 61 | 2 | 31 | |||
| West | 49 | 48 | 3 | 23 | |||
| Community size | |||||||
| Urban | 56 | 41 | 3 | 31 | |||
| Suburban | 42 | 55 | 3 | 49 | |||
| Rural | 36 | 61 | 3 | 20 | |||
Retiring incumbents
Thirty-seven incumbents retired.
Democrats
Seventeen incumbent Democrats retired.
- Alabama 7: Artur Davis: To run for Governor of Alabama.[21]
- Arkansas 1: Marion Berry: Retired due to health concerns.[22]
- Arkansas 2: Vic Snyder: Retired to spend more time with family.[23]
- California 33: Diane Watson: Retired; "It should be a seat inherited by someone who can represent everyone in this district."[24]
- Florida 17: Kendrick Meek: To run for U.S. Senator.[25]
- Indiana 8: Brad Ellsworth: To run for U.S. Senator.
- Kansas 3: Dennis Moore: Retired; "Time for a new generation of leadership."[26]
- Louisiana 3: Charlie Melançon: To run for U.S. Senator.[27]
- Massachusetts 10: Bill Delahunt: Retired; "Life is about change. I think it's healthy. It's time."[28]
- Michigan 1: Bart Stupak: Retired; "I've accomplished what I want to do."[29]
- New Hampshire 2: Paul Hodes: To run for U.S. Senator.[30]
- Pennsylvania 7: Joe Sestak: To run for U.S. Senator.[31]
- Rhode Island 1: Patrick J. Kennedy: Retired to "[take] a new direction."[32]
- Tennessee 6: Bart Gordon: Retired; "…it's time for a new chapter."[33]
- Tennessee 8: John S. Tanner: Retired; decided 20 years was long enough.[34]
- Washington 3: Brian Baird: Retired, to pursue other options.[35]
- Wisconsin 7: Dave Obey: Retired; "But even more frankly, I am bone tired."[36] Media reports indicated Obey's future plans included joining a DC lobbying firm run by former Representative Dick Gephardt.[37]
Republicans
Twenty incumbent Republicans retired.
- Arkansas 3: John Boozman: To run for U.S. Senator.
- Arizona 3: John Shadegg: Retired to pursue other interests.[38]
- California 19: George Radanovich: Retired to put family obligations first.[39]
- Delaware at-large: Mike Castle: To run for U.S. Senator.[40]
- Florida 5: Ginny Brown-Waite: Retired due to health issues.[41]
- Florida 12: Adam Putnam: To run for Florida Commissioner of Agriculture.[42]
- Florida 21: Lincoln Díaz-Balart: Retired to return to law practice.
- Florida 25: Mario Díaz-Balart: To run for Florida's 21st district, held by his brother Lincoln Diaz-Balart, who had announced plans to return to law practice.[43]
- Georgia 7: John Linder: Retired.[44]
- Illinois 10: Mark Kirk: To run for U.S. Senator.[45]
- Indiana 4: Steve Buyer: Retired due to wife's illness[46]
- Kansas 1: Jerry Moran: To run for U.S. Senator.[47]
- Kansas 4: Todd Tiahrt: To run for U.S. Senator.[48]
- Michigan 2: Pete Hoekstra: To run for Governor of Michigan.[49]
- Michigan 3: Vern Ehlers: Retired.[50]
- Missouri 7: Roy Blunt: To run for U.S. Senator.[51]
- Oklahoma 5: Mary Fallin: To run for Governor of Oklahoma.[52]
- South Carolina 1: Henry E. Brown Jr.: Retired to spend more time with his family.[53]
- South Carolina 3: Gresham Barrett: To run for Governor of South Carolina.[54]
- Tennessee 3: Zach Wamp: To run for Governor of Tennessee.[55]
Incumbents defeated
There were nine Democrats who survived reelection in the 1994 Republican Revolution, but were defeated this year.
Lost renomination
Democrats
Two Democrats lost renomination. One seat remained Democratic, and the other seat was taken by a Republican.
- Michigan 13: Carolyn Cheeks Kilpatrick lost to Hansen Clarke
- West Virginia 1: Alan Mollohan lost to Mike Oliverio, but Oliverio lost in the general election to Republican David McKinley
Republicans
Two Republicans lost renomination. Both seats remained Republican.
- Alabama 5: Parker Griffith (first elected in 2008 as a Democrat; switched parties in 2009) lost to Mo Brooks
- South Carolina 4: Bob Inglis lost to Trey Gowdy
Lost re-election
Fifty-four incumbents lost in the general election; almost all of them were Democrats.[56][56]
Democrats
52 Democrats lost re-election.
- Alabama 2, Bobby Bright (first elected in 2008) lost to Martha Roby
- Arizona 1, Ann Kirkpatrick (first elected in 2008) lost to Paul Gosar
- Arizona 5, Harry Mitchell (first elected in 2006) lost to David Schweikert
- Colorado 3, John Salazar (first elected in 2004) lost to Scott Tipton
- Colorado 4, Betsy Markey (first elected in 2008) lost to Cory Gardner
- Florida 2, Allen Boyd (first elected in 1996) lost to Steve Southerland
- Florida 8, Alan Grayson (first elected in 2008) lost to Daniel Webster
- Florida 22, Ron Klein (first elected in 2006) lost to Allen West
- Florida 24, Suzanne Kosmas (first elected in 2008) lost to Sandy Adams
- Georgia 8, Jim Marshall (first elected in 2002) lost to Austin Scott
- Idaho 1, Walt Minnick (first elected in 2008) lost to Raúl Labrador
- Illinois 8, Melissa Bean (first elected in 2004) lost to Joe Walsh
- Illinois 11, Debbie Halvorson (first elected in 2008) lost to Adam Kinzinger
- Illinois 14, Bill Foster (first elected in 2008) lost to Randy Hultgren
- Illinois 17, Phil Hare (first elected in 2006) lost to Bobby Schilling
- Indiana 9, Baron Hill (originally elected in 1998) lost to Todd Young
- Maryland 1, Frank Kratovil (first elected in 2008) lost to Andrew P. Harris
- Michigan 7, Mark Schauer (first elected in 2008) lost to Tim Walberg
- Minnesota 8, Jim Oberstar (first elected in 1974) lost to Chip Cravaack
- Mississippi 1, Travis Childers (first elected in 2008) lost to Alan Nunnelee
- Mississippi 4, Gene Taylor (first elected in 1989) lost to Steven Palazzo
- Missouri 4, Ike Skelton (first elected in 1976) lost to Vicky Hartzler
- Nevada 3, Dina Titus (first elected in 2008) lost to Joe Heck
- New Hampshire 1, Carol Shea-Porter (first elected in 2006) lost to Frank Guinta
- New Jersey 3, John Adler (first elected in 2008) lost to Jon Runyan
- New Mexico 2, Harry Teague (first elected in 2008) lost to Steve Pearce
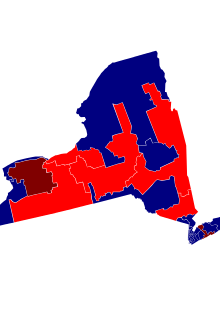
- New York 13, Michael McMahon (first elected in 2008) lost to Michael Grimm
- New York 19, John Hall (first elected in 2006) lost to Nan Hayworth
- New York 20, Scott Murphy (first elected in 2009) lost to Chris Gibson
- New York 24, Mike Arcuri (first elected in 2006) lost to Richard L. Hanna
- New York 25, Dan Maffei (first elected in 2008) lost to Ann Marie Buerkle
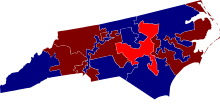
- North Carolina 2, Bob Etheridge (first elected in 1996) lost to Renee Ellmers
- North Dakota at-large, Earl Pomeroy (first elected in 1992) lost to Rick Berg
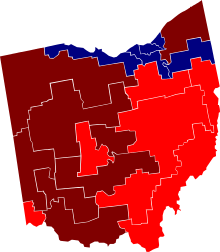
- Ohio 1, Steve Driehaus (first elected in 2008) lost to Steve Chabot
- Ohio 6, Charlie Wilson (first elected in 2006) lost to Bill Johnson
- Ohio 15, Mary Jo Kilroy (first elected in 2008) lost to Steve Stivers
- Ohio 16, John Boccieri (first elected in 2008) lost to Jim Renacci
- Ohio 18, Zack Space (first elected in 2006) lost to Bob Gibbs
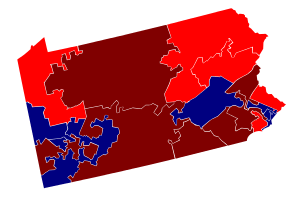
- Pennsylvania 3, Kathy Dahlkemper (first elected in 2008) lost to Mike Kelly
- Pennsylvania 8, Patrick Murphy (first elected in 2006) lost to Mike Fitzpatrick
- Pennsylvania 10, Chris Carney (first elected in 2006) lost to Tom Marino
- Pennsylvania 11, Paul E. Kanjorski (first elected in 1984) lost to Lou Barletta
- South Carolina 5, John Spratt (first elected in 1982) lost to Mick Mulvaney
- South Dakota at-large, Stephanie Herseth Sandlin (first elected in 2004) lost to Kristi Noem
- Tennessee 4, Lincoln Davis (first elected in 2002) lost to Scott DesJarlais
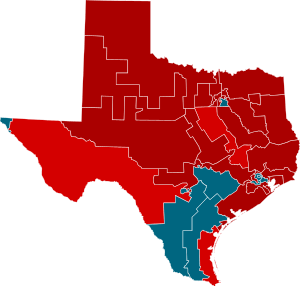
- Texas 17, Chet Edwards (first elected in 1990) lost to Bill Flores
- Texas 23, Ciro Rodriguez (originally elected in 1996) lost to Quico Canseco
- Texas 27, Solomon P. Ortiz (first elected in 1982) lost to Blake Farenthold
- Virginia 2, Glenn Nye (first elected in 2008) lost to Scott Rigell
- Virginia 5, Tom Perriello (first elected in 2008) lost to Robert Hurt
- Virginia 9, Rick Boucher (first elected in 1982) lost to Morgan Griffith
- Wisconsin 8, Steve Kagen (first elected in 2006) lost to Reid Ribble
Republicans
Two Republicans lost re-election.
- Hawaii 1, Charles Djou (first elected in 2010) lost to Colleen Hanabusa
- Louisiana 2, Joseph Cao (first elected in 2008) lost to Cedric Richmond
Open seat gains
Democratic to Republican
Fourteen open seats, held by Democrats, were won by Republicans.
Republican to Democratic
One open seat, held by a Republican, was won by a Democrat.
Predictions

These were predictions of the outcome of the 2010 United States House of Representatives elections.
- RealClearPolitics.
- As of November 2, 2010, RCP projected the Republicans would take 224 seats, the Democrats would take 167, and 44 races were toss-ups.[57]
- Nate Silver, FiveThirtyEight (New York Times)
- As of November 2, 2010, Nate Silver's prediction model projected the Republicans would win (on average) 232.2 seats, and the Democrats would win 202.8.[58]
- Patrick Ishmael, Hot Air.com
- Crystal Ball
- As of November 1, 2010, Larry Sabato predicted, "If the election were held today: + 55 Republican House seats".[62]
- Charlie Cook
- On October 26, 2010, The Cook Political Report raised its House forecast to "a Democratic net loss of 48 to 60 seats, with higher losses possible."[63]
- In a February 2010 interview with National Journal, he said that "it's very hard to come up with a scenario where Democrats don't lose the House. It's very hard."[64]
- Rasmussen Reports
- On November 1, 2010, Scott Rasmussen predicted the Democrats "will likely lose 55 or more seats in the House."[65]
- Rothenberg Political Report.
- On October 28, 2010, Rothenberg Political Report predicted "Likely Republican gain of 55–65 seats, with gains at or above 70 seats possible."[66]
- In April 2010, Stuart Rothenberg wrote on his blog that "…the atmospherics remain strongly behind the GOP, and major Republican House gains are extremely likely" and that "it's clear that the battleground is almost entirely on Democratic soil. Obviously, control of the House is at risk."[67]
- Congressional Quarterly.
- In October 2010, Congressional Quarterly projected the Democrats would take 195 seats, the Republicans 199, and they considered 41 races too close to call.[68]
- In July 2010, Congressional Quarterly projected the Democrats would take 205 seats, the Republicans 190, and they considered 40 races too close to call.[69]
The following table contains the final ratings of the competitiveness of selected races according to noted political analysts. Races which were considered safe for the incumbent's party are not included. Incumbents who did not run for re-election have parentheses around their name.
| District | Incumbent | Cook[70] | Rothenberg[71] | CQ Politics[72] | Sabato's Crystal Ball[73] |
RealClear[74] | Winner |
|---|---|---|---|---|---|---|---|
| AL-2 | Bright (D) | Tossup | Tilt R | Tossup | Lean D | Tossup | Roby (R) |
| AL-5 | (Griffith) (R) | Likely R | Safe R | Safe R | Likely R | Likely R | Brooks (R) |
| AZ-1 | Kirkpatrick (D) | Lean R | Lean R | Lean R | Lean R | Lean R | Gosar (R) |
| AZ-3 | (Shadegg) (R) | Lean R | Safe R | Safe R | Lean R | Lean R | Quayle (R) |
| AZ-5 | Mitchell (D) | Tossup | Tilt R | Tossup | Lean R | Lean R | Schweikert (R) |
| AZ-7 | Grijalva (D) | Tossup | Lean D | Lean D | Lean D | Tossup | Grijalva (D) |
| AZ-8 | Giffords (D) | Tossup | Tossup | Tossup | Lean D | Lean R | Giffords (D) |
| AR-1 | (Berry) (D) | Lean R | Tilt R | Tossup | Lean R | Lean R | Crawford (R) |
| AR-2 | (Snyder) (D) | Likely R | Favored R | Likely R | Likely R | Likely R | Griffin (R) |
| CA-3 | Lungren (R) | Lean R | Lean R | Lean R | Lean R | Lean R | Lungren (R) |
| CA-11 | McNerney (D) | Tossup | Tossup | Tossup | Lean R | Lean R | McNerney (D) |
| CA-18 | Cardoza (D) | Likely D | Safe D | Safe D | Likely D | Lean D | Cardoza (D) |
| CA-20 | Costa (D) | Tossup | Lean D | Lean D | Lean D | Lean R | Costa (D) |
| CA-47 | Sanchez (D) | Lean D | Lean D | Lean D | Likely D | Lean D | Sanchez (D) |
| CO-3 | Salazar (D) | Tossup | Tilt R | Tossup | Lean R | Lean R | Tipton (R) |
| CO-4 | Markey (D) | Lean R | Favored R | Likely R | Lean R | Lean R | Gardner (R) |
| CO-7 | Perlmutter (D) | Lean D | Favored D | Lean D | Likely D | Tossup | Perlmutter (D) |
| CT-4 | Himes (D) | Lean D | Favored D | Lean D | Lean D | Tossup | Himes (D) |
| CT-5 | C. Murphy (D) | Lean D | Favored D | Lean D | Lean D | Tossup | C. Murphy (D) |
| DE-AL | (Castle) (R) | Likely D | Lean D | Likely D | Lean D | Lean D | Carney (D) |
| FL-2 | Boyd (D) | Lean R | Favored R | Lean R | Lean R | Lean R | Southerland (R) |
| FL-8 | Grayson (D) | Likely R | Favored R | Lean R | Lean R | Lean R | Webster (R) |
| FL-12 | (Putnam) (R) | Lean R | Tilt R | Lean R | Lean R | Likely R | Ross (R) |
| FL-22 | Klein (D) | Tossup | Tossup | Lean D | Lean R | Lean R | West (R) |
| FL-24 | Kosmas (D) | Lean R | Favored R | Likely R | Lean R | Lean R | Adams (R) |
| FL-25 | (M. Diaz-Balart) (R) | Lean R | Lean R | Lean R | Lean R | Lean R | Rivera (R) |
| GA-2 | S. Bishop (D) | Tossup | Lean D | Tossup | Lean R | Lean R | S. Bishop (D) |
| GA-8 | Marshall (D) | Lean R | Lean R | Lean R | Lean R | Lean R | Scott (R) |
| HI-1 | Djou (R) | Tossup | Tossup | Tossup | Lean R | Tossup | Hanabusa (D) |
| ID-1 | Minnick (D) | Tossup | Tilt D | Lean D | Lean R | Tossup | Labrador (R) |
| IL-8 | Bean (D) | Likely D | Safe D | Safe D | Likely D | Lean D | Walsh (R) |
| IL-10 | (Kirk) (R) | Lean D | Tilt D | Lean D | Lean D | Tossup | Dold (R) |
| IL-11 | Halvorson (D) | Lean R | Favored R | Likely R | Lean R | Likely R | Kinzinger (R) |
| IL-14 | Foster (D) | Tossup | Tilt R | Tossup | Lean R | Lean R | Hultgren (R) |
| IL-17 | Hare (D) | Tossup | Tilt R | Tossup | Lean R | Lean R | Schilling (R) |
| IN-2 | Donnelly (D) | Tossup | Lean D | Lean D | Lean D | Tossup | Donnelly (D) |
| IN-8 | (Ellsworth) (D) | Likely R | Favored R | Likely R | Likely R | Lean R | Bucshon (R) |
| IN-9 | Hill (D) | Tossup | Tilt R | Lean R | Lean R | Lean R | Young (R) |
| IA-1 | Braley (D) | Lean D | Favored D | Lean D | Likely D | Lean D | Braley (D) |
| IA-2 | Loebsack (D) | Lean D | Favored D | Lean D | Likely D | Lean D | Loebsack (D) |
| IA-3 | Boswell (D) | Lean D | Favored D | Lean D | Lean D | Lean D | Boswell (D) |
| KS-3 | (Moore) (D) | Likely R | Favored R | Likely R | Likely R | Likely R | Yoder (R) |
| KY-3 | Yarmuth (D) | Likely D | Favored D | Likely D | Likely D | Lean D | Yarmuth (D) |
| KY-6 | Chandler (D) | Tossup | Lean D | Lean D | Lean D | Tossup | Chandler (D) |
| LA-2 | Cao (R) | Lean D | Favored D | Likely D | Lean D | Lean D | Richmond (D) |
| LA-3 | (Melancon) (D) | Likely R | Favored R | Safe R | Likely R | Likely R | Landry (R) |
| ME-1 | Pingree (D) | Tossup | Favored D | Lean D | Lean D | Tossup | Pingree (D) |
| ME-2 | Michaud (D) | Lean D | Favored D | Likely D | Safe D | Tossup | Michaud (D) |
| MD-1 | Kratovil (D) | Lean R | Lean R | Lean R | Lean R | Lean R | Harris (R) |
| MA-4 | Frank (D) | Lean D | Safe D | Likely D | Likely D | Lean D | Frank (D) |
| MA-5 | Tsongas (D) | Likely D | Safe D | Likely D | Safe D | Likely D | Tsongas (D) |
| MA-10 | (Delahunt) (D) | Tossup | Tossup | Tossup | Lean D | Tossup | Keating (D) |
| MI-1 | (Stupak) (D) | Lean R | Tossup/Tilt R | Lean R | Lean R | Lean R | Benishek (R) |
| MI-7 | Schauer (D) | Tossup | Tossup | Tossup | Lean R | Tossup | Walberg (R) |
| MI-9 | Peters (D) | Lean D | Lean D | Likely D | Lean D | Tossup | Peters (D) |
| MN-1 | Walz (D) | Lean D | Favored D | Lean D | Lean D | Lean D | Walz (D) |
| MN-6 | Bachmann (R) | Likely R | Safe R | Safe R | Likely R | Likely R | Bachmann (R) |
| MN-8 | Oberstar (D) | Tossup | Favored D | Likely D | Lean D | Tossup | Cravaack (R) |
| MS-1 | Childers (D) | Tossup | Tilt R | Tossup | Lean R | Lean R | Nunnelee (R) |
| MS-4 | Taylor (D) | Tossup | Tossup | Tossup | Lean D | Tossup | Palazzo (R) |
| MO-3 | Carnahan (D) | Lean D | Favored D | Likely D | Likely D | Lean D | Carnahan (D) |
| MO-4 | Skelton (D) | Tossup | Tossup | Tossup | Lean D | Tossup | Hartzler (R) |
| NE-2 | Terry (R) | Likely R | Safe R | Safe R | Likely R | Likely R | Terry (R) |
| NV-3 | Titus (D) | Lean R | Tilt R | Lean R | Lean R | Lean R | Heck (R) |
| NH-1 | Shea-Porter (D) | Lean R | Favored R | Lean R | Lean R | Lean R | Guinta (R) |
| NH-2 | (Hodes) (D) | Tossup | Tossup | Tossup | Lean R | Tossup | Bass (R) |
| NJ-3 | Adler (D) | Tossup | Tilt R | Lean D | Lean R | Lean R | Runyan (R) |
| NJ-12 | Holt (D) | Likely D | Safe D | Safe D | Likely D | Lean D | Holt (D) |
| NM-1 | Heinrich (D) | Tossup | Tossup | Lean D | Lean D | Tossup | Heinrich (D) |
| NM-2 | Teague (D) | Lean R | Lean R | Tossup | Lean R | Lean R | Pearce (R) |
| NY-1 | T. Bishop (D) | Tossup | Tilt D | Tossup | Likely D | Tossup | T. Bishop (D) |
| NY-4 | McCarthy (D) | Likely D | Safe D | Likely D | Safe D | Likely D | McCarthy (D) |
| NY-13 | McMahon (D) | Lean D | Favored D | Lean D | Likely D | Tossup | Grimm (R) |
| NY-19 | Hall (D) | Tossup | Tilt R | Tossup | Lean R | Tossup | Hayworth (R) |
| NY-20 | S. Murphy (D) | Tossup | Tilt R | Tossup | Lean R | Lean R | Gibson (R) |
| NY-22 | Hinchey (D) | Lean D | Safe D | Likely D | Likely D | Lean D | Hinchey (D) |
| NY-23 | Owens (D) | Tossup | Tossup | Tossup | Lean R | Lean R | Owens (D) |
| NY-24 | Arcuri (D) | Tossup | Tossup | Tossup | Lean D | Tossup | Hanna (R) |
| NY-25 | Maffei (D) | Lean D | Favored D | Likely D | Likely D | Lean D | Buerkle (R) |
| NY-29 | Zeller (D) | Likely R | Favored R | Safe R | Likely R | Likely R | Reed (R) |
| NC-2 | Etheridge (D) | Lean D | Tilt D | Likely D | Likely D | Tossup | Ellmers (R) |
| NC-7 | McIntyre (D) | Tossup | Tilt D | Lean D | Likely D | Tossup | McIntyre (D) |
| NC-8 | Kissell (D) | Tossup | Lean D | Tossup | Lean R | Tossup | Kissell (D) |
| NC-11 | Shuler (D) | Lean D | Favored D | Likely D | Likely D | Tossup | Shuler (D) |
| ND-AL | Pomeroy (D) | Tossup | Tossup/Tilt R | Tossup | Lean R | Lean R | Berg (R) |
| OH-1 | Driehaus (D) | Lean R | Favored R | Likely R | Lean R | Lean R | Chabot (R) |
| OH-6 | Wilson (D) | Tossup | Tossup | Tossup | Lean D | Tossup | Johnson (R) |
| OH-12 | Tiberi (R) | Likely R | Safe R | Safe R | Likely R | Likely R | Tiberi (R) |
| OH-13 | Sutton (D) | Likely D | Favored D | Likely D | Likely D | Lean D | Sutton (D) |
| OH-15 | Kilroy (D) | Lean R | Favored R | Likely R | Lean R | Likely R | Stivers (R) |
| OH-16 | Boccieri (D) | Tossup | Lean R | Tossup | Lean R | Lean R | Renacci (R) |
| OH-18 | Space (D) | Tossup | Tilt R | Tossup | Lean R | Lean R | Gibbs (R) |
| OR-1 | Wu (D) | Likely D | Safe D | Likely D | Safe D | Likely D | Wu (D) |
| OR-5 | Schrader (D) | Tossup | Tossup | Tossup | Lean D | Tossup | Schrader (D) |
| PA-3 | Dahlkemper (D) | Lean R | Favored R | Likely R | Lean R | Lean R | Kelly (R) |
| PA-4 | Altmire (D) | Lean D | Favored D | Likely D | Likely D | Lean D | Altmire (D) |
| PA-6 | Gerlach (R) | Likely R | Safe R | Safe R | Likely R | Lean R | Gerlach (R) |
| PA-7 | (Sestak) (D) | Lean R | Tilt R | Tossup | Lean R | Tossup | Meehan (R) |
| PA-8 | P. Murphy (D) | Tossup | Tilt R | Tossup | Lean R | Tossup | Fitzpatrick (R) |
| PA-10 | Carney (D) | Tossup | Tossup | Tossup | Lean R | Lean R | Marino (R) |
| PA-11 | Kanjorski (D) | Tossup | Tilt R | Lean R | Lean R | Tossup | Barletta (R) |
| PA-12 | Critz (D) | Lean D | Tossup | Lean D | Lean D | Tossup | Critz (D) |
| PA-15 | Dent (R) | Likely R | Favored R | Lean R | Lean R | Likely R | Dent (R) |
| PA-17 | Holden (D) | Likely D | Safe D | Likely D | Likely D | Likely D | Holden (D) |
| RI-1 | (Kennedy) (D) | Lean D | Lean D | Lean D | Lean D | Tossup | Cicilline (D) |
| SC-5 | Spratt (D) | Tossup | Lean R | Lean R | Lean R | Lean R | Mulvaney (R) |
| SD-AL | Herseth Sandlin (D) | Tossup | Tilt R | Tossup | Lean R | Lean R | Noem (R) |
| TN-4 | Davis (D) | Tossup | Tilt R | Tossup | Lean R | Tossup | DesJarlais (R) |
| TN-6 | (Gordon) (D) | Likely R | Favored R | Safe R | Likely R | Likely R | Black (R) |
| TN-8 | (Tanner) (D) | Likely R | Favored R | Likely R | Likely R | Likely R | Fincher (R) |
| TX-17 | Edwards (D) | Lean R | Favored R | Likely R | Lean R | Likely R | Flores (R) |
| TX-23 | Rodriguez (D) | Tossup | Tossup | Tossup | Lean R | Lean R | Canseco (R) |
| TX-27 | Ortiz (D) | Lean D | Favored D | Likely D | Safe D | Tossup | Farenthold (R) |
| VA-2 | Nye (D) | Lean R | Lean R | Lean R | Lean R | Lean R | Rigell (R) |
| VA-5 | Perriello (D) | Lean R | Tilt R | Tossup | Lean R | Lean R | Hurt (R) |
| VA-9 | Boucher (D) | Tossup | Tilt D | Lean D | Lean D | Tossup | Griffith (R) |
| VA-11 | Connolly (D) | Tossup | Lean D | Lean D | Lean D | Tossup | Connolly (D) |
| WA-2 | Larsen (D) | Tossup | Lean D | Lean D | Lean D | Tossup | Larsen (D) |
| WA-3 | (Baird) (D) | Lean R | Tilt R | Lean R | Lean R | Tossup | Herrera (R) |
| WA-8 | Reichert (R) | Likely R | Favored R | Lean R | Lean R | Lean R | Reichert (R) |
| WV-1 | (Mollohan) (D) | Tossup | Pure tossup | Tossup | Lean R | Tossup | McKinley (R) |
| WV-3 | Rahall (D) | Likely D | Safe D | Likely D | Likely D | Lean D | Rahall (D) |
| WI-3 | Kind (D) | Lean D | Favored D | Lean D | Likely D | Tossup | Kind (D) |
| WI-7 | (Obey) (D) | Tossup | Tilt R | Tossup | Lean R | Lean R | Duffy (R) |
| WI-8 | Kagen (D) | Lean R | Lean R | Lean R | Lean R | Lean R | Ribble (R) |
| District | Incumbent | Cook | Rothenberg | CQ Politics | Sabato's Crystal Ball |
RealClear | Winner |
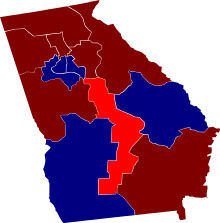
Alabama

| District | Incumbent | Results | Candidates | |||
|---|---|---|---|---|---|---|
| District | 2008 CPVI | Representative | Party | First elected | ||
| Alabama 1 | R+14 | Jo Bonner | Republican | 2002 | Incumbent re-elected. |
|
| Alabama 2 | R+16 | Bobby Bright | Democratic | 2008 | Incumbent lost re-election. New member elected. Republican gain. |
|
| Alabama 3 | R+9 | Mike Rogers | Republican | 2002 | Incumbent re-elected. |
|
| Alabama 4 | R+26 | Robert Aderholt | Republican | 1996 | Incumbent re-elected. |
|
| Alabama 5 | R+12 | Parker Griffith | Republican | 2008 | Incumbent lost renomination. New member elected. Republican hold. |
|
| Alabama 6 | R+29 | Spencer Bachus | Republican | 1992 | Incumbent re-elected. |
|
| Alabama 7 | D+18 | Artur Davis | Democratic | 2002 | Incumbent retired to run for Governor of Alabama. New member elected. Democratic hold. |
|
Alaska

| District | Incumbent | Results | Candidates | |||
|---|---|---|---|---|---|---|
| District | 2008 CPVI | Member[75] | Party | First elected | ||
| Alaska at-large | R+13 | Don Young | Republican | 1973 | Incumbent re-elected. |
|
Arizona
| District | Incumbent | Results | Candidates | |||
|---|---|---|---|---|---|---|
| District | 2008 CPVI | Member[76] | Party | First elected | ||
| Arizona 1 | R+6 | Ann Kirkpatrick | Democratic | 2008 | Incumbent lost re-election. New member elected. Republican gain. |
|
| Arizona 2 | R+13 | Trent Franks | Republican | 2002 | Incumbent re-elected. |
|
| Arizona 3 | R+9 | John Shadegg | Republican | 1994 | Incumbent retired. New member elected. Republican hold. |
|
| Arizona 4 | D+13 | Ed Pastor | Democratic | 1991 | Incumbent re-elected. |
|
| Arizona 5 | R+5 | Harry Mitchell | Democratic | 2006 | Incumbent lost re-election. New member elected. Republican gain. |
|
| Arizona 6 | R+15 | Jeff Flake | Republican | 2000 | Incumbent re-elected. |
|
| Arizona 7 | D+6 | Raul Grijalva | Democratic | 2002 | Incumbent re-elected. |
|
| Arizona 8 | R+4 | Gabrielle Giffords | Democratic | 2006 | Incumbent re-elected. |
|
Arkansas
| District | Incumbent | Results | Candidates | |||
|---|---|---|---|---|---|---|
| District | 2008 CPVI | Member[77] | Party | First elected | ||
| Arkansas 1 | R+8 | Marion Berry | Democratic | 1996 | Incumbent retired. New member elected. Republican gain. |
|
| Arkansas 2 | R+5 | Vic Snyder | Democratic | 1996 | Incumbent retired. New member elected. Republican gain. |
|
| Arkansas 3 | R+16 | John Boozman | Republican | 2000 | Incumbent retired to run for U.S. Senator. New member elected. Republican hold. |
|
| Arkansas 4 | R+7 | Mike Ross | Democratic | 2000 | Incumbent re-elected. |
|
California

| District | Incumbent | Results | Candidates | |||
|---|---|---|---|---|---|---|
| District | 2008 CPVI | Member[78] | Party | First elected | ||
| California 1 | D+13 | Mike Thompson | Democratic | 1998 | Incumbent re-elected. |
|
| California 2 | R+11 | Wally Herger | Republican | 1988 | Incumbent re-elected. |
|
| California 3 | R+6 | Dan Lungren | Republican | 2004 | Incumbent re-elected. |
|
| California 4 | R+10 | Tom McClintock | Republican | 2008 | Incumbent re-elected. |
|
| California 5 | D+15 | Doris Matsui | Democratic | 2005 | Incumbent re-elected. |
|
| California 6 | D+23 | Lynn Woolsey | Democratic | 1992 | Incumbent re-elected. |
|
| California 7 | D+19 | George Miller | Democratic | 1974 | Incumbent re-elected. |
|
| California 8 | D+35 | Nancy Pelosi | Democratic | 1987 | Incumbent re-elected. |
|
| California 9 | D+37 | Barbara Lee | Democratic | 1998 | Incumbent re-elected. |
|
| California 10 | D+11 | John Garamendi | Democratic | 2009 | Incumbent re-elected. |
|
| California 11 | R+1 | Jerry McNerney | Democratic | 2006 | Incumbent re-elected. |
|
| California 12 | D+23 | Jackie Speier | Democratic | 2008 | Incumbent re-elected. |
|
| California 13 | D+22 | Pete Stark | Democratic | 1972 | Incumbent re-elected. |
|
| California 14 | D+21 | Anna Eshoo | Democratic | 1992 | Incumbent re-elected. |
|
| California 15 | D+15 | Mike Honda | Democratic | 2000 | Incumbent re-elected. |
|
| California 16 | D+16 | Zoe Lofgren | Democratic | 1994 | Incumbent re-elected. |
|
| California 17 | D+19 | Sam Farr | Democratic | 1992 | Incumbent re-elected. |
|
| California 18 | D+4 | Dennis Cardoza | Democratic | 2002 | Incumbent re-elected. |
|
| California 19 | R+9 | George Radanovich | Republican | 1994 | Incumbent retired. New member elected. Republican hold. |
|
| California 20 | D+5 | Jim Costa | Democratic | 2004 | Incumbent re-elected. |
|
| California 21 | R+14 | Devin Nunes | Republican | 2000 | Incumbent re-elected. |
|
| California 22 | R+16 | Kevin McCarthy | Republican | 2006 | Incumbent re-elected. |
|
| California 23 | D+12 | Lois Capps | Democratic | 1998 | Incumbent re-elected. |
|
| California 24 | R+4 | Elton Gallegly | Republican | 1986 | Incumbent re-elected. |
|
| California 25 | R+6 | Howard McKeon | Republican | 1992 | Incumbent re-elected. |
|
| California 26 | R+3 | David Dreier | Republican | 1980 | Incumbent re-elected. |
|
| California 27 | D+13 | Brad Sherman | Democratic | 1996 | Incumbent re-elected. |
|
| California 28 | D+23 | Howard Berman | Democratic | 1982 | Incumbent re-elected. |
|
| California 29 | D+14 | Adam Schiff | Democratic | 2000 | Incumbent re-elected. |
|
| California 30 | D+18 | Henry Waxman | Democratic | 1974 | Incumbent re-elected. |
|
| California 31 | D+29 | Xavier Becerra | Democratic | 1992 | Incumbent re-elected. |
|
| California 32 | D+15 | Judy Chu | Democratic | 2009 | Incumbent re-elected. |
|
| California 33 | D+35 | Diane Watson | Democratic | 2001 | Incumbent retired. New member elected. Democratic hold. |
|
| California 34 | D+22 | Lucille Roybal-Allard | Democratic | 1992 | Incumbent re-elected. |
|
| California 35 | D+31 | Maxine Waters | Democratic | 1990 | Incumbent re-elected. |
|
| California 36 | D+12 | Jane Harman | Democratic | 1986 | Incumbent re-elected. |
|
| California 37 | D+26 | Laura Richardson | Democratic | 2007 | Incumbent re-elected. |
|
| California 38 | D+18 | Grace Napolitano | Democratic | 1998 | Incumbent re-elected. |
|
| California 39 | D+12 | Linda Sánchez | Democratic | 2002 | Incumbent re-elected. |
|
| California 40 | R+8 | Ed Royce | Republican | 1992 | Incumbent re-elected. |
|
| California 41 | R+10 | Jerry Lewis | Republican | 1978 | Incumbent re-elected. |
|
| California 42 | R+10 | Gary Miller | Republican | 1998 | Incumbent re-elected. |
|
| California 43 | D+13 | Joe Baca | Democratic | 1999 | Incumbent re-elected. |
|
| California 44 | R+6 | Ken Calvert | Republican | 1992 | Incumbent re-elected. |
|
| California 45 | R+3 | Mary Bono | Republican | 1998 | Incumbent re-elected. |
|
| California 46 | R+6 | Dana Rohrabacher | Republican | 1988 | Incumbent re-elected. |
|
| California 47 | D+4 | Loretta Sanchez | Democratic | 1996 | Incumbent re-elected. |
|
| California 48 | R+6 | John Campbell | Republican | 2005 | Incumbent re-elected. |
|
| California 49 | R+10 | Darrell Issa | Republican | 2000 | Incumbent re-elected. |
|
| California 50 | R+3 | Brian Bilbray | Republican | 2006 | Incumbent re-elected. |
|
| California 51 | D+8 | Bob Filner | Democratic | 1992 | Incumbent re-elected. |
|
| California 52 | R+9 | Duncan D. Hunter | Republican | 2008 | Incumbent re-elected. |
|
| California 53 | D+14 | Susan Davis | Democratic | 2000 | Incumbent re-elected. |
|
Colorado

| District | Incumbent | Results | Candidates | |||
|---|---|---|---|---|---|---|
| District | 2008 CPVI | Member[79] | Party | First elected | ||
| Colorado 1 | D+21 | Diana DeGette | Democratic | 1996 | Incumbent re-elected. |
|
| Colorado 2 | D+11 | Jared Polis | Democratic | 2008 | Incumbent re-elected. |
|
| Colorado 3 | R+5 | John Salazar | Democratic | 2004 | Incumbent lost re-election. New member elected. Republican gain. |
|
| Colorado 4 | R+6 | Betsy Markey | Democratic | 2008 | Incumbent lost re-election. New member elected. Republican gain. |
|
| Colorado 5 | R+14 | Doug Lamborn | Republican | 2006 | Incumbent re-elected. |
|
| Colorado 6 | R+8 | Mike Coffman | Republican | 2008 | Incumbent re-elected. |
|
| Colorado 7 | D+4 | Ed Perlmutter | Democratic | 2006 | Incumbent re-elected. |
|
Connecticut
| District | Incumbent | Results | Candidates | |||
|---|---|---|---|---|---|---|
| District | 2008 CPVI | Member[80] | Party | First elected | ||
| Connecticut 1 | D+13 | John Larson | Democratic | 1998 | Incumbent re-elected. |
|
| Connecticut 2 | D+6 | Joe Courtney | Democratic | 2006 | Incumbent re-elected. |
|
| Connecticut 3 | D+9 | Rosa DeLauro | Democratic | 1990 | Incumbent re-elected. |
|
| Connecticut 4 | D+5 | Jim Himes | Democratic | 2008 | Incumbent re-elected. |
|
| Connecticut 5 | D+2 | Chris Murphy | Democratic | 2006 | Incumbent re-elected. |
|
Delaware
| District | Incumbent | Results | Candidates[81] | |||
|---|---|---|---|---|---|---|
| District | 2008 CPVI | Representative | Party | First elected | ||
| Delaware at-large | D+7 | Michael Castle | Republican | 1992 | Incumbent retired to run for U.S. Senator. New member elected. Democratic gain. |
|
Florida
| District | Incumbent | Results | Candidates[82] | |||
|---|---|---|---|---|---|---|
| District | 2008 CPVI | Representative | Party | First elected | ||
| Florida 1 | R+21 | Jeff Miller | Republican | 2001 | Incumbent re-elected. |
|
| Florida 2 | R+6 | Allen Boyd | Democratic | 1996 | Incumbent lost re-election. New member elected. Republican gain. |
|
| Florida 3 | D+18 | Corrine Brown | Democratic | 1992 | Incumbent re-elected. |
|
| Florida 4 | R+17 | Ander Crenshaw | Republican | 2000 | Incumbent re-elected. |
|
| Florida 5 | R+9 | Ginny Brown-Waite | Republican | 2002 | Incumbent retired. New member elected. Republican hold. |
|
| Florida 6 | R+10 | Cliff Stearns | Republican | 1988 | Incumbent re-elected. |
|
| Florida 7 | R+7 | John Mica | Republican | 1992 | Incumbent re-elected. |
|
| Florida 8 | R+2 | Alan Grayson | Democratic | 2008 | Incumbent lost re-election. New member elected. Republican gain. |
|
| Florida 9 | R+6 | Gus Bilirakis | Republican | 2006 | Incumbent re-elected. |
|
| Florida 10 | R+1 | Bill Young | Republican | 1970 | Incumbent re-elected. |
|
| Florida 11 | D+11 | Kathy Castor | Democratic | 2006 | Incumbent re-elected. |
|
| Florida 12 | R+6 | Adam Putnam | Republican | 2000 | Incumbent retired to run for Florida Agriculture Commissioner. New member elected. Republican hold. |
|
| Florida 13 | R+6 | Vern Buchanan | Republican | 2006 | Incumbent re-elected. |
|
| Florida 14 | R+11 | Connie Mack IV | Republican | 2004 | Incumbent re-elected. |
|
| Florida 15 | R+6 | Bill Posey | Republican | 2008 | Incumbent re-elected. |
|
| Florida 16 | R+5 | Tom Rooney | Republican | 2008 | Incumbent re-elected. |
|
| Florida 17 | D+34 | Kendrick Meek | Democratic | 2002 | Incumbent retired to run for U.S. Senator. New member elected. Democratic hold. |
|
| Florida 18 | R+3 | Ileana Ros-Lehtinen | Republican | 1989 | Incumbent re-elected. |
|
| Florida 19 | D+15 | Ted Deutch | Democratic | 2010 | Incumbent re-elected. |
|
| Florida 20 | D+13 | Debbie Wasserman Schultz | Democratic | 2004 | Incumbent re-elected. |
|
| Florida 21 | style="background-color:#FFB6B6" data-sort-value=5 | R+5 | Lincoln Diaz-Balart | Republican | 1992 | Incumbent retired. New member elected. Republican hold. |
|
| Mario Díaz-Balart (Moved from the 25th district |
Republican | 2002 | Incumbent re-elected. | |||
| Florida 22 | D+1 | Ron Klein | Democratic | 2006 | Incumbent lost re-election. New member elected. Republican gain. |
|
| Florida 23 | D+28 | Alcee Hastings | Democratic | 1992 | Incumbent re-elected. |
|
| Florida 24 | R+4 | Suzanne Kosmas | Democratic | 2008 | Incumbent lost re-election. New member elected. Republican gain. |
|
| Florida 25 | R+5 | Open seat. Incumbent moved to 21st district |
Republican hold |
| ||
Georgia
| District | Incumbent | Results | Candidates[83] | |||
|---|---|---|---|---|---|---|
| District | 2008 CPVI | Representative | Party | First elected | ||
| Georgia 1 | R+16 | Jack Kingston | Republican | 1992 | Incumbent re-elected. |
|
| Georgia 2 | D+1 | Sanford Bishop | Democratic | 1992 | Incumbent re-elected. |
|
| Georgia 3 | R+19 | Lynn Westmoreland | Republican | 2004 | Incumbent re-elected. |
|
| Georgia 4 | D+24 | Hank Johnson | Democratic | 2006 | Incumbent re-elected. |
|
| Georgia 5 | D+26 | John Lewis | Democratic | 1986 | Incumbent re-elected. |
|
| Georgia 6 | R+19 | Tom Price | Republican | 2004 | Incumbent re-elected. |
|
| Georgia 7 | R+16 | John Linder | Republican | 1992 | Incumbent retired. New member elected. Republican hold. |
|
| Georgia 8 | R+10 | Jim Marshall | Democratic | 2002 | Incumbent lost re-election. New member elected. Republican gain. |
|
| Georgia 9 | R+28 | Tom Graves | Republican | 2010 | Incumbent re-elected. |
|
| Georgia 10 | R+15 | Paul Broun | Republican | 2007 | Incumbent re-elected. |
|
| Georgia 11 | R+20 | Phil Gingrey | Republican | 2002 | Incumbent re-elected. |
|
| Georgia 12 | D+1 | John Barrow | Democratic | 2004 | Incumbent re-elected. |
|
| Georgia 13 | D+15 | David Scott | Democratic | 2002 | Incumbent re-elected. |
|
Hawaii

| District | Incumbent | Results | Candidates[84] | |||
|---|---|---|---|---|---|---|
| District | 2008 CPVI | Representative | Party | First elected | ||
| Hawaii 1 | D+11 | Charles Djou | Republican | 2010 (Special) | Incumbent lost re-election. New member elected. Democratic gain. |
|
| Hawaii 2 | D+14 | Mazie Hirono | Democratic | 2006 | Incumbent re-elected. |
|
Idaho

| District | Incumbent | Results | Candidates[85] | |||
|---|---|---|---|---|---|---|
| District | 2008 CPVI | Representative | Party | First elected | ||
| Idaho 1 | R+18 | Walt Minnick | Democratic | 2008 | Incumbent lost re-election. New member elected. Republican gain. |
|
| Idaho 2 | R+17 | Mike Simpson | Republican | 1998 | Incumbent re-elected. |
|
Illinois

| District | Incumbent | Results | Candidates | |||
|---|---|---|---|---|---|---|
| District | 2008 CPVI | Representative | Party | First elected | ||
| Illinois 1 | D+34 | Bobby Rush | Democratic | 1992 | Incumbent re-elected. |
|
| Illinois 2 | D+36 | Jesse Jackson Jr. | Democratic | 1995 | Incumbent re-elected. |
|
| Illinois 3 | D+11 | Dan Lipinski | Democratic | 2004 | Incumbent re-elected. |
|
| Illinois 4 | D+32 | Luis Gutiérrez | Democratic | 1992 | Incumbent re-elected. |
|
| Illinois 5 | D+19 | Michael Quigley | Democratic | 2009 | Incumbent re-elected. |
|
| Illinois 6 | EVEN | Peter Roskam | Republican | 2006 | Incumbent re-elected. |
|
| Illinois 7 | D+35 | Danny Davis | Democratic | 1996 | Incumbent re-elected. |
|
| Illinois 8 | R+1 | Melissa Bean | Democratic | 2004 | Incumbent lost re-election. New member elected. Republican gain. |
|
| Illinois 9 | D+20 | Jan Schakowsky | Democratic | 1998 | Incumbent re-elected. |
|
| Illinois 10 | D+6 | Mark Kirk | Republican | 2000 | Incumbent retired to run for U.S. Senator. New member elected. Republican hold. |
|
| Illinois 11 | R+1 | Debbie Halvorson | Democratic | 2008 | Incumbent lost re-election. New member elected. Republican gain. |
|
| Illinois 12 | D+3 | Jerry Costello | Democratic | 1988 | Incumbent re-elected. |
|
| Illinois 13 | R+1 | Judy Biggert | Republican | 1998 | Incumbent re-elected. |
|
| Illinois 14 | R+1 | Bill Foster | Democratic | 2008 | Incumbent lost re-election. New member elected. Republican gain. |
|
| Illinois 15 | R+6 | Tim Johnson | Republican | 2000 | Incumbent re-elected. |
|
| Illinois 16 | R+2 | Donald Manzullo | Republican | 1992 | Incumbent re-elected. |
|
| Illinois 17 | D+3 | Phil Hare | Democratic | 2006 | Incumbent lost re-election. New member elected. Republican gain. |
|
| Illinois 18 | R+6 | Aaron Schock | Republican | 2008 | Incumbent re-elected. |
|
| Illinois 19 | R+9 | John Shimkus | Republican | 1996 | Incumbent re-elected. |
|
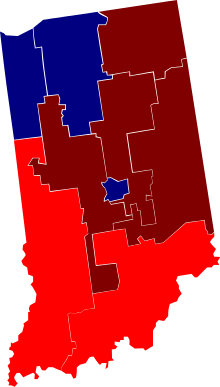
Indiana
| District | Incumbent | Results | Candidates[86] | |||
|---|---|---|---|---|---|---|
| District | 2008 CPVI | Representative | Party | First elected | ||
| Indiana 1 | D+8 | Pete Visclosky | Democratic | 1984 | Incumbent re-elected. |
|
| Indiana 2 | R+2 | Joe Donnelly | Democratic | 2006 | Incumbent re-elected. |
|
| Indiana 3 Special |
style="background-color:#FFB6B6" data-sort-value=14 | R+14 | Vacant since the May 18, 2010 resignation of Mark Souder (Republican) | A special election for the remainder of his term ending January 3, 2011 was held on the same day as the general election. New member elected. Republican hold. |
| ||
| Indiana 3 | New member elected. Republican hold. |
| ||||
| Indiana 4 | R+14 | Steve Buyer | Republican | 1992 | Incumbent retired. New member elected. Republican hold. |
|
| Indiana 5 | R+17 | Dan Burton | Republican | 1982 | Incumbent re-elected. |
|
| Indiana 6 | R+10 | Mike Pence | Republican | 2000 | Incumbent re-elected. |
|
| Indiana 7 | D+14 | André Carson | Democratic | 2008 | Incumbent re-elected. |
|
| Indiana 8 | R+8 | Brad Ellsworth | Democratic | 2006 | Incumbent retired to run for U.S. Senator. New member elected. Republican gain. |
|
| Indiana 9 | R+6 | Baron Hill | Democratic | 2006 | Incumbent lost re-election. New member elected. Republican gain. |
|
Iowa

| District | Incumbent | Results | Candidates[87] | |||
|---|---|---|---|---|---|---|
| District | 2008 CPVI | Representative | Party | First elected | ||
| Iowa 1 | D+5 | Bruce Braley | Democratic | 2006 | Incumbent re-elected. |
|
| Iowa 2 | D+7 | David Loebsack | Democratic | 2006 | Incumbent re-elected. |
|
| Iowa 3 | D+1 | Leonard Boswell | Democratic | 1996 | Incumbent re-elected. |
|
| Iowa 4 | EVEN | Tom Latham | Republican | 1994 | Incumbent re-elected. |
|
| Iowa 5 | R+9 | Steve King | Republican | 2002 | Incumbent re-elected. |
|
Kansas

| District | Incumbent | Results | Candidates[88] | |||
|---|---|---|---|---|---|---|
| District | 2008 CPVI | Representative | Party | First elected | ||
| Kansas 1 | R+23 | Jerry Moran | Republican | 1996 | Incumbent retired to run for U.S. Senator. New member elected. Republican hold. |
|
| Kansas 2 | R+9 | Lynn Jenkins | Republican | 2008 | Incumbent re-elected. |
|
| Kansas 3 | R+3 | Dennis Moore | Democratic | 1998 | Incumbent retired. New member elected. Republican gain. |
|
| Kansas 4 | R+14 | Todd Tiahrt | Republican | 1994 | Incumbent retired to run for U.S. Senator. New member elected. Republican hold. |
|
Kentucky

| District | Incumbent | Results | Candidates[89] | |||
|---|---|---|---|---|---|---|
| District | 2008 CPVI | Representative | Party | First elected | ||
| Kentucky 1 | R+15 | Ed Whitfield | Republican | 1994 | Incumbent re-elected. |
|
| Kentucky 2 | R+15 | Brett Guthrie | Republican | 2008 | Incumbent re-elected. |
|
| Kentucky 3 | D+2 | John Yarmuth | Democratic | 2006 | Incumbent re-elected. |
|
| Kentucky 4 | R+14 | Geoff Davis | Republican | 2004 | Incumbent re-elected. |
|
| Kentucky 5 | R+16 | Hal Rogers | Republican | 1980 | Incumbent re-elected. |
|
| Kentucky 6 | R+9 | Ben Chandler | Democratic | 2004 | Incumbent re-elected. |
|
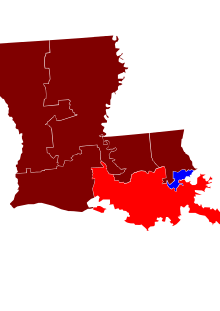
Louisiana
| District | Incumbent | Results | Candidates[90] | |||
|---|---|---|---|---|---|---|
| District | 2008 CPVI | Representative | Party | First elected | ||
| Louisiana 1 | R+24 | Steve Scalise | Republican | 2008 | Incumbent re-elected. |
|
| Louisiana 2 | D+25 | Joseph Cao | Republican | 2008 | Incumbent lost re-election. New member elected. Democratic gain. |
|
| Louisiana 3 | R+12 | Charlie Melancon | Democratic | 2004 | Incumbent retired to run for U.S. Senator. New member elected. Republican gain. |
|
| Louisiana 4 | R+11 | John Fleming | Republican | 2008 | Incumbent re-elected. |
|
| Louisiana 5 | R+14 | Rodney Alexander | Republican | 2002 | Incumbent re-elected. |
|
| Louisiana 6 | R+10 | Bill Cassidy | Republican | 2008 | Incumbent re-elected. |
|
| Louisiana 7 | R+14 | Charles Boustany | Republican | 2004 | Incumbent re-elected. |
|
Maine

| District | Incumbent | Results | Candidates[91] | |||
|---|---|---|---|---|---|---|
| District | 2008 CPVI | Representative | Party | First elected | ||
| Maine 1 | D+8 | Chellie Pingree | Democratic | 2008 | Incumbent re-elected. |
|
| Maine 2 | D+3 | Mike Michaud | Democratic | 2002 | Incumbent re-elected. |
|
Maryland
| District | Incumbent | Results | Candidates[92] | |||
|---|---|---|---|---|---|---|
| District | 2008 CPVI | Representative | Party | First elected | ||
| Maryland 1 | R+13 | Frank Kratovil | Democratic | 2008 | Incumbent lost re-election. New member elected. Republican gain. |
|
| Maryland 2 | D+7 | Dutch Ruppersberger | Democratic | 2002 | Incumbent re-elected. |
|
| Maryland 3 | D+6 | John Sarbanes | Democratic | 2006 | Incumbent re-elected. |
|
| Maryland 4 | D+31 | Donna Edwards | Democratic | 2008 | Incumbent re-elected. |
|
| Maryland 5 | D+11 | Steny Hoyer | Democratic | 1981 | Incumbent re-elected. |
|
| Maryland 6 | R+13 | Roscoe Bartlett | Republican | 1992 | Incumbent re-elected. |
|
| Maryland 7 | D+25 | Elijah Cummings | Democratic | 1996 | Incumbent re-elected. |
|
| Maryland 8 | D+21 | Chris Van Hollen Jr. | Democratic | 2002 | Incumbent re-elected. |
|
Massachusetts

| District | Incumbent | Results | Candidates[93] | |||
|---|---|---|---|---|---|---|
| District | 2008 CPVI | Representative | Party | First elected | ||
| Massachusetts 1 | D+14 | John Olver | Democratic | 1991 | Incumbent re-elected. |
|
| Massachusetts 2 | D+9 | Richard Neal | Democratic | 1988 | Incumbent re-elected. |
|
| Massachusetts 3 | D+9 | Jim McGovern | Democratic | 1996 | Incumbent re-elected. |
|
| Massachusetts 4 | D+14 | Barney Frank | Democratic | 1980 | Incumbent re-elected. |
|
| Massachusetts 5 | D+8 | Niki Tsongas | Democratic | 2007 | Incumbent re-elected. |
|
| Massachusetts 6 | D+7 | John Tierney | Democratic | 1996 | Incumbent re-elected. |
|
| Massachusetts 7 | D+15 | Ed Markey | Democratic | 1976 | Incumbent re-elected. |
|
| Massachusetts 8 | D+32 | Mike Capuano | Democratic | 1998 | Incumbent re-elected. |
|
| Massachusetts 9 | D+11 | Stephen Lynch | Democratic | 2001 | Incumbent re-elected. |
|
| Massachusetts 10 | D+5 | Bill Delahunt | Democratic | 1996 | Incumbent retired. New member elected. Democratic hold. |
|
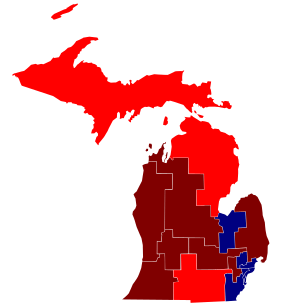
Michigan
| District | Incumbent | Results | Candidates[94] | |||
|---|---|---|---|---|---|---|
| District | 2008 CPVI | Representative | Party | First elected | ||
| Michigan 1 | R+3 | Bart Stupak | Democratic | 1992 | Incumbent retired. New member elected. Republican gain. |
|
| Michigan 2 | R+7 | Pete Hoekstra | Republican | 1992 | Incumbent retired to run for Governor of Michigan. New member elected. Republican hold. |
|
| Michigan 3 | R+6 | Vern Ehlers | Republican | 1993 | Incumbent retired. New member elected. Republican hold. |
|
| Michigan 4 | R+3 | Dave Camp | Republican | 1990 | Incumbent re-elected. |
|
| Michigan 5 | D+11 | Dale Kildee | Democratic | 1976 | Incumbent re-elected. |
|
| Michigan 6 | EVEN | Fred Upton | Republican | 1986 | Incumbent re-elected. |
|
| Michigan 7 | R+2 | Mark Schauer | Democratic | 2008 | Incumbent lost re-election. New member elected. Republican gain. |
|
| Michigan 8 | R+2 | Mike Rogers | Republican | 2000 | Incumbent re-elected. |
|
| Michigan 9 | D+2 | Gary Peters | Democratic | 2008 | Incumbent re-elected. |
|
| Michigan 10 | R+5 | Candice Miller | Republican | 2002 | Incumbent re-elected. |
|
| Michigan 11 | EVEN | Thad McCotter | Republican | 2002 | Incumbent re-elected. |
|
| Michigan 12 | D+12 | Sander Levin | Democratic | 1982 | Incumbent re-elected. |
|
| Michigan 13 | D+31 | Carolyn Kilpatrick | Democratic | 1996 | Incumbent lost renomination. New member elected. Democratic hold. |
|
| Michigan 14 | D+34 | John Conyers Jr. | Democratic | 1964 | Incumbent re-elected. |
|
| Michigan 15 | D+13 | John Dingell | Democratic | 1955 | Incumbent re-elected. |
|
Minnesota
| District | Incumbent | Results | Candidates[96] | |||
|---|---|---|---|---|---|---|
| District | 2008 CPVI | Representative | Party | First elected | ||
| Minnesota 1 | R+1 | Tim Walz | Democratic | 2006 | Incumbent re-elected. |
|
| Minnesota 2 | R+4 | John Kline | Republican | 2002 | Incumbent re-elected. |
|
| Minnesota 3 | EVEN | Erik Paulsen | Republican | 2008 | Incumbent re-elected. |
|
| Minnesota 4 | D+13 | Betty McCollum | Democratic | 2000 | Incumbent re-elected. |
|
| Minnesota 5 | D+23 | Keith Ellison | Democratic | 2006 | Incumbent re-elected. |
|
| Minnesota 6 | R+7 | Michele Bachmann | Republican | 2006 | Incumbent re-elected. |
|
| Minnesota 7 | R+5 | Collin Peterson | Democratic | 1990 | Incumbent re-elected. |
|
| Minnesota 8 | D+3 | Jim Oberstar | Democratic | 1974 | Incumbent lost re-election. New member elected. Republican gain. |
|
Mississippi
| District | Incumbent | Results | Candidates[97] | |||
|---|---|---|---|---|---|---|
| District | 2008 CPVI | Representative | Party | First elected | ||
| Mississippi 1 | R+14 | Travis Childers | Democratic | 2008 | Incumbent lost re-election. New member elected. Republican gain. |
|
| Mississippi 2 | D+12 | Bennie Thompson | Democratic | 1993 | Incumbent re-elected. |
|
| Mississippi 3 | R+15 | Gregg Harper | Republican | 2008 | Incumbent re-elected. |
|
| Mississippi 4 | R+20 | Gene Taylor | Democratic | 1989 | Incumbent lost re-election. New member elected. Republican gain. |
|
Missouri
| District | Incumbent | Results | Candidates[98] | |||
|---|---|---|---|---|---|---|
| District | 2008 CPVI | Representative | Party | First elected | ||
| Missouri 1 | D+27 | Lacy Clay | Democratic | 2000 | Incumbent re-elected. |
|
| Missouri 2 | R+9 | Todd Akin | Republican | 2000 | Incumbent re-elected. |
|
| Missouri 3 | D+7 | Russ Carnahan | Democratic | 2004 | Incumbent re-elected. |
|
| Missouri 4 | R+14 | Ike Skelton | Democratic | 1976 | Incumbent lost re-election. New member elected. Republican gain. |
|
| Missouri 5 | D+10 | Emanuel Cleaver | Democratic | 2004 | Incumbent re-elected. |
|
| Missouri 6 | R+7 | Sam Graves | Republican | 2000 | Incumbent re-elected. |
|
| Missouri 7 | R+17 | Roy Blunt | Republican | 1996 | Incumbent retired to run for U.S. Senator. New member elected. Republican hold. |
|
| Missouri 8 | R+15 | Jo Ann Emerson | Republican | 1996 | Incumbent re-elected. |
|
| Missouri 9 | R+9 | Blaine Luetkemeyer | Republican | 2008 | Incumbent re-elected. |
|
Montana

| District | Incumbent | Results | Candidates[99] | |||
|---|---|---|---|---|---|---|
| District | 2008 CPVI | Representative | Party | First elected | ||
| Montana at-large | R+7 | Denny Rehberg | Republican | 2000 | Incumbent re-elected. |
|
Nebraska
| District | Incumbent | Results | Candidates[100] | |||
|---|---|---|---|---|---|---|
| District | 2008 CPVI | Representative | Party | First elected | ||
| Nebraska 1 | R+11 | Jeff Fortenberry | Republican | 2004 | Incumbent re-elected. |
|
| Nebraska 2 | R+6 | Lee Terry | Republican | 1998 | Incumbent re-elected. | |
| Nebraska 3 | R+24 | Adrian Smith | Republican | 2006 | Incumbent re-elected. |
|
Nevada

| District | Incumbent | Results | Candidates[101] | |||
|---|---|---|---|---|---|---|
| District | 2008 CPVI | Representative | Party | First elected | ||
| Nevada 1 | D+10 | Shelley Berkley | Democratic | 1998 | Incumbent re-elected. |
|
| Nevada 2 | R+5 | Dean Heller | Republican | 2006 | Incumbent re-elected. |
|
| Nevada 3 | D+2 | Dina Titus | Democratic | 2008 | Incumbent lost re-election. New member elected. Republican gain. |
|
New Hampshire

| District | Incumbent | Results | Candidates[102] | |||
|---|---|---|---|---|---|---|
| District | 2008 CPVI | Representative | Party | First elected | ||
| New Hampshire 1 | EVEN | Carol Shea-Porter | Democratic | 2006 | Incumbent lost re-election. New member elected. Republican gain. |
|
| New Hampshire 2 | D+3 | Paul Hodes | Democratic | 2006 | Incumbent retired to run for U.S. Senator. New member elected. Republican gain. |
|
New Jersey

| District | Incumbent | Results | Candidates[103] | |||
|---|---|---|---|---|---|---|
| District | 2008 CPVI | Representative | Party | First elected | ||
| New Jersey 1 | D+12 | Rob Andrews | Democratic | 1990 | Incumbent re-elected. |
|
| New Jersey 2 | D+1 | Frank LoBiondo | Republican | 1994 | Incumbent re-elected. |
|
| New Jersey 3 | R+1 | John Adler | Democratic | 2008 | Incumbent lost re-election. New member elected. Republican gain. |
|
| New Jersey 4 | R+6 | Chris Smith | Republican | 1980 | Incumbent re-elected. |
|
| New Jersey 5 | R+7 | Scott Garrett | Republican | 2002 | Incumbent re-elected. |
|
| New Jersey 6 | D+8 | Frank Pallone | Democratic | 1988 | Incumbent re-elected. |
|
| New Jersey 7 | R+3 | Leonard Lance | Republican | 2008 | Incumbent re-elected. |
|
| New Jersey 8 | D+10 | Bill Pascrell | Democratic | 1996 | Incumbent re-elected. |
|
| New Jersey 9 | D+9 | Steve Rothman | Democratic | 1996 | Incumbent re-elected. |
|
| New Jersey 10 | D+33 | Don Payne | Democratic | 1988 | Incumbent re-elected. |
|
| New Jersey 11 | R+7 | Rodney Frelinghuysen | Republican | 1994 | Incumbent re-elected. |
|
| New Jersey 12 | D+5 | Rush Holt Jr. | Democratic | 1998 | Incumbent re-elected. |
|
| New Jersey 13 | D+21 | Albio Sires | Democratic | 2006 | Incumbent re-elected. |
|
New Mexico

| District | Incumbent | Results | Candidates[104] | |||
|---|---|---|---|---|---|---|
| District | 2008 CPVI | Representative | Party | First elected | ||
| New Mexico 1 | D+5 | Martin Heinrich | Democratic | 2008 | Incumbent re-elected. |
|
| New Mexico 2 | R+6 | Harry Teague | Democratic | 2008 | Incumbent lost re-election. New member elected. Republican gain. |
|
| New Mexico 3 | D+7 | Ben Lujan | Democratic | 2008 | Incumbent re-elected. |
|
New York
| District | Incumbent | Results | Candidates[105] | |||
|---|---|---|---|---|---|---|
| District | 2008 CPVI | Representative | Party | First elected | ||
| New York 1 | EVEN | Tim Bishop | Democratic | 2002 | Incumbent re-elected. |
|
| New York 2 | D+4 | Steve Israel | Democratic | 2000 | Incumbent re-elected. |
|
| New York 3 | R+4 | Peter King | Republican | 1992 | Incumbent re-elected. |
|
| New York 4 | D+6 | Carolyn McCarthy | Democratic | 1996 | Incumbent re-elected. |
|
| New York 5 | D+12 | Gary Ackerman | Democratic | 1983 | Incumbent re-elected. |
|
| New York 6 | D+36 | Gregory Meeks | Democratic | 1998 | Incumbent re-elected. |
|
| New York 7 | D+26 | Joseph Crowley | Democratic | 1998 | Incumbent re-elected. |
|
| New York 8 | D+22 | Jerrold Nadler | Democratic | 1992 | Incumbent re-elected. |
|
| New York 9 | D+5 | Anthony Weiner | Democratic | 1998 | Incumbent re-elected. |
|
| New York 10 | D+38 | Ed Towns | Democratic | 1982 | Incumbent re-elected. |
|
| New York 11 | D+38 | Yvette Clarke | Democratic | 2006 | Incumbent re-elected. |
|
| New York 12 | D+33 | Nydia Velázquez | Democratic | 1992 | Incumbent re-elected. |
|
| New York 13 | R+4 | Michael McMahon | Democratic | 2008 | Incumbent lost re-election. New member elected. Republican gain. |
|
| New York 14 | D+26 | Carolyn Maloney | Democratic | 1992 | Incumbent re-elected. |
|
| New York 15 | D+41 | Charles Rangel | Democratic | 1970 | Incumbent re-elected. |
|
| New York 16 | D+41 | José Serrano | Democratic | 1990 | Incumbent re-elected. |
|
| New York 17 | D+18 | Eliot Engel | Democratic | 1988 | Incumbent re-elected. |
|
| New York 18 | D+9 | Nita Lowey | Democratic | 1988 | Incumbent re-elected. |
|
| New York 19 | R+3 | John Hall | Democratic | 2006 | Incumbent lost re-election. New member elected. Republican gain. |
|
| New York 20 | R+2 | Scott Murphy | Democratic | 2009 | Incumbent lost re-election. New member elected. Republican gain. |
|
| New York 21 | D+6 | Paul Tonko | Democratic | 2008 | Incumbent re-elected. |
|
| New York 22 | D+6 | Maurice Hinchey | Democratic | 1992 | Incumbent re-elected. |
|
| New York 23 | R+1 | Bill Owens | Democratic | 2009 | Incumbent re-elected. |
|
| New York 24 | R+2 | Mike Arcuri | Democratic | 2006 | Incumbent lost re-election. New member elected. Republican gain. |
|
| New York 25 | D+3 | Dan Maffei | Democratic | 2008 | Incumbent lost re-election. New member elected. Republican gain. |
|
| New York 26 | R+6 | Chris Lee | Republican | 2008 | Incumbent re-elected. |
|
| New York 27 | D+4 | Brian Higgins | Democratic | 2004 | Incumbent re-elected. |
|
| New York 28 | D+15 | Louise Slaughter | Democratic | 1986 | Incumbent re-elected. |
|
| New York 29 | R+5 | Vacant | Republican gain |
| ||
- Democrat Eric Massa resigned on March 8, 2010. A special election for the remainder of his term in the 111th Congress was held on the same day as the general election, which Reed won.
North Carolina
| District | Incumbent | Results | Candidates[106] | |||
|---|---|---|---|---|---|---|
| District | 2008 CPVI | Representative | Party | First elected | ||
| North Carolina 1 | D+9 | G. K. Butterfield | Democratic | 2004 | Incumbent re-elected. |
|
| North Carolina 2 | R+2 | Bob Etheridge | Democratic | 1996 | Incumbent lost re-election. New member elected. Republican gain. |
|
| North Carolina 3 | R+16 | Walter Jones Jr. | Republican | 1994 | Incumbent re-elected. |
|
| North Carolina 4 | D+8 | David Price | Democratic | 1996 | Incumbent re-elected. |
|
| North Carolina 5 | R+15 | Virginia Foxx | Republican | 2004 | Incumbent re-elected. |
|
| North Carolina 6 | R+18 | Howard Coble | Republican | 1984 | Incumbent re-elected. |
|
| North Carolina 7 | R+5 | Mike McIntyre | Democratic | 1996 | Incumbent re-elected. |
|
| North Carolina 8 | R+2 | Larry Kissell | Democratic | 2008 | Incumbent re-elected. |
|
| North Carolina 9 | R+11 | Sue Myrick | Republican | 1994 | Incumbent re-elected. |
|
| North Carolina 10 | R+17 | Patrick McHenry | Republican | 2004 | Incumbent re-elected. |
|
| North Carolina 11 | R+6 | Heath Shuler | Democratic | 2006 | Incumbent re-elected. |
|
| North Carolina 12 | D+16 | Mel Watt | Democratic | 1992 | Incumbent re-elected. |
|
| North Carolina 13 | D+5 | Brad Miller | Democratic | 2002 | Incumbent re-elected. |
|
North Dakota

| District | Incumbent | Results | Candidates[107] | |||
|---|---|---|---|---|---|---|
| District | 2008 CPVI | Representative | Party | First elected | ||
| North Dakota at-large | R+10 | Earl Pomeroy | Democratic-NPL | 1992 | Incumbent lost re-election. New member elected. Republican gain. |
|
Ohio
| District | Incumbent | Results | Candidates | |||
|---|---|---|---|---|---|---|
| District | 2008 CPVI | Representative | Party | First elected[108] | ||
| Ohio 1 | D+1 | Steve Driehaus | Democratic | 2008 | Incumbent lost re-election. New member elected. Republican gain. |
|
| Ohio 2 | R+13 | Jean Schmidt | Republican | 2005 | Incumbent re-elected. |
|
| Ohio 3 | R+5 | Mike Turner | Republican | 2002 | Incumbent re-elected. |
|
| Ohio 4 | R+15 | Jim Jordan | Republican | 2006 | Incumbent re-elected. |
|
| Ohio 5 | R+9 | Bob Latta | Republican | 2007 | Incumbent re-elected. |
|
| Ohio 6 | R+2 | Charlie Wilson | Democratic | 2006 | Incumbent lost re-election. New member elected. Republican gain. |
|
| Ohio 7 | R+7 | Steve Austria | Republican | 2008 | Incumbent re-elected. |
|
| Ohio 8 | R+14 | John Boehner | Republican | 1990 | Incumbent re-elected. |
|
| Ohio 9 | D+10 | Marcy Kaptur | Democratic | 1982 | Incumbent re-elected. |
|
| Ohio 10 | D+8 | Dennis Kucinich | Democratic | 1996 | Incumbent re-elected. |
|
| Ohio 11 | D+32 | Marcia Fudge | Democratic | 2008 | Incumbent re-elected. |
|
| Ohio 12 | D+1 | Pat Tiberi | Republican | 2000 | Incumbent re-elected. |
|
| Ohio 13 | D+5 | Betty Sutton | Democratic | 2006 | Incumbent re-elected. |
|
| Ohio 14 | R+3 | Steve LaTourette | Republican | 1994 | Incumbent re-elected. |
|
| Ohio 15 | D+1 | Mary Jo Kilroy | Democratic | 2008 | Incumbent lost re-election. New member elected. Republican gain. |
|
| Ohio 16 | R+4 | John Boccieri | Democratic | 2008 | Incumbent lost re-election. New member elected. Republican gain. |
|
| Ohio 17 | D+12 | Tim Ryan | Democratic | 2002 | Incumbent re-elected. |
|
| Ohio 18 | R+7 | Zack Space | Democratic | 2006 | Incumbent lost re-election. New member elected. Republican gain. |
|
Oklahoma

| District | Incumbent | Results | Candidates[109] | |||
|---|---|---|---|---|---|---|
| District | 2008 CPVI | Representative | Party | First elected | ||
| Oklahoma 1 | R+16 | John Sullivan | Republican | 2002 | Incumbent re-elected. |
|
| Oklahoma 2 | R+14 | Dan Boren | Democratic | 2004 | Incumbent re-elected. |
|
| Oklahoma 3 | R+24 | Frank Lucas | Republican | 1994 | Incumbent re-elected. |
|
| Oklahoma 4 | R+18 | Tom Cole | Republican | 2002 | Incumbent re-elected. |
|
| Oklahoma 5 | R+13 | Mary Fallin | Republican | 2006 | Incumbent retired to run for Governor of Oklahoma. New member elected. Republican hold. |
|
Oregon

| District | Incumbent | Results | Candidates[110] | |||
|---|---|---|---|---|---|---|
| District | 2008 CPVI | Representative | Party | First elected | ||
| Oregon 1 | D+8 | David Wu | Democratic | 1998 | Incumbent re-elected. |
|
| Oregon 2 | R+10 | Greg Walden | Republican | 1998 | Incumbent re-elected. |
|
| Oregon 3 | D+19 | Earl Blumenauer | Democratic | 1996 | Incumbent re-elected. |
|
| Oregon 4 | D+2 | Peter DeFazio | Democratic | 1986 | Incumbent re-elected. |
|
| Oregon 5 | D+1 | Kurt Schrader | Democratic | 2008 | Incumbent re-elected. |
|
Pennsylvania
| District | Incumbent | Results | Candidates[111] | |||
|---|---|---|---|---|---|---|
| District | 2008 CPVI | Representative | Party | First elected | ||
| Pennsylvania 1 | D+35 | Bob Brady | Democratic | 1998 | Incumbent re-elected. |
|
| Pennsylvania 2 | D+38 | Chaka Fattah | Democratic | 1994 | Reelected |
|
| Pennsylvania 3 | R+3 | Kathy Dahlkemper | Democratic | 2008 | Incumbent lost reelection. New member elected. Republican gain. |
|
| Pennsylvania 4 | R+6 | Jason Altmire | Democratic | 2006 | Reelected |
|
| Pennsylvania 5 | R+9 | G.T. Thompson | Republican | 2008 | Reelected |
|
| Pennsylvania 6 | D+4 | Jim Gerlach | Republican | 2002 | Reelected |
|
| Pennsylvania 7 | D+3 | Joe Sestak | Democratic | 2006 | Incumbent retired to run for U.S. Senator. New member elected. Republican gain. |
|
| Pennsylvania 8 | D+2 | Patrick Murphy | Democratic | 2006 | Incumbent lost reelection. New member elected. Republican gain. |
|
| Pennsylvania 9 | R+17 | Bill Shuster | Republican | 2001 | Reelected |
|
| Pennsylvania 10 | R+8 | Chris Carney | Democratic | 2006 | Incumbent lost reelection. New member elected. Republican gain. |
|
| Pennsylvania 11 | D+4 | Paul Kanjorski | Democratic | 1984 | Incumbent lost reelection. New member elected. Republican gain. |
|
| Pennsylvania 12 | R+1 | Mark Critz | Democratic | 2010 | Reelected |
|
| Pennsylvania 13 | D+7 | Allyson Schwartz | Democratic | 2004 | Reelected |
|
| Pennsylvania 14 | D+19 | Mike Doyle | Democratic | 1994 | Reelected |
|
| Pennsylvania 15 | D+2 | Charlie Dent | Republican | 2004 | Reelected |
|
| Pennsylvania 16 | R+8 | Joe Pitts | Republican | 1996 | Reelected | |
| Pennsylvania 17 | R+6 | Tim Holden | Democratic | 1992 | Reelected |
|
| Pennsylvania 18 | R+6 | Tim Murphy | Republican | 2002 | Reelected |
|
| Pennsylvania 19 | R+12 | Todd Platts | Republican | 2000 | Reelected |
|
Rhode Island
| District | Incumbent | Results | Candidates[112] | |||
|---|---|---|---|---|---|---|
| District | 2008 CPVI | Representative | Party | First elected | ||
| Rhode Island 1 | D+13 | Patrick Kennedy | Democratic | 1994 | Incumbent retired. New member elected. Democratic hold. |
|
| Rhode Island 2 | D+9 | Jim Langevin | Democratic | 2000 | Reelected |
|
South Carolina
| District | Incumbent | Results | Candidates[113] | |||
|---|---|---|---|---|---|---|
| District | 2008 CPVI | Representative | Party | First elected | ||
| South Carolina 1 | R+10 | Henry E. Brown Jr. | Republican | 2000 | Incumbent retired. New member elected. Republican hold. |
|
| South Carolina 2 | R+9 | Joe Wilson | Republican | 2001 | Reelected |
|
| South Carolina 3 | R+17 | J. Gresham Barrett | Republican | 2002 | Incumbent retired to run for Governor of South Carolina. New member elected. Republican hold. |
|
| South Carolina 4 | R+15 | Bob Inglis | Republican | 2004 | Incumbent lost renomination. New member elected. Republican hold. |
|
| South Carolina 5 | R+7 | John Spratt | Democratic | 1982 | Incumbent lost reelection. New member elected. Republican gain. |
|
| South Carolina 6 | D+12 | Jim Clyburn | Democratic | 1992 | Reelected |
|
South Dakota

| District | Incumbent | Results | Candidates[114] | |||
|---|---|---|---|---|---|---|
| District | 2008 CPVI | Representative | Party | First elected | ||
| South Dakota at-large | R+9 | Stephanie Herseth Sandlin | Democratic | 2004 | Incumbent lost reelection. New member elected. Republican gain. |
|
Tennessee

| District | Incumbent | Results | Candidates[115] | |||
|---|---|---|---|---|---|---|
| District | 2008 CPVI | Representative | Party | First elected | ||
| Tennessee 1 | R+21 | Phil Roe | Republican | 2008 | Reelected |
|
| Tennessee 2 | R+16 | Jimmy Duncan | Republican | 1998 | Reelected |
|
| Tennessee 3 | R+13 | Zach Wamp | Republican | 1994 | Incumbent retired to run for Governor of Tennessee. New member elected. Republican hold. |
|
| Tennessee 4 | R+13 | Lincoln Davis | Democratic | 2002 | Incumbent lost reelection. New member elected. Republican gain. |
|
| Tennessee 5 | D+3 | Jim Cooper | Democratic | 2002 | Reelected |
|
| Tennessee 6 | R+13 | Bart Gordon | Democratic | 1984 | Incumbent retired. New member elected. Republican gain. |
|
| Tennessee 7 | R+18 | Marsha Blackburn | Republican | 2002 | Reelected |
|
| Tennessee 8 | R+6 | John Tanner | Democratic | 1988 | Incumbent retired. New member elected. Republican gain. |
|
| Tennessee 9 | D+23 | Steve Cohen | Democratic | 2006 | Reelected |
|
Texas
| District | Incumbent | Results | Candidates[116] | |||
|---|---|---|---|---|---|---|
| District | 2008 CPVI | Representative | Party | First elected | ||
| Texas 1 | R+21 | Louie Gohmert | Republican | 2004 | Reelected |
|
| Texas 2 | R+13 | Ted Poe | Republican | 2004 | Reelected |
|
| Texas 3 | R+14 | Sam Johnson | Republican | 1991 | Reelected |
|
| Texas 4 | R+21 | Ralph Hall | Republican | 1980 | Reelected |
|
| Texas 5 | R+17 | Jeb Hensarling | Republican | 2002 | Reelected |
|
| Texas 6 | R+15 | Joe Barton | Republican | 1984 | Reelected |
|
| Texas 7 | R+13 | John Culberson | Republican | 2000 | Reelected |
|
| Texas 8 | R+25 | Kevin Brady | Republican | 1996 | Reelected |
|
| Texas 9 | D+22 | Al Green | Democratic | 2004 | Reelected |
|
| Texas 10 | R+10 | Michael McCaul | Republican | 2004 | Reelected |
|
| Texas 11 | R+28 | Mike Conaway | Republican | 2004 | Reelected |
|
| Texas 12 | R+16 | Kay Granger | Republican | 1996 | Reelected |
|
| Texas 13 | R+29 | Mac Thornberry | Republican | 1994 | Reelected |
|
| Texas 14 | R+18 | Ron Paul | Republican | 1996 | Reelected |
|
| Texas 15 | D+3 | Ruben Hinojosa | Democratic | 1996 | Reelected |
|
| Texas 16 | D+10 | Silvestre Reyes | Democratic | 1996 | Reelected |
|
| Texas 17 | R+20 | Chet Edwards | Democratic | 1990 | Incumbent lost reelection. New member elected. Republican gain. |
|
| Texas 18 | D+24 | Sheila Jackson Lee | Democratic | 1994 | Reelected |
|
| Texas 19 | R+26 | Randy Neugebauer | Republican | 2002 | Reelected |
|
| Texas 20 | D+8 | Charlie Gonzalez | Democratic | 1998 | Reelected |
|
| Texas 21 | R+14 | Lamar Smith | Republican | 1986 | Reelected |
|
| Texas 22 | R+13 | Pete Olson | Republican | 2008 | Reelected |
|
| Texas 23 | R+4 | Ciro Rodriguez | Democratic | 2006 | Incumbent lost reelection. New member elected. Republican gain. |
|
| Texas 24 | R+11 | Kenny Marchant | Republican | 2004 | Reelected |
|
| Texas 25 | D+6 | Lloyd Doggett | Democratic | 1994 | Reelected |
|
| Texas 26 | R+13 | Michael Burgess | Republican | 2002 | Reelected |
|
| Texas 27 | R+2 | Solomon Ortiz | Democratic | 1982 | Incumbent lost reelection. New member elected. Republican gain. |
|
| Texas 28 | EVEN | Henry Cuellar | Democratic | 2004 | Reelected |
|
| Texas 29 | D+8 | Gene Green | Democratic | 1992 | Reelected |
|
| Texas 30 | D+27 | Eddie Bernice Johnson | Democratic | 1992 | Reelected |
|
| Texas 31 | R+14 | John Carter | Republican | 2002 | Reelected |
|
| Texas 32 | R+8 | Pete Sessions | Republican | 1996 | Reelected |
|
Utah

| District | Incumbent | Results | Candidates[117] | |||
|---|---|---|---|---|---|---|
| District | 2008 CPVI | Representative | Party | First elected | ||
| Utah 1 | R+21 | Rob Bishop | Republican | 2002 | Reelected |
|
| Utah 2 | R+15 | Jim Matheson | Democratic | 2000 | Reelected |
|
| Utah 3 | R+26 | Jason Chaffetz | Republican | 2008 | Reelected |
|
Vermont

| District | Incumbent | Results | Candidates[118] | |||
|---|---|---|---|---|---|---|
| District | 2008 CPVI | Representative | Party | First elected | ||
| Vermont at-large | D+13 | Peter Welch | Democratic | 2006 | Reelected |
|
Virginia
| District | Incumbent | Results | Candidates[119] | |||
|---|---|---|---|---|---|---|
| District | 2008 CPVI | Representative | Party | First elected | ||
| Virginia 1 | R+7 | Rob Wittman | Republican | 2007 | Reelected |
|
| Virginia 2 | R+5 | Glenn Nye | Democratic | 2008 | Incumbent lost reelection. New member elected. Republican gain. |
|
| Virginia 3 | D+20 | Bobby Scott | Democratic | 1992 | Reelected |
|
| Virginia 4 | R+4 | Randy Forbes | Republican | 2001 | Reelected |
|
| Virginia 5 | R+5 | Tom Perriello | Democratic | 2008 | Incumbent lost reelection. New member elected. Republican gain. |
|
| Virginia 6 | R+12 | Bob Goodlatte | Republican | 1992 | Reelected |
|
| Virginia 7 | R+9 | Eric Cantor | Republican | 2000 | Reelected |
|
| Virginia 8 | D+16 | Jim Moran | Democratic | 1990 | Reelected |
|
| Virginia 9 | R+11 | Rick Boucher | Democratic | 1982 | Incumbent lost reelection. New member elected. Republican gain. |
|
| Virginia 10 | R+2 | Frank Wolf | Republican | 1980 | Reelected |
|
| Virginia 11 | D+2 | Gerry Connolly | Democratic | 2008 | Reelected |
|
Washington

| District | Incumbent | Results | Candidates[120] | |||
|---|---|---|---|---|---|---|
| District | 2008 CPVI | Representative | Party | First elected | ||
| Washington 1 | D+9 | Jay Inslee | Democratic | 1998 | Reelected |
|
| Washington 2 | D+3 | Rick Larsen | Democratic | 2000 | Reelected |
|
| Washington 3 | EVEN | Brian Baird | Democratic | 1998 | Incumbent retired. New member elected. Republican gain. |
|
| Washington 4 | R+13 | Doc Hastings | Republican | 1994 | Reelected |
|
| Washington 5 | R+7 | Cathy McMorris Rodgers | Republican | 2004 | Reelected |
|
| Washington 6 | D+5 | Norm Dicks | Democratic | 1976 | Reelected |
|
| Washington 7 | D+31 | Jim McDermott | Democratic | 1988 | Reelected |
|
| Washington 8 | D+3 | Dave Reichert | Republican | 2004 | Reelected |
|
| Washington 9 | D+5 | Adam Smith | Democratic | 1996 | Reelected |
|
West Virginia
| District | Incumbent | Results | Candidates[121] | |||
|---|---|---|---|---|---|---|
| District | 2008 CPVI | Representative | Party | First elected | ||
| West Virginia 1 | R+9 | Alan Mollohan | Democratic | 1982 | Incumbent lost renomination. New member elected. Republican gain. |
|
| West Virginia 2 | R+8 | Shelley Capito | Republican | 2000 | Reelected |
|
| West Virginia 3 | R+6 | Nick Rahall | Democratic | 1976 | Reelected |
|
Wisconsin
| District | Incumbent | Results | Candidates[122] | |||
|---|---|---|---|---|---|---|
| District | 2008 CPVI | Representative | Party | First elected | ||
| Wisconsin 1 | R+2 | Paul Ryan | Republican | 1998 | Reelected |
|
| Wisconsin 2 | D+15 | Tammy Baldwin | Democratic | 1998 | Reelected |
|
| Wisconsin 3 | D+4 | Ron Kind | Democratic | 1996 | Reelected |
|
| Wisconsin 4 | D+22 | Gwen Moore | Democratic | 2004 | Reelected |
|
| Wisconsin 5 | R+12 | Jim Sensenbrenner | Republican | 1978 | Reelected |
|
| Wisconsin 6 | R+4 | Tom Petri | Republican | 1979 | Reelected |
|
| Wisconsin 7 | D+3 | Dave Obey | Democratic | 1969 | Incumbent retired. New member elected. Republican gain. |
|
| Wisconsin 8 | R+2 | Steve Kagen | Democratic | 2006 | Incumbent lost reelection. New member elected. Republican gain. |
|
Wyoming

| District | Incumbent | Results | Candidates[123] | |||
|---|---|---|---|---|---|---|
| District | 2008 CPVI | Representative | Party | First elected | ||
| Wyoming at-large | R+20 | Cynthia Lummis | Republican | 2008 | Reelected |
|
Non-voting delegates
The House of Representatives includes five Delegates from the District of Columbia and outlying territories elected to two-year terms and one Resident Commissioner of Puerto Rico elected to a four-year term (for which the last election was held in 2008, so the seat was not up for reelection in 2010). These delegates are not allowed to vote on the floor of the House of Representatives.
| District | Incumbent | Results | Candidates | |||
|---|---|---|---|---|---|---|
| District | 2008 CPVI | Representative | Party | First elected | ||
| American Samoa at-large | [data unknown/missing] | Eni Faleomavaega | Democratic | 1988 | Reelected |
|
| District of Columbia at-large | [data unknown/missing] | Eleanor Holmes Norton | Democratic | 1990 | Reelected |
|
| Guam at-large | [data unknown/missing] | Madeleine Bordallo | Democratic | 2002 | Reelected |
|
| Northern Mariana Islands at-large | [data unknown/missing] | Gregorio Sablan | Independent | 2008 | Reelected |
|
| U.S. Virgin Islands | [data unknown/missing] | Donna Christian-Christensen | Democratic | 1996 | Reelected |
|
See also
Notes
- The nonvoting delegates represent the District of Columbia; the territories of American Samoa, Guam, and the Virgin Islands; and the commonwealths of the Northern Mariana Islands and Puerto Rico, see 48 U.S.C. § 16. They are all chosen biennially except for Puerto Rico's delegate, who is elected every four years, and next faced reelection in 2012.
References
- McDonald, Michael (January 28, 2011). "2010 General Election Turnout Rates". United States Election Project. George Mason University. Archived from the original on July 22, 2013. Retrieved September 23, 2011.
- Hooper, Molly K. (November 17, 2010). "Boehner favored as 61st House Speaker on his 61st birthday". The Hill. Retrieved November 28, 2010.
- "House Democrats keep Nancy Pelosi as their leader". WTOP-FM. Associated Press. November 17, 2010. Retrieved November 28, 2010.
- Miller, Lorraine C. (July 10, 2009). "Statistics of the Presidential and Congressional Election of November 4, 2008" (PDF). Office of the Clerk. U.S. House of Representatives. Retrieved September 23, 2011.
- Haas, Karen L. (June 3, 2011). "Statistics of the Congressional Election of November 2, 2010" (PDF). Office of the Clerk. U.S. House of Representatives. Retrieved September 23, 2011.
- "Boehner Must Navigate Around Senate, Obama – And Tea Party". National Journal. November 3, 2010. Archived from the original on November 4, 2010. Retrieved November 4, 2010.
- "Heartland Headache". National Journal. November 4, 2010. Archived from the original on November 25, 2010. Retrieved November 24, 2010.
- "Republicans capture control of House". CNN. November 3, 2010. Retrieved April 9, 2014.
- The 2010 Midterm Election in Perspective November 10, 2010. Commentary.
- Catherine Dodge and Lisa Lerer (November 2, 2010). "Democrats Face Biggest House Midterm Defeat in Years". Bloomberg. Retrieved March 11, 2014.
- "Midterms 2010: What you need to know". Washington Post. Retrieved March 11, 2014.
- Kate Pickert (November 2, 2010). "Mixed Results on the Health Reform Referendum". TIME. Retrieved March 11, 2014.
- "CQ Politics | Presidential and House election 08 results by congressional district". Innovation.cq.com. Archived from the original on July 8, 2011. Retrieved July 28, 2009.
- "After the Wave > Publications >". National Affairs. November 2, 2010. Retrieved March 7, 2012.
- Drake, Bruce. "Republicans Score Big in the States and Win Leg Up on Redistricting". Politicsdaily.com. Retrieved March 7, 2012.
- Map of Post 2010 Election Partisan Composition of State Legislatures: Republicans Make Historic Gains, National Conference of State Legislatures.
- Dan Balz, The GOP takeover in the states, Washington Post (November 13, 2010).
- Paul R Abramson, John H Aldrich and David W Rohde, Change and Continuity in the 2008 and 2010 Elections (2011)
- "The long goodbye". The Economist. November 11, 2010. Retrieved July 17, 2019.https://www.economist.com/united-states/2010/11/11/the-long-goodbye
- "Senate, House, Governor Races - Election Center 2010 - Elections & Politics from CNN.com". CNN. Retrieved January 31, 2018.
- Charles J. Dean (February 1, 2009). "Alabama U.S. Rep. Artur Davis set to launch run for governor". The Birmingham News. Retrieved February 2, 2009.
- "Arkansas Congressman Berry to Retire". Fox News. January 25, 2010. Retrieved November 24, 2010.
- John Lyon (January 15, 2010). "Snyder won't seek reelection". Arkansas News. Retrieved January 20, 2010.
- Decker, Cathleen (February 14, 2010). "Diane Watson's retirement inspires a look back". Los Angeles Times. Retrieved September 13, 2010.
- "Florida Rep. Kendrick Meek considers Senate run". The Hill. January 12, 2009. Retrieved January 12, 2009.
- "Kan. Congressman Moore won't seek re-election". WFAA. Associated Press. November 24, 2009. Archived from the original on December 1, 2011. Retrieved November 24, 2010.
- "Melancon running against Vitter". Politico. August 27, 2009.
- "Rep Bill Delahunt won't run for re-election". Widgets.onesite.com. Retrieved June 14, 2010.
- Kraushaar, Allen (April 9, 2010). "Rep. Bart Stupak won't seek reelection". Politico.
- John Distaso (February 3, 2009). "In 2010, Rep. Hodes will run for U.S. Senate". Union Leader. Archived from the original on May 22, 2011. Retrieved February 3, 2009.
- "Rep. Sestak to take on Sen. Specter". The Hill.
- "Patrick Kennedy Won't Run for Re-Election". CBS News. Associated Press. February 11, 2010. Retrieved November 24, 2010.
- Josh Kraushaar (December 14, 2009). "Bart Gordon retiring". Politico. Retrieved December 15, 2009.
When I was elected, I was the youngest member of the Tennessee congressional delegation; now, I'm one of the oldest. In fact, I have members of my staff who weren't even born when I took office. That tells me it's time for a new chapter.
- Ken Whitehouse and A.C. Kleinheider (December 1, 2009). "Tanner to retire". NashvillePost.com.
- Reid Wilson and Tim Sahd (December 9, 2009). "Baird Retires; GOP Lands Solid Recruit". The National Journal: Hotline On Call. Archived from the original on December 13, 2009. Retrieved December 10, 2009.
- "Retiring congressman: 'Frankly, I am bone tired'". CNN. May 5, 2010. Retrieved May 26, 2010.
- "David Obey heading to K Street". Politico. June 3, 2011. Retrieved June 3, 2011.
- Aaron Blake and Molly Hopper (January 14, 2010). "Shadegg to retire". The Hill. Retrieved February 4, 2010.
- Josh Kraushaar (December 29, 2009). "Radanovich retiring". Politico. Retrieved January 18, 2010.
- Kraushaar, Josh (October 6, 2009). "Mike Castle announces run for Joe Biden's Seat". Politico. Retrieved November 24, 2010.
- Cillizza, Chris (April 30, 2010). "Florida Republican Rep. Ginny Brown-Waite Retires". The Washington Post.
- "Rep. Putnam will not seek reelection". TheHill.com. Retrieved July 28, 2009.
- Miller, Sean J.; Blake, Aaron (February 11, 2010). "Mario Díaz-Balart confirms switch, will run for his brother's House seat". The Hill. Retrieved February 28, 2010.
- Bob Keefe; Jim Galloway (February 27, 2010). "U.S. Rep. Linder will not seek re-election". The Atlanta Journal-Constitution. Archived from the original on March 1, 2010. Retrieved February 28, 2010.
- "Rep. Kirk to run for Senate". The Hill. July 8, 2009.
- Schneider, Mary Beth (January 29, 2010). "Buyer to retire due to wife's illness". The Indianapolis Star.
- Hanna, John (November 3, 2010). "U.S. Senate seat goes to Jerry Moran". The Wichita Eagle. Associated Press. Archived from the original on November 6, 2010. Retrieved November 24, 2010.
- Jeffrey Young (January 31, 2009). "Kansan Tiahrt makes Senate bid official". The Hill. Retrieved January 31, 2009.
- Emily Cadei (March 27, 2009). "Hoekstra to Announce Entry to Michigan Governor's Race". CQ Politics. Retrieved March 27, 2009.
- Kiely, Eugene (February 10, 2010). "Rep. Ehlers, a moderate Republican, announces retirement". USA Today.
- "The Scorecard: 2008 Congressional campaign news and analysis". Politico. Retrieved July 28, 2009.
- Michael McNutt (February 28, 2009). "U.S. Rep Mary Fallin confirms decision to run for Oklahoma governor in 2010". NewsOK. Retrieved February 28, 2009.
- Martin, Jonathan (January 4, 2010). "Henry Brown Retiring". Politico. Retrieved November 24, 2010.
- "Rep. Barrett to run for S.C. governor". The Hill. Retrieved July 28, 2009.
- "Tennessee: Wamp touts poll saying he's top GOP pick for governor". Chattanooga Times Free Press. Archived from the original on August 23, 2010. Retrieved July 28, 2009.
- "Election 2010: All House Races". CBS News. November 3, 2010. Retrieved November 3, 2010.
- "Battle For The House". Realclearpolitics.com. Retrieved November 4, 2010.
- Silver, Nate (October 31, 2010). "The Ultimate Hour-by-Hour, District-by-District Election Guide". Fivethirtyeight.blogs.nytimes.com. Retrieved November 4, 2010.
- Ishmael, Patrick (October 31, 2010). "Game Time: Final House rankings and printable cheat sheet". Hot Air. Retrieved November 24, 2010.
- "What To Look For On Election Night". Rasmussen Reports. November 2, 2010. Archived from the original on November 4, 2010. Retrieved November 24, 2010.
- Ishmael, Patrick (October 25, 2010). "Eight days out, GOP still poised to gain 60+ House seats". Hot Air. Archived from the original on November 29, 2010. Retrieved November 24, 2010.
- "2010 House Ratings". Centerforpolitics.org. November 1, 2010. Retrieved November 4, 2010.
- Cook Political Report (October 26, 2010). "Cook Political Ups Projected Democratic Losses To 48 to 60". Archived from the original on October 29, 2010. Retrieved October 26, 2010.
- "Democrats Will Lose the House: Charlie Cook". Outsidethebeltway.com. February 22, 2010. Retrieved June 14, 2010.
- Scott Rasmussen (November 1, 2010). "A Vote Against Dems, Not for the GOP". wsj.com. Retrieved November 4, 2010.
- "House Ratings". rothenbergpoliticalreport.com. October 28, 2010. Retrieved November 4, 2010.
- Rothenberg, The (April 14, 2010). "The Rothenberg Political Report: New Print Edition: House Overview". Rothenbergpoliticalreport.blogspot.com. Retrieved June 14, 2010.
- "CQ Politics | House Race Ratings Map for 2010". Innovation.cqpolitics.com. Archived from the original on October 28, 2010.
- "CQ Politics | House Race Ratings Map for 2010". Innovation.cqpolitics.com. Archived from the original on July 10, 2010. Retrieved July 11, 2010.
- "The Cook Political Report – Charts – 2010 House Competitive Races". Cookpolitical.com. November 1, 2010. Archived from the original on November 4, 2010. Retrieved November 1, 2010.
- Rothenberg Political Report (November 1, 2010). "House Ratings". Rothenbergpoliticalreport.com. Archived from the original on November 1, 2010. Retrieved November 1, 2010.
- "2010 House Ratings Chart". CQ Politics. Archived from the original on October 28, 2010. Retrieved November 1, 2010.
- Crystal Ball, as of November 1, 2010
- RealClearPolitics, as of November 1, 2010
- "GEMS ELECTION RESULTS". alaska.gov. Archived from the original on November 21, 2019. Retrieved March 13, 2015.
- "State of Arizona Official Canvass" (PDF). Archived from the original (PDF) on September 20, 2013.
- "Arkansas Secretary of State". votenaturally.org. Retrieved March 13, 2015.
- "California SOS – Election Results". Archived from the original on June 8, 2012. Retrieved March 30, 2012.
- Colorado Official Results General Election
- Connecticut Election Results Archived June 19, 2011, at the Wayback Machine
- "State Of Delaware – Elections Results". delaware.gov. Retrieved March 13, 2015.
- Florida Election Results
- "11/2/2010 – Federal and Statewide". georgia.gov. Retrieved March 13, 2015.
- Hawaii 2010 General Election Results
- "2010 General Results statewide". sos.idaho.gov. Archived from the original on September 22, 2012.
- "Secretary of State : Election Division: Election Results". in.gov. Retrieved March 13, 2015.
- Iowa SOS – Official General Election Results Archived November 6, 2008, at the Wayback Machine
- "Kansas Secretary of State – General Election Results" (PDF).
- "KY – Election Results". clarityelections.com. Retrieved March 13, 2015.
- "Louisiana Secretary of State". louisiana.gov. Archived from the original on November 6, 2010. Retrieved March 13, 2015.
- "Bureau of Corporations, Elections & Commissions, Elections Division". maine.gov. Retrieved March 13, 2015.
- Maryland State Board of Elections. "2010 General Election Official Results". state.md.us. Retrieved March 13, 2015.
- "Massachusetts 2010 Election Results" (PDF).
- "2010 Official Michigan General Election Results – Representative in Congress". nictusa.com. Archived from the original on October 6, 2014. Retrieved March 13, 2015.
- de Heus, Matt. "de Heus for Congress".
- "Minnesota SOS – General Election Results". Archived from the original on April 3, 2012. Retrieved March 30, 2012.
- "404 We Are Sorry, We Cannot Find That Page". ms.gov. Archived from the original on April 2, 2015. Retrieved March 13, 2015.
- "State of Missouri General Election Results". Archived from the original on February 20, 2011. Retrieved January 5, 2015.
- "Montana Secretary of State – Election Night Results – November 4, 2014". mt.gov. Archived from the original on August 13, 2010. Retrieved March 13, 2015.
- "Nebraska General Election Results" (PDF).
- "2010 Unofficial Statewide General Election Coverage and Reports". nvsos.gov. Retrieved March 13, 2015.
- "2010 election homepage". nh.gov. Archived from the original on September 24, 2015. Retrieved March 13, 2015.
- "State of New Jersey General Election Results" (PDF).
- "New Mexico 2010 General Election Results". Archived from the original on December 5, 2010. Retrieved March 30, 2012.
- "New York General Election Results" (PDF). Archived from the original (PDF) on August 1, 2013.
- "NC – Election Results". clarityelections.com. Retrieved March 13, 2015.
- "Secretary of State – Election Night Results – November 4, 2014". nd.gov. Retrieved March 13, 2015.
- "Ohio General Election Results". state.oh.us. Archived from the original on November 2, 2014. Retrieved March 13, 2015.
- "SUMMARY RESULTS: General Election – November 2, 2010". ok.gov. Retrieved March 13, 2015.
- "Official Results - General Election 2010 - Oregon Secretary of State" (PDF). state.or.us. Retrieved March 13, 2015.
- Pennsylvania General Election Results Archived November 6, 2010, at the Wayback Machine
- "RI.gov: Election Results". ri.gov. Retrieved March 13, 2015.
- "SC – Election Results". enr-scvotes.org. Retrieved March 13, 2015.
- "South Dakota Secretary of State". electionresults.sd.gov.
- "Tennessee Election Results". Archived from the original on March 14, 2012. Retrieved March 30, 2012.
- "Texas General Election Results". Archived from the original on November 8, 2006.
- "Utah Election Results". Archived from the original on July 21, 2011. Retrieved March 30, 2012.
- "Elections – Home – Vermont Secretary of State" (PDF). vermont-elections.org. Archived from the original (PDF) on December 1, 2010. Retrieved March 13, 2015.
- Virginia Election Results Archived July 21, 2011, at the Wayback Machine
- "Washington General Election Results". Archived from the original on April 9, 2011. Retrieved March 30, 2012.
- "WV SOS – Elections – Election Results – Online Data Services". wv.gov. Retrieved March 13, 2015.
- "Wisconsin General Election Results" (PDF).
- "Wyoming General Election Results" (PDF).
- "Prospective lawmakers in American Samoa revealed". Radio New Zealand International. September 3, 2010. Retrieved September 8, 2010.
- "DC Board Of Elections And Ethics: Election Results". dcboee.org. Archived from the original on November 6, 2010. Retrieved March 13, 2015.
- "Commonwealth Election Commission - Home".
- "Virgin Islands Election Results". vivote.gov. Archived from the original on March 4, 2016. Retrieved March 13, 2015.
Further reading
- Abramson, Paul R. John H Aldrich and David W Rohde, Change and Continuity in the 2008 and 2010 Elections (2011)
- Bullock, Charles S., III et al. Key States, High Stakes: Sarah Palin, the Tea Party, and the 2010 Elections (2011) excerpt and text search
External links
- Candidates for U.S. Congress at Project Vote Smart
- U.S. House of Representatives from OurCampaigns.com
- Congressional Races in 2010 from Open Secrets (campaign contributions)
- 2010 National Congressional Ballot from Pollster.com
- Election 2010: House of Representatives Election from Rasmussen Reports
- Battle for the House from Real Clear Politics
- House Races in 2010 from CQ Politics
- A Look at 2010 Congressional Races at C-SPAN, ongoing video blog
| ||
| Politics |
|  |
| Elections | ||
| Books |
| |
| Family |
| |