2009 Kerry County Council election
An election to Kerry County Council took place on 5 June 2009 as part of that year's Irish local elections. 27 councillors were elected from five electoral divisions by PR-STV voting for a five-year term of office.
| |||||||||||||||||||||||||||||||||||||
All 27 seats to Kerry County Council | |||||||||||||||||||||||||||||||||||||
|---|---|---|---|---|---|---|---|---|---|---|---|---|---|---|---|---|---|---|---|---|---|---|---|---|---|---|---|---|---|---|---|---|---|---|---|---|---|
| |||||||||||||||||||||||||||||||||||||
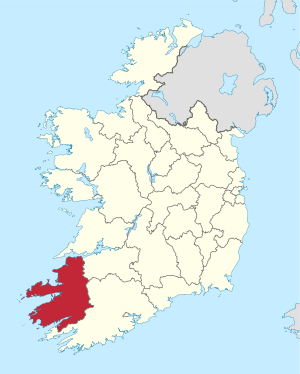 Map showing the area of Kerry County Council | |||||||||||||||||||||||||||||||||||||
| |||||||||||||||||||||||||||||||||||||
Results by party
| Party | Seats | ± | First Pref. votes | FPv% | ±% | |
|---|---|---|---|---|---|---|
| Fine Gael | 10 | 21,062 | 27.37% | |||
| Fianna Fáil | 7 | 20,723 | 26.93% | |||
| Labour Party | 4 | 11,532 | 14.98% | |||
| Sinn Féin | 2 | 8,010 | 10.41% | |||
| South Kerry Independent | 1 | 2,536 | 3.30% | |||
| Green Party | 0 | 881 | 1.14% | |||
| Independent | 3 | 12,215 | 15.87% | |||
| Totals | 27 | 76,959 | 100% | |||
Results by Electoral Area
Dingle
| Dingle- 3 seats | ||||||||
|---|---|---|---|---|---|---|---|---|
| Party | Candidate | FPv% | Count 1 | Count 2 | Count 3 | Count 4 | ||
| Fianna Fáil | Michael O'Shea* | 21.64 | 2,011 | 2,054 | 2,142 | 2,517 | ||
| Fine Gael | Brendan Griffin | 21.93 | 2,038 | 2,114 | 2,228 | 2,317 | ||
| Fine Gael | Seamus (Cosai) Fitzgerald* | 17.00 | 1,580 | 1,659 | 1,964 | 2,442 | ||
| Independent | Brigid O'Connor | 12.69 | 1,179 | 1,315 | 1,494 | 1,620 | ||
| Fianna Fáil | Breandan Fitzgerald | 11.33 | 1,053 | 1,113 | 1,251 | |||
| Labour Party | Pat Hanafin | 8.75 | 813 | 942 | ||||
| Sinn Féin | Theresa Rafter Moriarty | 2.72 | 253 | |||||
| Green Party | Darach O Murchu | 2.32 | 216 | |||||
| Independent | Breanainn Breglaoi | 1.60 | 149 | |||||
| Electorate: 13,200 Valid: 9,292 (70.39%) Spoilt: 81 Quota: 2,324 Turnout: 9,373 (71.01%) | ||||||||
Killarney
| Killarney - 7 seats | |||||||||||
|---|---|---|---|---|---|---|---|---|---|---|---|
| Party | Candidate | FPv% | Count 1 | Count 2 | Count 3 | Count 4 | Count 5 | Count 6 | Count 7 | ||
| Independent | Danny Healy-Rae* | 15.70 | 2,958 | ||||||||
| Fianna Fáil | Tom Fleming* | 14.51 | 2,733 | ||||||||
| South Kerry Independent | Michael Gleeson* | 13.46 | 2,536 | ||||||||
| Independent | Brendan Cronin* | 12.37 | 2,331 | 2,436 | |||||||
| Labour Party | Marie Moloney | 11.80 | 2,223 | 2,318 | 2,370 | ||||||
| Fine Gael | John Sheahan* | 8.77 | 1,652 | 1,743 | 1,778 | 1,828 | 1,908 | 1,920 | 2,204 | ||
| Fine Gael | Bobby O'Connell* | 8.43 | 1,588 | 1,637 | 1,722 | 1,735 | 1,859 | 1,871 | 1,973 | ||
| Independent | Donal Grady | 5.71 | 1,075 | 1,159 | 1,178 | 1,222 | 1,347 | 1,364 | |||
| Fianna Fáil | Brian O'Leary | 5.58 | 1,052 | 1,173 | 1,318 | 1,362 | 1,432 | 1,455 | 1,730 | ||
| Sinn Féin | Lynn Boylan | 1.71 | 323 | 354 | 364 | 381 | |||||
| Sinn Féin | Con Walsh | 1.56 | 293 | 315 | 345 | 348 | |||||
| Green Party | Conor O'Neill | 0.39 | 74 | 79 | 81 | 91 | |||||
| Electorate: 29,916 Valid: 18,838 (62.97%) Spoilt: 195 Quota: 2,355 Turnout: 19,033 (63.62%) | |||||||||||
Killorglin
| Killorglin - 5 seats | |||||||||
|---|---|---|---|---|---|---|---|---|---|
| Party | Candidate | FPv% | Count 1 | Count 2 | Count 3 | Count 4 | Count 5 | ||
| Independent | Michael Healy-Rae* | 21.28 | 3,198 | ||||||
| Fianna Fáil | Michael Cahill* | 16.27 | 2,446 | 2,538 | |||||
| Fine Gael | P.J. Donovan | 15.18 | 2,282 | 2,375 | 2,464 | 2,473 | 2,540 | ||
| Fine Gael | Patrick Connor-Scarteen | 13.61 | 2,045 | 2,261 | 2,473 | 3,118 | |||
| Fianna Fáil | Paul O'Donoghue* | 13.23 | 1,988 | 2,055 | 2,090 | 2,251 | 2,352 | ||
| Fine Gael | Johnny (Porridge) O'Connor* | 10.15 | 1,525 | 1,584 | 1,721 | 1,754 | 1,819 | ||
| Fianna Fáil | Donald Lynch | 5.78 | 869 | 986 | 1,059 | ||||
| Labour Party | John Sheehan | 2.42 | 364 | 385 | |||||
| Green Party | Oonagh Comerford | 2.08 | 313 | 340 | |||||
| Electorate: 21,590 Valid: 15,030 (69.62%) Spoilt: 147 Quota: 2,506 Turnout: 15,177 (70.30%) | |||||||||
Listowel
| Listowel- 5 seats | |||||||||
|---|---|---|---|---|---|---|---|---|---|
| Party | Candidate | FPv% | Count 1 | Count 2 | Count 3 | Count 4 | Count 5 | ||
| Sinn Féin | Robert Beasley* | 15.42 | 2,523 | 2,601 | 3,004 | ||||
| Fine Gael | Liam Purtill* | 15.34 | 2,511 | 2,598 | 2,660 | 2,669 | 2,790 | ||
| Fine Gael | Tim Buckley* | 14.56 | 2,383 | 2,536 | 2,575 | 2,604 | 2,808 | ||
| Fianna Fáil | John Brassil* | 12.44 | 2,036 | 2,170 | 2,322 | 2,369 | 2,655 | ||
| Labour Party | Pat Leahy* | 15.54 | 1,889 | 2,033 | 2,080 | 2,110 | 2,694 | ||
| Fianna Fáil | Dan Kiely* | 10.23 | 1,674 | 1,898 | 1,920 | 1,928 | 2,048 | ||
| Labour Party | Michael Conway | 8.57 | 1,403 | 1,427 | 1,606 | 1,701 | |||
| Sinn Féin | Risteard O Fuarain | 6.14 | 1,005 | 1,017 | |||||
| Fianna Fáil | Maria Gorman | 5.75 | 941 | ||||||
| Electorate: 25,042 Valid: 16,365 (65.35%) Spoilt: 230 Quota: 2,728 Turnout: 16,595 (66.27%) | |||||||||
Tralee
| Tralee - 7 seats | ||||||||||||||||
|---|---|---|---|---|---|---|---|---|---|---|---|---|---|---|---|---|
| Party | Candidate | FPv% | Count 1 | Count 2 | Count 3 | Count 4 | Count 5 | Count 6 | Count 7 | Count 8 | Count 9 | Count 10 | Count 11 | Count 12 | ||
| Labour Party | Arthur Spring | 18.10 | 3,155 | |||||||||||||
| Sinn Féin | Toireasa Ferris* | 17.23 | 3,004 | |||||||||||||
| Fianna Fáil | Anne McEllistrim* | 10.44 | 1,820 | 1,892 | 1,980 | 2,010 | 2,022 | 2,076 | 2,127 | 2,233 | ||||||
| Fine Gael | Pat McCarthy* | 10.43 | 1,819 | 1,900 | 1,945 | 1,982 | 1,985 | 2,037 | 2,080 | 2,230 | ||||||
| Labour Party | Terry O'Brien* | 9.67 | 1,685 | 2,105 | 2,237 | |||||||||||
| Fine Gael | Jim Finucane | 9.40 | 1,639 | 1,769 | 1,825 | 1,863 | 1,867 | 1,923 | 2,008 | 2,103 | 2,110 | 2,252 | ||||
| Fianna Fáil | Norma Foley* | 6.05 | 1,055 | 1,099 | 1,149 | 1,178 | 1,184 | 1,215 | 1,242 | 1,271 | 1,286 | 1,379 | 1,398 | 1,414 | ||
| Fianna Fáil | Ted Fitzgerald* | 5.99 | 1,045 | 1,097 | 1,140 | 1,158 | 1,161 | 1,194 | 1,234 | 1,277 | 1,293 | 1,348 | 1,382 | 1,400 | ||
| Sinn Féin | Moss Hannon | 3.49 | 609 | 636 | 910 | 925 | 939 | 968 | 1,018 | 1,073 | 1,080 | |||||
| Independent | Timmy Griffin | 2.88 | 502 | 541 | 575 | 601 | 606 | 674 | 794 | |||||||
| Independent | Thomas Collins | 2.39 | 416 | 451 | 496 | 531 | 537 | 603 | ||||||||
| Independent | John Foley | 2.33 | 407 | 439 | 474 | 490 | 494 | |||||||||
| Green Party | David Grey | 1.59 | 278 | 321 | 343 | |||||||||||
| Electorate: 29,305 Valid: 19,249 (59.49%) Spoilt: 335 Quota: 2,180 Turnout: 19,584 (60.36%) | ||||||||||||||||
External links
- https://www.housing.gov.ie/sites/default/files/migrated-files/en/Publications/LocalGovernment/Voting/FileDownLoad,23415,en.pdf
- Official website
- http://irelandelection.com/council.php?elecid=175&tab=constit&detail=yes&electype=5&councilid=12&electype=5
- https://irishelectionliterature.com/others-project/old-local-election-results/
| Dáil elections | |
|---|---|
| Seanad elections | |
| Presidential elections | |
| European elections | |
| Local elections | |
| Referendums | |
| |
This article is issued from Wikipedia. The text is licensed under Creative Commons - Attribution - Sharealike. Additional terms may apply for the media files.