2009 Sligo County Council election
An election to Sligo County Council took place on 5 June 2009 as part of that year's Irish local elections. 25 councillors were elected from five electoral divisions by PR-STV voting for a five-year term of office.
| |||||||||||||||||||||||||||||||||
All 25 seats to Sligo County Council | |||||||||||||||||||||||||||||||||
|---|---|---|---|---|---|---|---|---|---|---|---|---|---|---|---|---|---|---|---|---|---|---|---|---|---|---|---|---|---|---|---|---|---|
| |||||||||||||||||||||||||||||||||
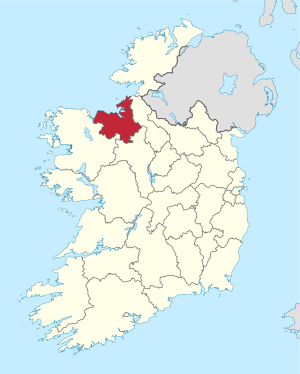 Map showing the area of Sligo County Council | |||||||||||||||||||||||||||||||||
| |||||||||||||||||||||||||||||||||
Results by party
| Party | Seats | ± | First Pref. votes | FPv% | ±% | |
|---|---|---|---|---|---|---|
| Fine Gael | 12 | +2 | 13,413 | 39.36% | ||
| Fianna Fáil | 7 | -3 | 8,972 | 26.33% | ||
| Labour Party | 2 | -1 | 2,500 | 7.34% | ||
| Sinn Féin | 1 | - | 2,709 | 7.95% | ||
| Independent | 3 | +2 | 6,484 | 19.03% | ||
| Totals | 25 | - | 34,078 | 100% | — | |
Results by Electoral Area
Ballymote
| Ballymote - 4 seats | ||||||||||
|---|---|---|---|---|---|---|---|---|---|---|
| Party | Candidate | FPv% | Count 1 | Count 2 | Count 3 | Count 4 | Count 5 | Count 6 | ||
| Fine Gael | Gerard Mullaney* | 24.35 | 1,437 | |||||||
| Fianna Fáil | Martin Baker* | 18.86 | 1,113 | 1,208 | ||||||
| Fine Gael | Thomas Collery | 12.08 | 713 | 784 | 796 | 870 | 880 | 1,119 | ||
| Fine Gael | Pat McGrath* | 12.08 | 713 | 762 | 785 | 994 | 999 | 1,106 | ||
| Sinn Féin | Thomas Healy | 10.93 | 644 | 659 | 665 | 765 | 768 | |||
| Fianna Fáil | Mattie Scanlon | 10.39 | 613 | 625 | 644 | 766 | 775 | 915 | ||
| Independent | Tim Mulcahy | 9.18 | 542 | 554 | 606 | |||||
| Independent | Dick Cahill | 2.13 | 126 | 129 | ||||||
| Electorate: 8,628 Valid: 5,902 (68.41%) Spoilt: 76 Quota: 1,181 Turnout: 5,964 (69.12%) | ||||||||||
Dromore
| Dromore - 4 seats | |||||||||
|---|---|---|---|---|---|---|---|---|---|
| Party | Candidate | FPv% | Count 1 | Count 2 | Count 3 | Count 4 | Count 5 | ||
| Independent | Michael Clarke | 21.94 | 1,408 | ||||||
| Fianna Fáil | Joe Queenan* | 16.31 | 1,047 | 1,062 | 1,229 | 1,298 | |||
| Fine Gael | Mary Barrett* | 15.88 | 1,019 | 1,060 | 1,144 | 1,253 | 1,390 | ||
| Fine Gael | Dara Mulvey | 12.42 | 797 | 802 | 832 | 856 | 1,298 | ||
| Fine Gael | Paul Conmy* | 11.14 | 715 | 726 | 749 | 809 | 856 | ||
| Labour Party | Alwyn Love | 10.38 | 666 | 674 | 702 | 779 | |||
| Sinn Féin | Padraig Hallinan | 6.25 | 401 | 430 | 454 | ||||
| Fianna Fáil | Martin Wilson | 5.69 | 356 | 380 | |||||
| Electorate: 8,963 Valid: 6,418 (71.61%) Spoilt: 56 Quota: 1,284 Turnout: 6,474 (72.23%) | |||||||||
Sligo Drumcliff
| Sligo Drumcliff - 6 seats | ||||||||||
|---|---|---|---|---|---|---|---|---|---|---|
| Party | Candidate | FPv% | Count 1 | Count 2 | Count 3 | Count 4 | Count 5 | Count 6 | ||
| Fine Gael | Joe Leonard* | 19.77 | 1,527 | |||||||
| Labour Party | Veronica Cawley* | 13.57 | 1,048 | 1,085 | 1,091 | 1,149 | ||||
| Fianna Fáil | Jude Devins* | 10.91 | 843 | 860 | 861 | 878 | 926 | 1,001 | ||
| Fianna Fáil | Seamus Kilgannon* | 9.18 | 709 | 722 | 724 | 741 | 811 | 852 | ||
| Fianna Fáil | Patsy Barry* | 9.15 | 707 | 796 | 805 | 966 | 983 | 1,028 | ||
| Fine Gael | Hubert Keaney | 8.28 | 640 | 695 | 701 | 761 | 923 | 1,023 | ||
| Sinn Féin | Arthur Gibbons | 8.03 | 620 | 647 | 650 | 697 | 733 | |||
| Fine Gael | Matt Lyons | 7.31 | 565 | 638 | 639 | 687 | 873 | 1,016 | ||
| Fine Gael | Ita Fox* | 6.96 | 538 | 574 | 575 | 607 | ||||
| Independent | James Gilmartin | 5.11 | 474 | 546 | 566 | |||||
| Independent | Francis Feeney | 0.70 | 54 | 58 | ||||||
| Electorate: 12,947 Valid: 7,725 (59.67%) Spoilt: 97 Quota: 1,097 Turnout: 7,822 (60.42%) | ||||||||||
Sligo Strandhill
| Sligo Strandhill - 7 seats | ||||||||||
|---|---|---|---|---|---|---|---|---|---|---|
| Party | Candidate | FPv% | Count 1 | Count 2 | Count 3 | Count 4 | Count 5 | Count 6 | ||
| Fine Gael | Tony McLoughlin* | 24.86 | 2,019 | |||||||
| Independent | Declan Bree* | 16.82 | 1,366 | |||||||
| Sinn Féin | Seán MacManus* | 12.86 | 1,044 | |||||||
| Fianna Fáil | Deirdre Healy-McGowan | 9.99 | 811 | 915 | 922 | 930 | 939 | 981 | ||
| Fine Gael | Imelda Henry* | 8.40 | 682 | 966 | 977 | 1,008 | 1,016 | 1,176 | ||
| Fianna Fáil | Rosaleen O'Grady | 7.30 | 593 | 567 | 578 | 587 | 598 | 607 | ||
| Labour Party | Jim McGarry* | 6.14 | 499 | 940 | 973 | 1,004 | 1,028 | 1,067 | ||
| Fianna Fáil | Albert Higgins* | 5.44 | 442 | 835 | 840 | 846 | 853 | 883 | ||
| Fine Gael | David Cawley | 4.65 | 378 | 440 | 447 | 456 | 468 | 498 | ||
| Labour Party | Mary Dolan-McLoughlin | 3.53 | 287 | 360 | 364 | 375 | 379 | |||
| Electorate: 13,517 Valid: 8,121 (60.08%) Spoilt: 105 Quota: 1,065 Turnout: 8,226 (60.86%) | ||||||||||
Tobercurry
| Tobercurry - 4 seats | |||||||
|---|---|---|---|---|---|---|---|
| Party | Candidate | FPv% | Count 1 | Count 2 | Count 3 | ||
| Independent | Margaret Gormley* | 36.50 | 2,162 | ||||
| Fianna Fáil | Jerry Lundy* | 16.37 | 970 | 1,157 | 1,266 | ||
| Fine Gael | Gerry Murray* | 15.26 | 904 | 1,211 | |||
| Fianna Fáil | Aidan Colleary* | 12.96 | 768 | 890 | 960 | ||
| Fine Gael | Michael Fleming* | 12.93 | 766 | 985 | 1,169 | ||
| Independent | Roger McCarrick | 5.98 | 354 | 496 | |||
| Electorate: 8,294 Valid: 5,924 (71.43%) Spoilt: 58 Quota: 1,185 Turnout: 5,982 (72.12%) | |||||||
External links
| Preceded by 2004 Sligo County Council election |
Sligo County Council elections | Succeeded by 2014 Sligo County Council election |
This article is issued from Wikipedia. The text is licensed under Creative Commons - Attribution - Sharealike. Additional terms may apply for the media files.