2009 Waterford County Council election
An election to Waterford County Council took place on 5 June 2009 as part of that year's Irish local elections. 23 councillors were elected from five electoral divisions by PR-STV voting for a five-year term of office. .
| |||||||||||||||||||||||||||||||||
All 23 seats to Waterford County Council | |||||||||||||||||||||||||||||||||
|---|---|---|---|---|---|---|---|---|---|---|---|---|---|---|---|---|---|---|---|---|---|---|---|---|---|---|---|---|---|---|---|---|---|
| |||||||||||||||||||||||||||||||||
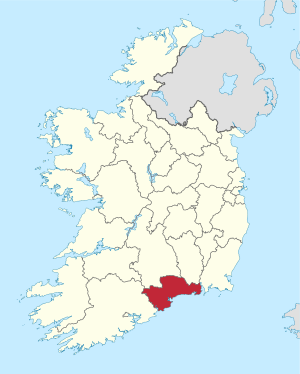 Map showing the area of Waterford County Council | |||||||||||||||||||||||||||||||||
| |||||||||||||||||||||||||||||||||
Results by party
| Party | Seats | ± | First Pref. votes | FPv% | ±% | |
|---|---|---|---|---|---|---|
| Fine Gael | 11 | - | 13,939 | 44.25% | ||
| Fianna Fáil | 5 | -2 | 8,079 | 25.65% | ||
| Labour Party | 4 | - | 4,369 | 13.87% | ||
| Sinn Féin | 2 | +1 | 1,734 | 5.50% | ||
| Independent | 1 | +1 | 3,067 | 9.74% | ||
| Totals | 23 | - | 31,503 | 100% | — | |
Results by Electoral Area
Comeragh
| Comeragh - 6 seats | |||||||||||
|---|---|---|---|---|---|---|---|---|---|---|---|
| Party | Candidate | FPv% | Count 1 | Count 2 | Count 3 | Count 4 | Count 5 | Count 6 | Count 7 | ||
| Fine Gael | Liam Brazil* | 21.01 | 1,732 | ||||||||
| Fine Gael | Brendan Coffey* | 17.29 | 1,429 | ||||||||
| Fianna Fáil | Michael J. O'Ryan* | 16.11 | 1,329 | ||||||||
| Labour Party | Ger Barron* | 12.39 | 1,020 | 1,169 | 1,221 | ||||||
| Fine Gael | Mary Greene* | 10.43 | 860 | 1,108 | 1,227 | ||||||
| Fianna Fáil | John O'Leary | 9.08 | 748 | 787 | 822 | 903 | 976 | 1,001 | 1,015 | ||
| Fianna Fáil | Benji Whelan | 8.87 | 732 | 806 | 830 | 914 | 991 | 1,006 | 1,014 | ||
| Independent | Michael Flynn | 4.82 | 398 | 441 | 461 | ||||||
| Electorate: 13,086 Valid: 8,249 (63.04%) Spoilt: 120 Quota: 1,179 Turnout: 8,369 (63.95%) | |||||||||||
Dungarvan
| Dungarvan - 6 seats | ||||||||||
|---|---|---|---|---|---|---|---|---|---|---|
| Party | Candidate | FPv% | Count 1 | Count 2 | Count 3 | Count 4 | Count 5 | Count 6 | ||
| Fine Gael | Damien Geoghegan* | 15.32 | 1,300 | |||||||
| Fine Gael | Pat Nugent* | 14.31 | 1,214 | |||||||
| Sinn Féin | Brendan Mansfield* | 11.52 | 978 | 991 | 1,047 | 1,084 | 1,279 | |||
| Labour Party | Billy Kyne* | 11.30 | 959 | 974 | 1,029 | 1,071 | 1,130 | 1,141 | ||
| Fianna Fáil | Tom Cronin* | 10.30 | 874 | 877 | 907 | 1,140 | 1,294 | |||
| Fine Gael | Tom Higgins* | 8.79 | 746 | 769 | 909 | 982 | 1,071 | 1,100 | ||
| Labour Party | Teresa Wright* | 8.72 | 740 | 755 | 800 | 857 | 974 | 989 | ||
| Independent | Seamus O'Donnell | 8.48 | 720 | 724 | 789 | 830 | ||||
| Fianna Fáil | Ollie Wilkinson | 6.01 | 510 | 514 | 532 | |||||
| Fine Gael | Jimmy Breathnach | 5.24 | 445 | 455 | ||||||
| Electorate: 13,856 Valid: 8,486 (61.24%) Spoilt: 92 Quota: 1,213 Turnout: 8,578 (61.91%) | ||||||||||
Lismore
| Lismore - 4 seats | ||||||||
|---|---|---|---|---|---|---|---|---|
| Party | Candidate | FPv% | Count 1 | Count 2 | Count 3 | Count 4 | ||
| Fianna Fáil | James Tobin* | 17.60 | 1,023 | 1,264 | ||||
| Fine Gael | Nora Flynn* | 16.05 | 933 | 1,009 | 1,020 | 1,170 | ||
| Fine Gael | Liam Curran | 15.07 | 876 | 909 | 910 | 977 | ||
| Labour Party | John Pratt | 14.38 | 836 | 892 | 902 | 1,059 | ||
| Fine Gael | Declan Doocey* | 14.14 | 822 | 895 | 913 | 1,126 | ||
| Fianna Fáil | Bernard Leddy | 11.68 | 679 | 806 | 867 | |||
| Fianna Fáil | Kevin Wilkinson* | 11.08 | 644 | |||||
| Electorate: 9,548 Valid: 5,813 (60.88%) Spoilt: 89 Quota: 1,163 Turnout: 5,902 (61.81%) | ||||||||
Tramore
| Tramore - 7 seats | |||||||||||||
|---|---|---|---|---|---|---|---|---|---|---|---|---|---|
| Party | Candidate | FPv% | Count 1 | Count 2 | Count 3 | Count 4 | Count 5 | Count 6 | Count 7 | Count 8 | Count 9 | ||
| Fine Gael | John Carey* | 12.43 | 1,113 | 1,118 | 1,129 | ||||||||
| Fine Gael | Lola O'Sullivan* | 9.55 | 855 | 864 | 880 | 899 | 944 | 1,016 | 1,113 | 1,115 | 1,144 | ||
| Fine Gael | Ann Marie Power* | 9.48 | 849 | 856 | 871 | 904 | 955 | 994 | 1,099 | 1,099 | 1,122 | ||
| Labour Party | Paddy O'Callaghan* | 9.09 | 814 | 840 | 860 | 870 | 895 | 962 | 1,060 | 1,061 | 1,087 | ||
| Independent | Joe Conway | 8.69 | 778 | 793 | 821 | 844 | 907 | 965 | 1,067 | 1,069 | 1,104 | ||
| Fine Gael | Pat Barron | 8.44 | 765 | 766 | 774 | 788 | 801 | 829 | 868 | 870 | 892 | ||
| Sinn Féin | Pat Fitzgerald | 8.44 | 756 | 773 | 784 | 792 | 801 | 814 | 845 | 845 | 1,040 | ||
| Fianna Fáil | Pat Daly* | 7.56 | 677 | 681 | 685 | 739 | 756 | 774 | 807 | 807 | 1,016 | ||
| Fianna Fáil | Geoff Power | 6.92 | 620 | 620 | 622 | 660 | 669 | 677 | 694 | 695 | |||
| Independent | Blaise Hannigan | 5.34 | 478 | 507 | 547 | 561 | 632 | 658 | |||||
| Green Party | Stan Nangle | 3.52 | 315 | 321 | 348 | 354 | 371 | ||||||
| Independent | Pat Finnerty | 3.25 | 291 | 306 | 329 | 344 | |||||||
| Fianna Fáil | Joe O'Shea | 2.71 | 243 | 247 | 249 | ||||||||
| Independent | James McCartan | 2.50 | 224 | 232 | |||||||||
| Independent | Eddie Walsh | 1.99 | 178 | ||||||||||
| Electorate: 15,451 Valid: 8,956 (57.96%) Spoilt: 97 Quota: 1,120 Turnout: 9,053 (58.59%) | |||||||||||||
External links
| Preceded by 2004 Waterford County Council election |
Waterford County Council elections | Succeeded by 2014 Waterford City and County Council election |
This article is issued from Wikipedia. The text is licensed under Creative Commons - Attribution - Sharealike. Additional terms may apply for the media files.