2009 Laois County Council election
An election to Laois County Council took place on 5 June 2009 as part of that year's Irish local elections. 25 councillors were elected from five electoral divisions by PR-STV voting for a five-year term of office.
| |||||||||||||||||||||||||||||||||||||
All 25 seats to Laois County Council | |||||||||||||||||||||||||||||||||||||
|---|---|---|---|---|---|---|---|---|---|---|---|---|---|---|---|---|---|---|---|---|---|---|---|---|---|---|---|---|---|---|---|---|---|---|---|---|---|
| |||||||||||||||||||||||||||||||||||||
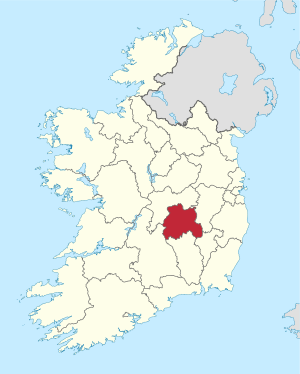 Map showing the area of Laois County Council | |||||||||||||||||||||||||||||||||||||
| |||||||||||||||||||||||||||||||||||||
Results by party
| Party | Seats | ± | First Pref. votes | FPv% | ±% | |
|---|---|---|---|---|---|---|
| Fine Gael | 12 | +3 | 13,175 | 38.29% | ||
| Fianna Fáil | 8 | -3 | 11,658 | 33.88% | ||
| Labour Party | 1 | - | 2,007 | 5,83% | ||
| Sinn Féin | 1 | - | 2,810 | 8.17% | ||
| Independent | 3 | +1 | 4,711 | 13.69% | ||
| Progressive Democrats | 0 | -1 | ||||
| Totals | 25 | - | 34,409 | 100% | — | |
Results by Electoral Area
Borris-in-Ossory
| Borris-in-Ossory - 6 seats | |||||||||||
|---|---|---|---|---|---|---|---|---|---|---|---|
| Party | Candidate | FPv% | Count 1 | Count 2 | Count 3 | Count 4 | Count 5 | Count 6 | Count 7 | ||
| Fianna Fáil | John Joe Fennelly* | 19.87 | 1,758 | ||||||||
| Fine Gael | Michael Lalor* | 15.06 | 1,332 | ||||||||
| Fine Gael | John King | 11.42 | 1,010 | 753 | 756 | 842 | 853 | 880 | 899 | ||
| Fianna Fáil | Brendan Phelan* | 11.00 | 973 | 1,109 | 1,110 | 1,190 | |||||
| Fine Gael | John Bonham* | 9.69 | 857 | 954 | 955 | 976 | 986 | 1,056 | 1,191 | ||
| Fine Gael | Marty Phelan* | 10.94 | 968 | 1,008 | 1,009 | 1,041 | 1,069 | 1,111 | 1,191 | ||
| Fianna Fáil | Michael Phelan | 8.68 | 768 | 886 | 886 | 903 | 906 | 984 | 1,001 | ||
| Labour Party | Raymond Fitzpatrick | 5.35 | 473 | 508 | 508 | 542 | 546 | 646 | |||
| Sinn Féin | Aaron Delaney | 5.30 | 469 | 498 | 499 | 531 | 536 | ||||
| Independent | M.J. Walsh | 2.61 | 231 | 247 | 248 | ||||||
| Christian Solidarity | Colm Callanan | 0.09 | 8 | 10 | |||||||
| Electorate: 14,167 Valid: 8,847 (62.45%) Spoilt: 109 Quota: 1,264 Turnout: 8,956 (63.22%) | |||||||||||
Emo
| Emo- 4 seats | ||||||||||||
|---|---|---|---|---|---|---|---|---|---|---|---|---|
| Party | Candidate | FPv% | Count 1 | Count 2 | Count 3 | Count 4 | Count 5 | Count 6 | Count 7 | Count 8 | ||
| Fine Gael | Tom Mulhall | 13.41 | 747 | 747 | 821 | 837 | 939 | 991 | 1,066 | 1,091 | ||
| Independent | Paul Mitchell | 12.10 | 674 | 676 | 701 | 772 | 829 | 960 | 983 | 1,102 | ||
| Fianna Fáil | Ray Cribbin* | 11.08 | 617 | 617 | 625 | 644 | 673 | 694 | 832 | 1,191 | ||
| Sinn Féin | Aidan Mullins | 10.25 | 571 | 573 | 583 | 615 | 636 | 753 | 799 | 895 | ||
| Fine Gael | James Deegan* | 10.16 | 566 | 567 | 647 | 661 | 767 | 831 | 964 | 992 | ||
| Fianna Fáil | Willie Murphy | 9.66 | 538 | 538 | 541 | 562 | 572 | 610 | 709 | |||
| Fianna Fáil | Paschal McEvoy | 8.99 | 501 | 501 | 504 | 508 | 588 | 604 | ||||
| Independent | Tom Cushen | 7.68 | 428 | 428 | 434 | 460 | ||||||
| Labour Party | Margaret Guijt Lawlor | 7.20 | 401 | 401 | 428 | 484 | 505 | |||||
| Fine Gael | Winifred Champ Cox | 4.63 | 258 | 258 | ||||||||
| Independent | Frances Emerson | 4.63 | 258 | 260 | 280 | |||||||
| Christian Solidarity | Colm Callanan | 4.63 | 11 | |||||||||
| Electorate: 8,110 Valid: 4,847 (59.77%) Spoilt: 82 Quota: 970 Turnout: 4,929 (60.78%) | ||||||||||||
Luggacurren
| Luggacurren- 4 seats | ||||||||||
|---|---|---|---|---|---|---|---|---|---|---|
| Party | Candidate | FPv% | Count 1 | Count 2 | Count 3 | Count 4 | Count 5 | Count 6 | ||
| Fine Gael | James Daly* | 20.98 | 1,179 | |||||||
| Fine Gael | John Moran* | 20.68 | 1,162 | |||||||
| Fianna Fáil | Dick Miller* | 14.10 | 792 | 801 | 817 | 831 | 839 | 957 | ||
| Fianna Fáil | Padraig Fleming | 14.04 | 789 | 801 | 840 | 875 | 886 | 1,148 | ||
| Fianna Fáil | Laurence Phelan | 12.62 | 709 | 716 | 728 | 745 | 753 | |||
| Independent | Ben Brennan | 10.43 | 586 | 598 | 677 | 770 | 781 | 1,025 | ||
| Independent | Nuala Finnegan | 2.94 | 165 | 171 | 208 | |||||
| Sinn Féin | Marie Johnston | 2.63 | 148 | 154 | ||||||
| Independent | James Scully | 1.42 | 80 | 83 | ||||||
| Christian Solidarity | Colm Callanan | 0.16 | 9 | |||||||
| Electorate: 9,045 Valid: 5,619 (62.12%) Spoilt: 66 Quota: 1,124 Turnout: 5,685 (62.85%) | ||||||||||
Mountmellick
| Mountmellick- 4 seats | ||||||||||||
|---|---|---|---|---|---|---|---|---|---|---|---|---|
| Party | Candidate | FPv% | Count 1 | Count 2 | Count 3 | Count 4 | Count 5 | Count 6 | Count 7 | Count 8 | ||
| Fianna Fáil | Paddy Bracken* | 15.37 | 928 | 944 | 983 | 987 | 1,011 | 1,156 | 1,263 | |||
| Fine Gael | David Goodwin* | 13.85 | 836 | 849 | 855 | 974 | 1,107 | 1,178 | 1,488 | |||
| Fianna Fáil | Seamus McDonald* | 12.69 | 766 | 776 | 836 | 848 | 941 | 1,006 | 1,063 | 1,083 | ||
| Labour Party | Pat Bowe | 11.69 | 706 | 741 | 751 | 764 | 796 | 923 | 1,064 | 1,185 | ||
| Independent | Michael Gormley | 8.66 | 523 | 549 | 585 | 590 | 622 | |||||
| Fianna Fáil | Joe Digan | 8.55 | 516 | 522 | 560 | 607 | 774 | 789 | 799 | 809 | ||
| Independent | Patrick Delaney | 8.08 | 488 | 500 | 515 | 579 | ||||||
| Fine Gael | Rosemary Whelan | 7.16 | 432 | 452 | 485 | 601 | 649 | 780 | ||||
| Fine Gael | Pat Lalor | 6.73 | 406 | 410 | 426 | |||||||
| Fianna Fáil | Talitha Horan | 4.24 | 256 | 264 | ||||||||
| Sinn Féin | Adam Haughton | 2.75 | 166 | |||||||||
| Christian Solidarity | Colm Callanan | 0.23 | 14 | |||||||||
| Electorate: 9,255 Valid: 6,037 (65.23%) Spoilt: 70 Quota: 1,208 Turnout: 6,107 (65.99%) | ||||||||||||
Portlaoise
| Portlaoise - 7 seats | |||||||||||||||
|---|---|---|---|---|---|---|---|---|---|---|---|---|---|---|---|
| Party | Candidate | FPv% | Count 1 | Count 2 | Count 3 | Count 4 | Count 5 | Count 6 | Count 7 | Count 8 | Count 9 | Count 10 | Count 11 | ||
| Fine Gael | William Aird* | 17.81 | 1,485 | ||||||||||||
| Sinn Féin | Brian Stanley* | 17.46 | 1,456 | ||||||||||||
| Fianna Fáil | Jerry Lodge* | 7.96 | 663 | 683 | 712 | 756 | 773 | 896 | 922 | 1,005 | 1,067 | ||||
| Independent | Rotimi Adebari | 7.78 | 649 | 662 | 711 | 720 | 733 | 750 | 835 | 891 | 934 | 942 | 946 | ||
| Fine Gael | Mary Sweeney* | 7.75 | 646 | 706 | 756 | 769 | 785 | 831 | 898 | 976 | 1,129 | ||||
| Fianna Fáil | Catherine Fitzgerald* | 6.85 | 571 | 599 | 620 | 639 | 653 | 785 | 814 | 860 | 901 | 914 | 921 | ||
| Fine Gael | Kathleen O'Brien | 5.31 | 443 | 509 | 540 | 551 | 566 | 587 | 647 | 756 | 906 | 946 | 953 | ||
| Fine Gael | Paddy Buggy | 5.22 | 435 | 527 | 562 | 571 | 589 | 615 | 676 | 740 | 877 | 903 | 910 | ||
| Labour Party | Jim O'Brien | 5.13 | 427 | 441 | 492 | 501 | 522 | 533 | |||||||
| Independent | Tom Jacob* | 5.08 | 424 | 465 | 497 | 515 | 530 | 560 | 621 | ||||||
| Fine Gael | Matthew Keegan | 4.96 | 413 | 491 | 521 | 533 | 542 | 579 | 622 | 697 | |||||
| Fianna Fáil | Liam Phelan | 4.77 | 397 | 413 | 453 | 481 | 493 | ||||||||
| Independent | Michael Moloney* | 1.76 | 147 | 154 | 166 | 178 | |||||||||
| Fianna Fáil | Tony Walsh | 1.39 | 116 | 118 | 123 | ||||||||||
| Independent | Joe McCormack | 0.70 | 58 | 63 | 89 | ||||||||||
| Christian Solidarity | Colm Callanan | 0.07 | 6 | 6 | 8 | ||||||||||
| Electorate: 15,512 Valid: 8,340 (53.76%) Spoilt: 88 Quota: 1,034 Turnout: 8,428 (54.33%) | |||||||||||||||
External links
| Preceded by 2004 Laois County Council election |
Laois County Council elections | Succeeded by 2014 Laois County Council election |
This article is issued from Wikipedia. The text is licensed under Creative Commons - Attribution - Sharealike. Additional terms may apply for the media files.