2009 Offaly County Council election
An election to Offaly County Council took place on 5 June 2009 as part of that year's Irish local elections. 21 councillors were elected from five electoral divisions by PR-STV voting for a five-year term of office.
| |||||||||||||||||||||||||||||||||
All 21 seats to Offaly County Council | |||||||||||||||||||||||||||||||||
|---|---|---|---|---|---|---|---|---|---|---|---|---|---|---|---|---|---|---|---|---|---|---|---|---|---|---|---|---|---|---|---|---|---|
| |||||||||||||||||||||||||||||||||
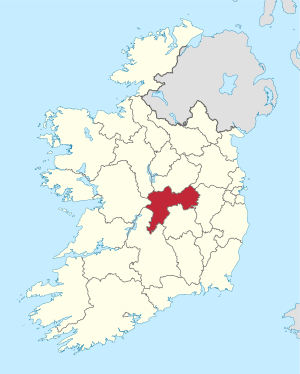 Map showing the area of Offaly County Council | |||||||||||||||||||||||||||||||||
| |||||||||||||||||||||||||||||||||
Results by party
| Party | Seats | ± | First Pref. votes | FPv% | ±% | |
|---|---|---|---|---|---|---|
| Fianna Fáil | 9 | +1 | ||||
| Fine Gael | 6 | - | ||||
| Independent | 6 | +1 | ||||
| Progressive Democrats | 0 | -2 | ||||
| Totals | 21 | - | 100% | — | ||
Results by Electoral Area
Birr
| Birr- 4 seats | ||||||||||||
|---|---|---|---|---|---|---|---|---|---|---|---|---|
| Party | Candidate | FPv% | Count 1 | Count 2 | Count 3 | Count 4 | Count 5 | Count 6 | Count 7 | Count 8 | ||
| Fianna Fáil | Peter Ormond* | 20.61 | 1,481 | |||||||||
| Independent | Tony McLoughlin* | 14.61 | 1,050 | 1,053 | 1,056 | 1,093 | 1,146 | 1,348 | 1,670 | |||
| Independent | John Carroll* | 14.41 | 1,036 | 1,043 | 1,046 | 1,099 | 1,134 | 1,254 | 1,415 | 1,514 | ||
| Fine Gael | Percy Clendennen* | 13.27 | 954 | 956 | 959 | 1,031 | 1,157 | 1,200 | 1,276 | 1,322 | ||
| Fianna Fáil | Denis Tierney | 8.99 | 646 | 648 | 668 | 686 | 714 | |||||
| Independent | Denis Sheils | 8.86 | 637 | 640 | 642 | 681 | 715 | 826 | ||||
| Fine Gael | Brian Whelahan | 8.74 | 628 | 628 | 632 | 704 | 801 | 897 | 1,050 | 1,122 | ||
| Fine Gael | Nigel Craughwell | 5.32 | 382 | 382 | 383 | 403 | ||||||
| Independent | Philip Ryan | 4.91 | 353 | 354 | 361 | |||||||
| Christian Solidarity | Colm Callanan | 0.28 | 20 | |||||||||
| Electorate: 10,677 Valid: 7,187 (67.31%) Spoilt: 108 Quota: 1,438 Turnout: 7,295 (68.32%) | ||||||||||||
Edenderry
| Edenderry – 6 seats | ||||||||||||||||||
|---|---|---|---|---|---|---|---|---|---|---|---|---|---|---|---|---|---|---|
| Party | Candidate | FPv% | Count 1 | Count 2 | Count 3 | Count 4 | Count 5 | Count 6 | Count 7 | Count 8 | Count 9 | Count 10 | Count 11 | Count 12 | Count 13 | Count 14 | ||
| Fianna Fáil | John Foley* | 17.25 | 1,649 | |||||||||||||||
| Independent | Eddie Fitzpatrick* | 12.93 | 1,236 | 1,245 | 1,248 | 1,295 | 1,340 | 1,353 | 1,366 | 1,481 | ||||||||
| Fianna Fáil | Noel Bourke* | 12.60 | 1,205 | 1,324 | 1,344 | 1,367 | ||||||||||||
| Fine Gael | Liam Quinn | 7.55 | 722 | 736 | 766 | 769 | 776 | 839 | 846 | 857 | 859 | 908 | 948 | 981 | 1,088 | 1,272 | ||
| Labour Party | Declan Leddin | 6.20 | 593 | 609 | 610 | 610 | 614 | 620 | 681 | 688 | 690 | 735 | 750 | 833 | 867 | 918 | ||
| Fianna Fáil | Ger Plunkett | 6.15 | 588 | 605 | 608 | 654 | 671 | 694 | 700 | 727 | 739 | 778 | 797 | 815 | 831 | 962 | ||
| Fine Gael | Nichola Hogan | 6.09 | 582 | 603 | 608 | 609 | 615 | 638 | 706 | 713 | 717 | 740 | 818 | 931 | 1,148 | 1,278 | ||
| Independent | Michael Fox* | 4.67 | 447 | 455 | 464 | 465 | 478 | 525 | 537 | 557 | 577 | 632 | 667 | 734 | 804 | |||
| Independent | Fergus McDonnell* | 3.59 | 343 | 363 | 370 | 370 | 378 | 398 | 455 | 478 | 483 | 513 | 521 | |||||
| Fine Gael | John Foran* | 3.47 | 332 | 342 | 346 | 349 | 360 | 364 | 387 | 413 | 425 | 433 | 528 | 580 | ||||
| Fine Gael | Jack Deegan | 3.36 | 321 | 322 | 323 | 333 | 349 | 351 | 360 | 378 | 392 | 413 | ||||||
| Sinn Féin | Martin O'Reilly | 3.22 | 308 | 313 | 320 | 327 | 337 | 348 | 358 | 379 | 381 | |||||||
| Independent | Stephen Mather | 2.92 | 279 | 284 | 284 | 288 | 309 | 315 | 320 | |||||||||
| Independent | Noel Cribbin | 2.81 | 269 | 285 | 292 | 292 | 296 | 306 | ||||||||||
| Independent | Fidelma Doolan | 2.46 | 235 | 246 | 263 | 264 | 269 | |||||||||||
| Independent | Frank Weir | 1.87 | 179 | 181 | 183 | 193 | ||||||||||||
| Fianna Fáil | Tom Nolan | 1.56 | 149 | 158 | 159 | |||||||||||||
| Independent | Dominic Sheehy | 1.17 | 112 | 113 | ||||||||||||||
| Christian Solidarity | Colm Callanan | 0.14 | 13 | 13 | ||||||||||||||
| Electorate: 15,602 Valid: 9,562 (61.29%) Spoilt: 120 Quota: 1,367 Turnout: 9,682 (62.06%) | ||||||||||||||||||
Ferbane
| Ferbane- 4 seats | ||||||||||
|---|---|---|---|---|---|---|---|---|---|---|
| Party | Candidate | FPv% | Count 1 | Count 2 | Count 3 | Count 4 | Count 5 | Count 6 | ||
| Fianna Fáil | Eamon Dooley* | 15.97 | 1,257 | 1,268 | 1,335 | 1,351 | 1,669 | |||
| Independent | John Leahy | 14.54 | 1,144 | 1,297 | 1,403 | 1,546 | 1,798 | |||
| Fine Gael | Connie Hanniffy* | 14.26 | 1,122 | 1,163 | 1,280 | 1,450 | 1,505 | 1,525 | ||
| Fianna Fáil | Sinead Moylan-Ryan* | 13.70 | 1,078 | 1,088 | 1,117 | 1,242 | 1,432 | 1,522 | ||
| Fine Gael | Marcella Corcoran Kennedy* | 11.48 | 903 | 954 | 1,015 | 1,246 | 1,280 | 1,320 | ||
| Fianna Fáil | Tom Feighery* | 10.79 | 849 | 874 | 895 | 907 | ||||
| Fine Gael | Tom Rigney | 9.20 | 723 | 735 | 748 | |||||
| Independent | Ollie Daly | 5.49 | 432 | 460 | ||||||
| Labour Party | Mary Kiely | 4.19 | 330 | |||||||
| Christian Solidarity | Colm Callanan | 0.38 | 30 | |||||||
| Electorate: 11,766 Valid: 7,869 (66.88%) Spoilt: 129 Quota: 1,574 Turnout: 7,998 (67.98%) | ||||||||||
Tullamore
| Tullamore – 7 seats | |||||||||||||||
|---|---|---|---|---|---|---|---|---|---|---|---|---|---|---|---|
| Party | Candidate | FPv% | Count 1 | Count 2 | Count 3 | Count 4 | Count 5 | Count 6 | Count 7 | Count 8 | Count 9 | Count 10 | Count 11 | ||
| Fianna Fáil | Barry Cowen* | 13.26 | 1,626 | ||||||||||||
| Fine Gael | Tommy McKeigue* | 13.01 | 1,496 | ||||||||||||
| Fianna Fáil | Sinead Dooley | 10.52 | 1,234 | 1,290 | 1,304 | 1,307 | 1,338 | 1,378 | 1,510 | ||||||
| Fine Gael | Molly Buckley* | 9.96 | 1,168 | 1,173 | 1,234 | 1,245 | 1,288 | 1,489 | |||||||
| Independent | Dervill Dolan* | 9.95 | 1,167 | 1,201 | 1,208 | 1,210 | 1,267 | 1,368 | 1,420 | 1,425 | 1,927 | ||||
| Fianna Fáil | Danny Owens* | 8.83 | 1,036 | 1,061 | 1,078 | 1,080 | 1,082 | 1,092 | 1,137 | 1,148 | 1,204 | 1,275 | 1,280 | ||
| Sinn Féin | Brendan Killeavey | 6.72 | 788 | 791 | 796 | 797 | 830 | 853 | 1,007 | 1,020 | 1,073 | 1,113 | 1,117 | ||
| Independent | Johnny Butterfield* | 6.59 | 773 | 777 | 801 | 804 | 850 | 886 | 999 | 1,010 | 1,072 | 1,128 | 1,141 | ||
| Independent | Frank Moran | 5.99 | 702 | 719 | 721 | 721 | 778 | 917 | 948 | 951 | |||||
| Labour Party | Seán O'Brien | 5.57 | 653 | 656 | 668 | 671 | 688 | 724 | |||||||
| Fine Gael | Frank Feery | 4.76 | 558 | 565 | 608 | 611 | 633 | ||||||||
| Independent | John Bracken | 2.84 | 333 | 337 | 340 | 341 | |||||||||
| Fine Gael | Vinny O'Brien | 1.58 | 185 | 186 | |||||||||||
| Christian Solidarity | Colm Callanan | 0.09 | 10 | 10 | |||||||||||
| Electorate: 18,568 Valid: 11,729 (63.17%) Spoilt: 145 Quota: 1,467 Turnout: 11,874 (63.95%) | |||||||||||||||
External links
| Preceded by 2004 Offaly County Council election |
Offaly County Council elections | Succeeded by 2014 Offaly County Council election |
This article is issued from Wikipedia. The text is licensed under Creative Commons - Attribution - Sharealike. Additional terms may apply for the media files.