2009 Wicklow County Council election
An election to Wicklow County Council took place on 5 June 2009 as part of that year's Irish local elections. 24 councillors were elected from five electoral divisions by PR-STV voting for a five-year term of office.
| |||||||||||||||||||||||||||||||||||||
All 24 seats to Wicklow County Council | |||||||||||||||||||||||||||||||||||||
|---|---|---|---|---|---|---|---|---|---|---|---|---|---|---|---|---|---|---|---|---|---|---|---|---|---|---|---|---|---|---|---|---|---|---|---|---|---|
| |||||||||||||||||||||||||||||||||||||
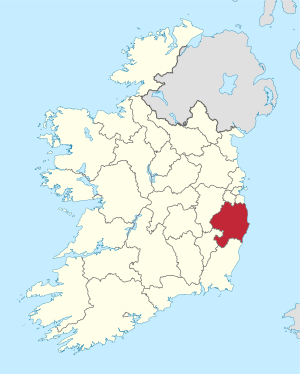 Map showing the area of Wicklow County Council | |||||||||||||||||||||||||||||||||||||
| |||||||||||||||||||||||||||||||||||||
Results by party
| Party | Seats | ± | First Pref. votes | FPv% | ±% | |
|---|---|---|---|---|---|---|
| Fine Gael | 9 | +2 | 17,795 | 31.14% | ||
| Labour Party | 6 | - | 10,953 | 19.16% | ||
| Fianna Fáil | 4 | -2 | 12,374 | 21.65% | ||
| Sinn Féin | 2 | +2 | 4,695 | 8.21% | ||
| Green Party | 0 | -1 | 2,277 | 3.98% | ||
| Independent | 3 | -1 | 9,059 | 15.85% | ||
| Totals | 24 | - | 57,153 | 100% | — | |
Results by Electoral Area
Arklow
| Arklow - 5 seats | |||||||||||
|---|---|---|---|---|---|---|---|---|---|---|---|
| Party | Candidate | FPv% | Count 1 | Count 2 | Count 3 | Count 4 | Count 5 | Count 6 | Count 7 | ||
| Fine Gael | Vincent Blake* | 15.94 | 2,041 | 2,065 | 2,137 | ||||||
| Fianna Fáil | Pat Fitzgerald | 14.77 | 1,892 | 1,942 | 1,998 | 2,016 | 2,018 | 2,449 | |||
| Labour Party | Nicky Kelly* | 11.90 | 1,524 | 1,715 | 1,828 | 2,274 | |||||
| Fianna Fáil | Pat Doran* | 10.92 | 1,399 | 1,407 | 1,415 | 1,726 | 1,759 | 1,909 | 2,030 | ||
| Independent | Peter Dempsey | 10.12 | 1,296 | 1,366 | 1,428 | 1,476 | 1,513 | 1,779 | 1,908 | ||
| Fianna Fáil | Tommy Annesley | 8.85 | 1,134 | 1,185 | 1,256 | 1,284 | 1,290 | ||||
| Fine Gael | Sylvester Bourke* | 8.74 | 1,119 | 1,169 | 1,486 | 1,595 | 1,656 | 1,934 | 1,998 | ||
| Labour Party | Kevin Ryan | 8.10 | 1,037 | 1,156 | 1,182 | ||||||
| Fine Gael | Donal O'Sullivan | 5.41 | 693 | 767 | |||||||
| Labour Party | Bernie O'Halloran | 5.25 | 672 | ||||||||
| Electorate: 19,195 Valid: 12,807 (66.72%) Spoilt: 178 Quota: 2,135 Turnout: 12,985 (67.65%) | |||||||||||
Baltinglass
| Baltinglass - 3 seats | ||||||||
|---|---|---|---|---|---|---|---|---|
| Party | Candidate | FPv% | Count 1 | Count 2 | Count 3 | Count 4 | ||
| Independent | Tommy Cullen* | 22.99 | 1,934 | 1,982 | 2,149 | |||
| Fine Gael | Edward Timmins* | 20.57 | 1,730 | 1,772 | 1,958 | 2,130 | ||
| Independent | Jim Ruttle* | 19.84 | 1,669 | 1,728 | 1,970 | 2,384 | ||
| Fine Gael | Lorcan McMahon | 11.97 | 1,007 | 1,053 | 1,125 | 1,362 | ||
| Sinn Féin | Gerry O'Neill | 11.14 | 937 | 956 | 1,042 | |||
| Fianna Fáil | Geraldine Cole | 10.61 | 892 | 907 | ||||
| Green Party | Pat Pidgeon | 2.88 | 242 | |||||
| Electorate: 12,777 Valid: 8,411 (65.83%) Spoilt: 71 Quota: 2,103 Turnout: 8,482 (66.38%) | ||||||||
Bray
| Bray - 7 seats | |||||||||||||||||
|---|---|---|---|---|---|---|---|---|---|---|---|---|---|---|---|---|---|
| Party | Candidate | FPv% | Count 1 | Count 2 | Count 3 | Count 4 | Count 5 | Count 6 | Count 7 | Count 8 | Count 9 | Count 10 | Count 11 | Count 12 | Count 13 | ||
| Independent | Christopher Fox* | 14.40 | 2,043 | ||||||||||||||
| Labour Party | John Byrne* | 14.04 | 1,992 | ||||||||||||||
| Sinn Féin | John Brady | 13.39 | 1,899 | ||||||||||||||
| Fine Gael | John Ryan* | 8.29 | 1,176 | 1,215 | 1,227 | 1,237 | 1,243 | 1,265 | 1,302 | 1,335 | 1,667 | 1,749 | 1,839 | ||||
| Fianna Fáil | Pat Vance* | 8.25 | 1,171 | 1,199 | 1,214 | 1,221 | 1,233 | 1,261 | 1,390 | 1,424 | 1,460 | 1,522 | 2,091 | ||||
| Fine Gael | Mick Glynn | 6.25 | 886 | 908 | 927 | 934 | 944 | 972 | 1,018 | 1,067 | 1,208 | 1,345 | 1,411 | 1,467 | 1,493 | ||
| Green Party | Ciaran O'Brien* | 6.15 | 872 | 886 | 894 | 907 | 915 | 951 | 974 | 1,045 | 1,111 | 1,201 | 1,270 | 1,350 | 1,362 | ||
| Fianna Fáil | Michael Lawlor* | 5.82 | 826 | 875 | 888 | 893 | 901 | 914 | 1,059 | 1,072 | 1,089 | 1,138 | |||||
| Labour Party | Barry Nevin | 5.36 | 760 | 777 | 876 | 885 | 905 | 942 | 969 | 1,059 | 1,112 | 1,267 | 1,339 | 1,378 | 1,387 | ||
| Fine Gael | Sarah Wray | 4.57 | 649 | 667 | 674 | 690 | 694 | 722 | 734 | 770 | |||||||
| Independent | Eugene Finnegan | 3.60 | 511 | 530 | 546 | 556 | 575 | 633 | 787 | 843 | |||||||
| Fianna Fáil | Damien Meaney | 3.53 | 501 | 511 | 521 | 526 | 534 | 544 | |||||||||
| Independent | Darren Murphy | 3.07 | 435 | 449 | 457 | 491 | 508 | 574 | 600 | ||||||||
| Independent | Wayne Tobin | 2.49 | 353 | 365 | 372 | 383 | 396 | ||||||||||
| Independent | Emma Kelly | 0.79 | 112 | 139 | 143 | ||||||||||||
| Electorate: 24,360 Valid: 14,186 (58.23%) Spoilt: 180 Quota: 1,774 Turnout: 14,366 (58.97%) | |||||||||||||||||
Greystones
| Greystones - 4 seats | ||||||||||||
|---|---|---|---|---|---|---|---|---|---|---|---|---|
| Party | Candidate | FPv% | Count 1 | Count 2 | Count 3 | Count 4 | Count 5 | Count 6 | Count 7 | Count 8 | ||
| Fine Gael | Simon Harris | 31.76 | 3,119 | |||||||||
| Labour Party | Tom Fortune* | 16.42 | 1,617 | 1,793 | 1,840 | 1,948 | 2,155 | |||||
| Fine Gael | George Jones* | 12.04 | 1,182 | 1,535 | 1,551 | 1,582 | 1,645 | 1,681 | 1,807 | 2,014 | ||
| Fine Gael | Derek Mitchell* | 11.30 | 1,110 | 1,383 | 1,398 | 1,426 | 1,494 | 1,536 | 1,614 | 1,786 | ||
| Fianna Fáil | Eleanor Roche | 7.01 | 688 | 731 | 742 | 765 | 793 | 803 | ||||
| Fianna Fáil | Kathleen Kelleher* | 6.57 | 645 | 733 | 741 | 767 | 801 | 816 | 1,176 | 1,297 | ||
| Independent | Chris Maloney | 5.29 | 519 | 602 | 648 | 717 | 774 | 812 | 895 | |||
| Green Party | Caroline Burrell | 4.27 | 419 | 488 | 506 | 541 | ||||||
| Sinn Féin | Anthony McCoy | 3.39 | 333 | 379 | 399 | |||||||
| Independent | Charlie Keddy | 1.90 | 187 | 211 | ||||||||
| Electorate: 16,176 Valid: 9,819 (60.70%) Spoilt: 75 Quota: 1,964 Turnout: 9,894 (61.16%) | ||||||||||||
Wicklow
| Wicklow - 5 seats | |||||||||
|---|---|---|---|---|---|---|---|---|---|
| Party | Candidate | FPv% | Count 1 | Count 2 | Count 3 | Count 4 | Count 5 | ||
| Labour Party | Jimmy O'Shaughnessy* | 16.08 | 1,918 | 1,983 | 2,104 | ||||
| Fine Gael | Irene Winters* | 14.55 | 1,736 | 1,813 | 2,019 | ||||
| Fianna Fáil | Pat Casey* | 13.37 | 1,595 | 1,732 | 1,767 | 2,264 | |||
| Sinn Féin | John Snell | 12.79 | 1,526 | 1,592 | 1,650 | 1,879 | 1,938 | ||
| Labour Party | Conal Kavanagh* | 12.01 | 1,433 | 1,506 | 1,657 | 1,800 | 1,909 | ||
| Fine Gael | Declan O'Neill | 11.29 | 1,347 | 1,360 | 1,422 | 1,492 | 1,550 | ||
| Fianna Fáil | Jane Dignam | 7.95 | 949 | 1,123 | 1,174 | ||||
| Green Party | Pat Kavanagh | 6.24 | 744 | 777 | |||||
| Fianna Fáil | Gail Dunne | 5.72 | 682 | ||||||
| Electorate: 19,547 Valid: 11,930 (61.03%) Spoilt: 149 Quota: 1,989 Turnout: 12,079 (61.79%) | |||||||||
External links
| Preceded by 2004 Wicklow County Council election |
Wicklow County Council elections | Succeeded by 2014 Wicklow County Council election |
This article is issued from Wikipedia. The text is licensed under Creative Commons - Attribution - Sharealike. Additional terms may apply for the media files.