2009 Kildare County Council election
An election to Kildare County Council took place on 5 June 2009 as part of that year's Irish local elections. 25 councillors were elected from six electoral divisions by PR-STV voting for a five-year term of office.
| |||||||||||||||||||||||||||||||||
All 25 seats to Kildare County Council | |||||||||||||||||||||||||||||||||
|---|---|---|---|---|---|---|---|---|---|---|---|---|---|---|---|---|---|---|---|---|---|---|---|---|---|---|---|---|---|---|---|---|---|
| |||||||||||||||||||||||||||||||||
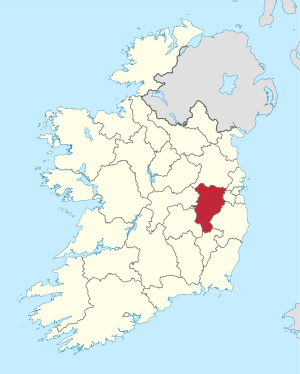 Map showing the area of Kildare County Council | |||||||||||||||||||||||||||||||||
| |||||||||||||||||||||||||||||||||
Results by party
| Party | Seats | ± | First Pref. votes | FPv% | ±% | |
|---|---|---|---|---|---|---|
| Fine Gael | 9 | +2 | 19,292 | 28.47% | ||
| Labour Party | 6 | +2 | 16,240 | 23.97% | ||
| Fianna Fáil | 6 | -4 | 16,036 | 23.67% | ||
| Independent | 4 | +1 | 13,685 | 20.20% | ||
| Green Party | 0 | -1 | 2,507 | 3.70% | ||
| Totals | 25 | - | 67,760 | 100% | — | |
Results by Electoral Area
Athy
| Athy - 4 seats | |||||||||
|---|---|---|---|---|---|---|---|---|---|
| Party | Candidate | FPv% | Count 1 | Count 2 | Count 3 | Count 4 | Count 5 | ||
| Labour Party | Mark Wall | 28.72 | 3,284 | ||||||
| Fianna Fáil | Martin Miley, Jnr* | 19.06 | 2,180 | 2,344 | |||||
| Fine Gael | Martin Heydon | 17.32 | 1,980 | 2,156 | 2,169 | 2,316 | |||
| Fianna Fáil | Mark Dalton* | 12.40 | 1,418 | 1,558 | 1,580 | 1,773 | 1,880 | ||
| Fine Gael | Richard Daly | 9.34 | 1,068 | 1,273 | 1,282 | 1,502 | 2,086 | ||
| Fine Gael | Billy Hillis* | 7.35 | 840 | 919 | 922 | 991 | |||
| Independent | John Lawler | 5.82 | 665 | 897 | 906 | ||||
| Electorate: 22,177 Valid: 11,435 (51.56%) Spoilt: 218 Quota: 2,288 Turnout: 11,653 (52.55%) | |||||||||
Celbridge
| Celbridge - 6 seats | |||||||||||
|---|---|---|---|---|---|---|---|---|---|---|---|
| Party | Candidate | FPv% | Count 1 | Count 2 | Count 3 | Count 4 | Count 5 | Count 6 | Count 7 | ||
| Independent | Catherine Murphy* | 25.82 | 4,499 | ||||||||
| Labour Party | Kevin Byrne* | 16.86 | 2,937 | ||||||||
| Labour Party | John McGinley* | 12.33 | 2,149 | 2,338 | 2,495 | ||||||
| Fine Gael | Senan Griffin* | 7.91 | 1,378 | 1,498 | 1,525 | 1,553 | 1,648 | 1,900 | 2,091 | ||
| Fianna Fáil | Paul Kelly* | 6.44 | 1,122 | 1,291 | 1,306 | 1,320 | 2,005 | 2,132 | 2,472 | ||
| Fine Gael | Katie Ridge* | 6.19 | 1,078 | 1,276 | 1,372 | 1,415 | 1,500 | 1,851 | 2,020 | ||
| Labour Party | Colm Purcell | 5.92 | 1,032 | 1,555 | 1,626 | 1,725 | 1,769 | 2,005 | 2,444 | ||
| Green Party | Shane Fitzgerald | 5.60 | 975 | 1,259 | 1,281 | 1,358 | 1,453 | 1,630 | |||
| Fine Gael | Joe Neville | 5.46 | 952 | 1,224 | 1,231 | 1,254 | 1,272 | ||||
| Fianna Fáil | Brid Feely | 3.44 | 599 | 660 | 675 | 687 | |||||
| Fianna Fáil | Paul Ward | 2.58 | 450 | 489 | 504 | 519 | |||||
| Independent | Ivan Farina | 1.45 | 252 | 406 | 428 | ||||||
| Electorate: 35,078 Valid: 17,423 (49.67) Spoilt: 153 Quota: 2,490 Turnout: 17,576 (50.11%) | |||||||||||
Clane
| Clane - 4 seats | |||||||||||||
|---|---|---|---|---|---|---|---|---|---|---|---|---|---|
| Party | Candidate | FPv% | Count 1 | Count 2 | Count 3 | Count 4 | Count 5 | Count 6 | Count 7 | Count 8 | Count 9 | ||
| Fine Gael | Brendan Weld* | 21.60 | 2,288 | ||||||||||
| Fianna Fáil | Liam Doyle* | 11.85 | 1,255 | 1,264 | 1,276 | 1,325 | 1,361 | 1,720 | 1,825 | 2,388 | |||
| Independent | Padraig McEvoy | 11.43 | 1,211 | 1,269 | 1,292 | 1,518 | 1,601 | 1,647 | 1,790 | 2,071 | 2,180 | ||
| Fianna Fáil | P.J. Sheridan | 9.25 | 980 | 986 | 1,004 | 1,008 | 1,045 | 1,265 | 1,380 | ||||
| Independent | Jim Reilly | 8.90 | 943 | 972 | 976 | 996 | 1,037 | 1,134 | |||||
| Fine Gael | Seamus Langan | 8.80 | 932 | 942 | 1,022 | 1,039 | 1,124 | 1,183 | 1,530 | 1,617 | 1,681 | ||
| Fianna Fáil | Daragh Fitzpatrick* | 7.98 | 845 | 851 | 857 | 860 | 898 | ||||||
| Labour Party | Chris Rowland | 7.38 | 782 | 802 | 813 | 888 | 1,303 | 1,334 | 1,470 | 1,560 | 1,602 | ||
| Labour Party | Rose Devine | 6.85 | 726 | 771 | 783 | 799 | |||||||
| Independent | David Flanagan | 3.80 | 402 | 426 | 429 | ||||||||
| Independent | Leo Armstrong | 2.15 | 228 | ||||||||||
| Electorate: 20,439 Valid: 10,592 (51.82%) Spoilt: 126 Quota: 2,119 Turnout: 10,718 (52.44%) | |||||||||||||
Kildare
| Kildare - 6 seats | ||||||||||||||
|---|---|---|---|---|---|---|---|---|---|---|---|---|---|---|
| Party | Candidate | FPv% | Count 1 | Count 2 | Count 3 | Count 4 | Count 5 | Count 6 | Count 7 | Count 8 | Count 9 | Count 10 | ||
| Independent | Paddy Kennedy | 11.81 | 1,869 | 1,949 | 2,086 | 2,459 | ||||||||
| Fianna Fáil | Suzanne Doyle* | 10.45 | 1,654 | 1,692 | 1,717 | 1,757 | 1,769 | 1,834 | 2,203 | 2,328 | ||||
| Fine Gael | Michael Nolan, Jnr* | 9.99 | 1,582 | 1,620 | 1,671 | 1,798 | 1,846 | 2,100 | 2,357 | |||||
| Fianna Fáil | Fiona O'Loughlin* | 9.54 | 1,511 | 1,562 | 1,586 | 1,638 | 1,659 | 1,881 | 2,410 | |||||
| Fine Gael | Tony O'Donnell | 9.48 | 1,500 | 1,544 | 1,558 | 1,583 | 1,590 | 2,235 | ||||||
| Fine Gael | Mark Stafford | 9.28 | 1,469 | 1,518 | 1,528 | 1,549 | 1,564 | |||||||
| Fianna Fáil | Pat Black* | 8.94 | 1,415 | 1,444 | 1,473 | 1,578 | 1,597 | 1,617 | ||||||
| Labour Party | Francis Browne* | 8.48 | 1,343 | 1,424 | 1,513 | 1,620 | 1,657 | 1,782 | 1,885 | 1,896 | 1,942 | 1,974 | ||
| Labour Party | Adrian Kane | 8.47 | 1,341 | 1,411 | 1,527 | 1,612 | 1,650 | 1,761 | 1,844 | 1,856 | 1,900 | 1,911 | ||
| Independent | Murty Aspell | 5.53 | 876 | 937 | 1,013 | |||||||||
| Sinn Féin | Seán Downey | 4.18 | 662 | 686 | ||||||||||
| Green Party | John Hardy | 2.32 | 367 | |||||||||||
| Independent | John Tierney | 1.53 | 242 | |||||||||||
| Electorate: 33,921 Valid: 15,831 (46.67%) Spoilt: 240 Quota: 2,262 Turnout: 16,071 (47.38%) | ||||||||||||||
Naas
| Naas - 5 seats | |||||||||||
|---|---|---|---|---|---|---|---|---|---|---|---|
| Party | Candidate | FPv% | Count 1 | Count 2 | Count 3 | Count 4 | Count 5 | Count 6 | Count 7 | ||
| Fine Gael | Anthony Lawlor | 16.08 | 2,113 | 2,140 | 2,207 | ||||||
| Fine Gael | Darren Scully | 16.07 | 2,112 | 2,151 | 2,222 | ||||||
| Labour Party | Paddy McNamara* | 13.83 | 1,817 | 1,838 | 1,930 | 2,420 | |||||
| Independent | Seamus Moore | 12.42 | 1,632 | 1,688 | 1,952 | 2,086 | 2,174 | 2,194 | |||
| Fianna Fáil | Willie Callaghan* | 10.07 | 1,323 | 1,435 | 1,479 | 1,526 | 1,541 | 1,544 | 2,144 | ||
| Green Party | J.J. Power* | 8.87 | 1,165 | 1,201 | 1,281 | 1,377 | 1,492 | 1,499 | 1,716 | ||
| Fianna Fáil | James Lawless | 7.39 | 971 | 1,040 | 1,075 | 1,097 | 1,108 | 1,109 | |||
| Labour Party | Pat McCarthy | 6.31 | 829 | 847 | 908 | ||||||
| Independent | Donal Corcoran | 5.61 | 737 | 786 | |||||||
| Fianna Fáil | Tiernach Cassidy | 2.38 | 313 | ||||||||
| Independent | David Monaghan | 0.98 | 129 | ||||||||
| Electorate: 25,810 Valid: 13,141 (50.91%) Spoilt: 135 Quota: 2,191 Turnout: 13,276 (51.44%) | |||||||||||
External links
| Preceded by 2004 Kildare County Council election |
Kildare County Council elections | Succeeded by 2014 Kildare County Council election |
This article is issued from Wikipedia. The text is licensed under Creative Commons - Attribution - Sharealike. Additional terms may apply for the media files.