2009 Donegal County Council election
An election to Donegal County Council took place on 2 June 2009 as part of that year's Irish local elections. 29 councillors were elected from five electoral divisions by PR-STV voting for a five-year term of office.
| |||||||||||||||||||||||||||||||||||||
All 29 seats to Donegal County Council | |||||||||||||||||||||||||||||||||||||
|---|---|---|---|---|---|---|---|---|---|---|---|---|---|---|---|---|---|---|---|---|---|---|---|---|---|---|---|---|---|---|---|---|---|---|---|---|---|
| |||||||||||||||||||||||||||||||||||||
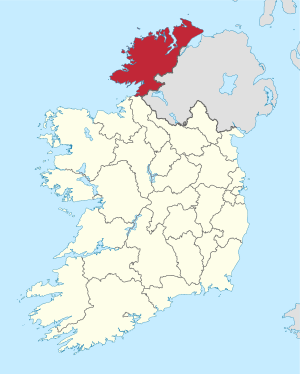 Map showing the area of Donegal County Council | |||||||||||||||||||||||||||||||||||||
| |||||||||||||||||||||||||||||||||||||
Results by party
| Party | Seats | ± | First Pref. votes | FPv% | ±% | |
|---|---|---|---|---|---|---|
| Fianna Fáil | 10 | -4 | 25,183 | 34.15 | ||
| Fine Gael | 8 | - | 18,296 | 24.81 | ||
| Sinn Féin | 4 | - | 9,950 | 13.49 | ||
| Labour Party | 2 | +2 | 5,091 | 6.90 | ||
| Independent | 5 | +4 | 14,452 | 19.60 | ||
| Independent Fianna Fáil | 0 | -2 | 0 | 0 | ||
| Totals | 29 | - | 73,747 | 100% | — | |
Results by Electoral Area
- Sitting in italics
Donegal
| Donegal - 5 seats | ||||||||||||||
|---|---|---|---|---|---|---|---|---|---|---|---|---|---|---|
| Party | Candidate | FPv% | Count 1 | Count 2 | Count 3 | Count 4 | Count 5 | Count 6 | Count 7 | Count 8 | Count 9 | Count 10 | ||
| Fine Gael | Barry O'Neill* | 14.61 | 2,189 | 2,225 | 2,287 | 2,301 | 2,376 | 2,406 | 2,545 | |||||
| Fianna Fáil | Sean McEniff* | 12.47 | 1,869 | 1,890 | 1,903 | 1,921 | 1,942 | 2,053 | 2,177 | 2,191 | 2,196 | 2,218 | ||
| Fianna Fáil | Brendan Byrne* | 10.29 | 1,542 | 1,549 | 1,558 | 1,602 | 1,613 | 1,839 | 1,883 | 2,204 | 2,234 | 2,239 | ||
| Independent | Thomas Pringle* | 10.02 | 1,501 | 1,515 | 1,596 | 1,751 | 1,872 | 1,953 | 2,285 | 2,600 | ||||
| Fine Gael | John Boyle* | 9.77 | 1,464 | 1,468 | 1,508 | 1,598 | 1,679 | 1,756 | 1,818 | 2,307 | 2,356 | 2,365 | ||
| Independent | Tom Conaghan | 8.14 | 1,220 | 1,246 | 1,336 | 1,450 | 1,658 | 1,953 | 2,079 | 2,168 | 2,186 | 2,197 | ||
| Fine Gael | Barry McShane | 8.12 | 1,217 | 1,220 | 1,251 | 1,288 | 1,329 | 1,350 | 1,399 | |||||
| Sinn Féin | Jim McLoughlin | 6.51 | 975 | 997 | 1,038 | 1,112 | 1,181 | 1,254 | ||||||
| Fianna Fáil | Jonathan Kennedy* | 5.57 | 835 | 853 | 909 | 977 | 1,108 | |||||||
| Independent | Ernan McGettigan | 4.86 | 728 | 740 | 838 | 871 | ||||||||
| Fine Gael | Tommy Quinn | 4.34 | 651 | 662 | 690 | |||||||||
| Labour Party | Seamus Carbin | 3.86 | 579 | 594 | ||||||||||
| Independent | Patricia McCafferty | 0.77 | 116 | |||||||||||
| Independent | Eamonn McGinty | 0.67 | 101 | |||||||||||
| Electorate: 22,706 Valid: 14,987 (66.0%) Spoilt: 141 Quota: 2,498 Turnout: 15,128 (66.93%) | ||||||||||||||
Glenties
| Glenties - 5 seats | ||||||||||||
|---|---|---|---|---|---|---|---|---|---|---|---|---|
| Party | Candidate | FPv% | Count 1 | Count 2 | Count 3 | Count 4 | Count 5 | Count 6 | Count 7 | Count 8 | ||
| Independent | Seamus O Domhnaill | 13.50 | 2,011 | 2,021 | 2,095 | 2,179 | 2,218 | 2,349 | 2,502 | |||
| Fianna Fáil | David Alcorn* | 10.43 | 1,554 | 1,558 | 1,563 | 1,598 | 1,641 | 1,661 | 1,804 | 2,464 | ||
| Fianna Fáil | Dr.Joe Kelly* | 9.92 | 1,478 | 1,482 | 1,558 | 1,582 | 1,595 | 1,675 | 1,712 | 1,843 | ||
| Independent | Pádraig Doherty* | 9.83 | 1,465 | 1,470 | 1,502 | 1,650 | 1,679 | 1,869 | 2,031 | 2,115 | ||
| Fine Gael | Terence Slowey* | 9.44 | 1,406 | 1,541 | 1,604 | 1,758 | 2,142 | 2,154 | 2,390 | 2,564 | ||
| Sinn Féin | Therese Gallagher* | 8.98 | 1,338 | 1,359 | 1,370 | 1,417 | 1,471 | 2,004 | 2,273 | 2,551 | ||
| Fianna Fáil | Enda Bonner* | 8.76 | 1,306 | 1,334 | 1,335 | 1,358 | 1,492 | 1,499 | 1,599 | |||
| Labour Party | Seamus Rogers | 7.13 | 1,062 | 1,153 | 1,175 | 1,259 | 1,378 | 1,425 | ||||
| Sinn Féin | John O Fearraigh | 6.84 | 1,019 | 1,021 | 1,045 | 1,090 | 1,096 | |||||
| Independent | Francis Brennan | 5.72 | 853 | 893 | 897 | 901 | ||||||
| Fine Gael | Mairead NicSuibhne | 4.29 | 624 | 630 | 708 | |||||||
| Fine Gael | Martin Terry | 2.79 | 416 | 420 | ||||||||
| Labour Party | John Kelly | 2.48 | 369 | |||||||||
| Electorate: 22,829 Valid: 14,901 (65.27%) Spoilt: 185 Quota: 2,484 Turnout: 15,086 (66.08%) | ||||||||||||
Inishowen
| Inishowen - 7 seats | ||||||||||||||||
|---|---|---|---|---|---|---|---|---|---|---|---|---|---|---|---|---|
| Party | Candidate | FPv% | Count 1 | Count 2 | Count 3 | Count 4 | Count 5 | Count 6 | Count 7 | Count 8 | Count 9 | Count 10 | Count 11 | Count 12 | ||
| Sinn Féin | Pádraig MacLochlainn* | 13.25 | 2,131 | |||||||||||||
| Fine Gael | Bernard McGuinness* | 11.80 | 1,899 | 1,904 | 1,921 | 1,943 | 2,042 | |||||||||
| Fianna Fáil | Charlie McConalogue | 10.87 | 1,749 | 1,754 | 1,763 | 1,786 | 1,795 | 1,796 | 1,996 | 2,137 | ||||||
| Fine Gael | Mickey Doherty | 10.25 | 1,649 | 1,653 | 1,690 | 1,711 | 1,809 | 1,823 | 1,944 | 2,042 | ||||||
| Fianna Fáil | Rena Donaghey* | 8.87 | 1,427 | 1,438 | 1,442 | 1,508 | 1,516 | 1,516 | 1,606 | 1,637 | 1,918 | 1,938 | 2,003 | 2,009 | ||
| Fine Gael | John Ryan | 8.32 | 1,338 | 962 | 1,347 | 1,350 | 1,409 | 1,779 | 1,793 | 1,801 | 1,835 | 2,134 | ||||
| Fianna Fáil | Paul Canning | 7.63 | 1,227 | 1,233 | 1,238 | 1,250 | 1,303 | 1,304 | 1,344 | 1,358 | 1,428 | 1,440 | 1,454 | 1,460 | ||
| Independent | Nicholas Crossan | 5.94 | 956 | 965 | 994 | 1,069 | 1,077 | 1,077 | 1,086 | 1,140 | ||||||
| Labour Party | Martin Farren | 5.48 | 881 | 885 | 950 | 1,015 | 1,031 | 1,031 | 1,228 | 1,320 | 1,427 | 1,440 | 1,480 | 1,499 | ||
| Fianna Fáil | Marion McDonald* | 4.56 | 733 | 735 | 758 | 776 | 782 | 782 | ||||||||
| Fine Gael | Keith Roulston | 4.37 | 703 | 704 | 705 | 718 | ||||||||||
| Sinn Féin | Seán Ruddy | 4.17 | 671 | 728 | 740 | 775 | 784 | 785 | 803 | |||||||
| Green Party | Sheenagh McMahon | 3.03 | 487 | 493 | 497 | |||||||||||
| Independent | Bartholemew Connell | 1.47 | 236 | 237 | ||||||||||||
| Electorate: 28,754 Valid: 16,087 (55.95%) Spoilt: 249 Quota: 2,011 Turnout: 16,336 (56.81%) | ||||||||||||||||
Letterkenny
| Letterkenny - 7 seats | ||||||||||||||
|---|---|---|---|---|---|---|---|---|---|---|---|---|---|---|
| Party | Candidate | FPv% | Count 1 | Count 2 | Count 3 | Count 4 | Count 5 | Count 6 | Count 7 | Count 8 | Count 9 | Count 10 | ||
| Fianna Fáil | Ciaran Brogan* | 13.10 | 2,522 | |||||||||||
| Fianna Fáil | Liam Blaney* | 11.50 | 2,214 | 2,223 | 2,247 | 2,258 | 2,300 | 2,486 | ||||||
| Fianna Fáil | Dessie Larkin* | 8.45 | 1,628 | 1,645 | 1,690 | 1,727 | 1,763 | 1,786 | 1,948 | 2,300 | 2,310 | 2,321 | ||
| Fine Gael | Noel McBride* | 11.62 | 1,593 | 1,601 | 1,626 | 1,630 | 1,810 | 1,992 | 2,300 | 2,502 | ||||
| Sinn Féin | Mick Quinn | 9.31 | 1,590 | 1,618 | 1,727 | 1,734 | 1,751 | 1,883 | 1,961 | 2,202 | 2,211 | 2,219 | ||
| Fianna Fáil | Michael McBride | 7.69 | 1,481 | 1,486 | 1,495 | 1,512 | 1,557 | 1,650 | 1,678 | |||||
| Independent | Jimmy Harte* | 7.63 | 1,469 | 1,521 | 1,647 | 1,658 | 1,746 | 1,845 | 2,126 | 2,218 | 2,224 | 2,231 | ||
| Independent | Ian McGarvey* | 7.10 | 1,367 | 1,388 | 1,458 | 1,463 | 1,557 | 1,799 | 1,886 | 2,097 | 2,125 | 2,159 | ||
| Independent | Donal Cullen | 6.25 | 1,203 | 1,224 | 1,273 | 1,278 | 1,291 | |||||||
| Fine Gael | Joanne Sweeney-Burke | 5.81 | 1,119 | 1,133 | 1,298 | 1,302 | 1,433 | 1,585 | 1,880 | 2,052 | 2,093 | 2,111 | ||
| Fine Gael | Paddy Gildea | 5.41 | 1,042 | 1,063 | 1,103 | 1,112 | 1,443 | 1,465 | ||||||
| Fine Gael | John Gibbons | 5.23 | 1,007 | 431 | 1,017 | 1,042 | 1,046 | |||||||
| Labour Party | Siobhan McLoughlin | 3.81 | 734 | 775 | ||||||||||
| Green Party | Frank Gallagher | 1.50 | 288 | |||||||||||
| Electorate: 29,722 Valid: 19,257 (64.79%) Spoilt: 261 Quota: 2,408 Turnout: 19,518 (65.67%) | ||||||||||||||
Stranorlar
| Stranorlar - 5 seats | |||||||||
|---|---|---|---|---|---|---|---|---|---|
| Party | Candidate | FPv% | Count 1 | Count 2 | Count 3 | Count 4 | Count 5 | ||
| Sinn Féin | Cora Harvey | 19.05 | 2,226 | ||||||
| Fianna Fáil | Patrick McGowan* | 14.75 | 1,724 | 1,769 | 1,913 | 2,013 | |||
| Labour Party | Frank McBrearty, Jnr | 12.54 | 1,466 | 1,535 | 1,590 | 1,664 | 1,873 | ||
| Fianna Fáil | Gerry Crawford* | 12.23 | 1,429 | 1,444 | 1,540 | 1,562 | 1,667 | ||
| Fine Gael | Martin Harley | 10.19 | 1,191 | 1,236 | 1,301 | 1,614 | 1,994 | ||
| Fine Gael | Stephen McNamee | 9.64 | 1,127 | 1,146 | 1,206 | 1,432 | 1,502 | ||
| Independent | John Gallagher | 8.92 | 1,042 | 1,080 | 1,247 | 1,301 | |||
| Fine Gael | Gareth Reid | 7.12 | 832 | 854 | 871 | ||||
| Fianna Fáil | Peter Carlin | 3.98 | 465 | 478 | |||||
| Independent | Alan Dooher | 1.57 | 184 | 196 | |||||
| Electorate: 19,305 Valid: 11,686 (60.53%) Spoilt: 154 Quota: 1,948 Turnout: 11,840 (61.33%) | |||||||||
External links
| Preceded by 2004 Donegal County Council election |
Donegal County Council elections | Succeeded by 2014 Donegal County Council election |
This article is issued from Wikipedia. The text is licensed under Creative Commons - Attribution - Sharealike. Additional terms may apply for the media files.