1979 Kerry County Council election
An election to Kerry County Council took place on 7 June 1979 as part of that year's Irish local elections. 26 councillors were elected from four electoral divisions by PR-STV voting.
| ||||||||||||||||||||||||||
All 26 seats to Kerry County Council | ||||||||||||||||||||||||||
|---|---|---|---|---|---|---|---|---|---|---|---|---|---|---|---|---|---|---|---|---|---|---|---|---|---|---|
| ||||||||||||||||||||||||||
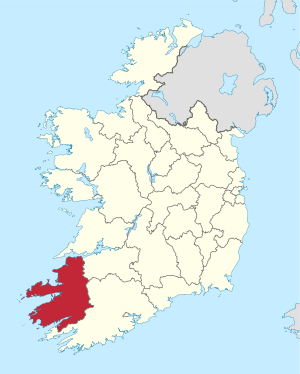 Map showing the area of Kerry County Council | ||||||||||||||||||||||||||
| ||||||||||||||||||||||||||
Results by party
| Party | Seats | ± | First Pref. votes | FPv% | ±% | |
|---|---|---|---|---|---|---|
| Fianna Fáil | 14 | 27,371 | 44.70% | |||
| Fine Gael | 7 | 17,175 | 28.05% | |||
| Labour Party | 2 | 7,647 | 12.49% | |||
| Sinn Féin | 1 | 3,152 | 5.15% | |||
| Sinn Féin - The Workers' Party | 0 | 1,159 | 1.89% | |||
| Independent | 2 | 4,732 | 7.73% | |||
| Totals | 26 | 61,236 | 100% | |||
Results by Electoral Area
Killarney
| Killarney - 6 seats | |||||||||||
|---|---|---|---|---|---|---|---|---|---|---|---|
| Party | Candidate | FPv% | Count 1 | Count 2 | Count 3 | Count 4 | Count 5 | Count 6 | Count 7 | ||
| Labour Party | Senator Michael Moynihan | 19.51% | 2,737 | ||||||||
| Fianna Fáil | Jackie Healy-Rae | 16.35% | 2,294 | ||||||||
| Fianna Fáil | Tom Fleming | 14.48% | 2,032 | ||||||||
| Fianna Fáil | Patrick J. Cronin | 11.22% | 1,574 | 1,644 | 1,806 | 1,832 | 1,861 | 1,877 | 1,946 | ||
| Fine Gael | Paudie Connor | 8.27% | 1,161 | 1,308 | 1,329 | 1,355 | 1,567 | 1,568 | 1,883 | ||
| Sinn Féin - The Workers' Party | Redmond Sullivan | 8.26% | 1,159 | 1,324 | 1,362 | 1,412 | 1,543 | 1,545 | 1,651 | ||
| Fine Gael | Thomas Dennehy | 7.74% | 1,086 | 1,130 | 1,139 | 1,203 | 1,383 | 1,389 | |||
| Fine Gael | Christopher McSweeney | 7.11% | 998 | 1,101 | 1,120 | 1,184 | 1,401 | 1,403 | 2,068 | ||
| Fine Gael | Tom Randles | 5.37% | 753 | 841 | 879 | 895 | |||||
| Labour Party | Joan Winter | 1.69% | 237 | 352 | 354 | ||||||
| Electorate: 18,656 Valid: 14,031 (75.21%) Spoilt: 213 (1.14%) Quota: 2,005 Turnout: 14,244 (76.35%) | |||||||||||
Killorglin
| Killorglin - 6 seats | ||||||||||
|---|---|---|---|---|---|---|---|---|---|---|
| Party | Candidate | FPv% | Count 1 | Count 2 | Count 3 | Count 4 | Count 5 | Count 6 | ||
| Fianna Fáil | Mary O'Donoghue | 15.07% | 1,811 | |||||||
| Fine Gael | Michael Connor-Scarteen | 14.23% | 1,710 | 1,711 | 1,730 | |||||
| Fianna Fáil | Thomas Cahill | 11.71% | 1,408 | 1,415 | 1,482 | 1,586 | 1,633 | 1,829 | ||
| Fine Gael | Danny Kissane | 9.89% | 1,189 | 1,189 | 1,267 | 1,502 | 1,529 | 1,552 | ||
| Fianna Fáil | Ted O'Connor | 9.49% | 1,141 | 1,160 | 1,196 | 1,231 | 1,272 | 1,626 | ||
| Fine Gael | Dan Barry | 9.38% | 1,127 | 1,146 | 1,160 | 1,220 | 1,334 | 1,355 | ||
| Independent | Michael O'Connell | 9.14% | 1,098 | 1,119 | 1,196 | 1,266 | 1,472 | 1,604 | ||
| Fianna Fáil | John Joe Brien | 8.45% | 1,016 | 1,030 | 1,035 | 1,038 | 1,069 | |||
| Sinn Féin | Tim Garvey | 4.80% | 577 | 588 | 612 | 633 | ||||
| Fine Gael | Teresa Murphy | 4.29% | 516 | 516 | 583 | |||||
| Labour Party | Sean Moriarty | 3.54% | 426 | 427 | ||||||
| Electorate: 16,620 Valid: 12,019 (72.32%) Spoilt: 215 (1.76%) Quota: 1,718 Turnout: 12,234 (73.61%) | ||||||||||
Listowel
| Listowel- 6 seats | ||||||||||||||
|---|---|---|---|---|---|---|---|---|---|---|---|---|---|---|
| Party | Candidate | FPv% | Count 1 | Count 2 | Count 3 | Count 4 | Count 5 | Count 6 | Count 7 | Count 8 | Count 9 | Count 10 | ||
| Fianna Fáil | Noel Brassil | 11.53% | 1,724 | 1,742 | 1,762 | 1,764 | 1,821 | 1,827 | 1,851 | 1,882 | 1,916 | 1,929 | ||
| Fianna Fáil | Kit Ahern TD | 11.38% | 1,701 | 1,704 | 1,793 | 1,823 | 1,836 | 1,920 | 1,948 | 2,040 | 2,286 | |||
| Fine Gael | Senator Gerard Lynch | 10.77% | 1,610 | 1,612 | 1,644 | 1,773 | 1,880 | 1,940 | 2,154 | |||||
| Fianna Fáil | Dan Kiely | 10.34% | 1,546 | 1,547 | 1,574 | 1,583 | 1,589 | 1,706 | 1,815 | 1,874 | 1,982 | 2,015 | ||
| Sinn Féin | Robert Beasley | 10.17% | 1,521 | 1,523 | 1,539 | 1,555 | 1,564 | 1,604 | 1,660 | 1,842 | 1,979 | 1,993 | ||
| Labour Party | John Joe O'Sullivan | 8.90% | 1,331 | 1,343 | 1,351 | 1,357 | 1,483 | 1,493 | 1,541 | 1,612 | 1,770 | 1,787 | ||
| Fianna Fáil | Eamon Walsh | 8.67% | 1,296 | 1,298 | 1,362 | 1,378 | 1,378 | 1,469 | 1,487 | 1,605 | 1,794 | 1,859 | ||
| Independent | Jack Larkin | 6.88% | 1,028 | 1,028 | 1,074 | 1,173 | 1,187 | 1,268 | 1,325 | 1,480 | ||||
| Fine Gael | John Francis Ahern | 4.93% | 737 | 738 | 745 | 773 | 793 | 832 | 1,002 | |||||
| Fine Gael | Jeremiah O'Connor | 4.45% | 666 | 667 | 671 | 707 | 772 | 805 | ||||||
| Independent | Thomas Sheehan | 3.83% | 573 | 573 | 591 | 598 | 599 | |||||||
| Fine Gael | Tom Lawlor | 2.74% | 410 | 423 | 425 | 435 | ||||||||
| Fine Gael | Brendan Halloran | 2.64% | 395 | 396 | 407 | |||||||||
| Fianna Fáil | Tony O'Callaghan | 2.35% | 351 | 352 | ||||||||||
| Independent | Tom Dineen | 0.41% | 61 | |||||||||||
| Electorate: 19,867 Valid: 14,950 (75.25%) Spoilt: 230 (1.52%) Quota: 2,136 Turnout: 15,180 (76.41%) | ||||||||||||||
Tralee
| Tralee - 8 seats | |||||||||||
|---|---|---|---|---|---|---|---|---|---|---|---|
| Party | Candidate | FPv% | Count 1 | Count 2 | Count 3 | Count 4 | Count 5 | Count 6 | Count 7 | ||
| Fianna Fáil | Tom McEllistrim, Jnr TD | 18.26% | 3,695 | ||||||||
| Fianna Fáil | Denis Foley | 15.33% | 3,103 | ||||||||
| Labour Party | Dick Spring | 14.41% | 2,916 | ||||||||
| Fine Gael | Michael Begley TD | 11.07% | 2,240 | 2,258 | |||||||
| Independent | James Courtney | 9.75% | 1,972 | 2,073 | 2,115 | 2,185 | 2,233 | 2,278 | |||
| Fianna Fáil | Thomas Fitzgerald | 7.52% | 1,522 | 1,802 | 1,957 | 1,982 | 2,023 | 2,037 | 2,053 | ||
| Fianna Fáil | Michael Long | 5.72% | 1,157 | 1,715 | 1,973 | 2,026 | 2,058 | 2,286 | |||
| Fine Gael | John Blennerhassett | 5.62% | 1,138 | 1,340 | 1,514 | 1,729 | 2,204 | 2,719 | |||
| Sinn Féin | Michael Horgan | 5.21% | 1,054 | 1,184 | 1,286 | 1,387 | 1,447 | 1,492 | 1,532 | ||
| Fine Gael | Timothy Nelligan | 4.01% | 812 | 875 | 890 | 976 | 1,041 | ||||
| Fine Gael | Frank Gleasure | 3.10% | 627 | 721 | 829 | 946 | |||||
| Electorate: 29,352 Valid: 20,236 (68.94%) Spoilt: 289 (1.41%) Quota: 2,249 Turnout: 20,525 (69.93%) | |||||||||||
External links
- http://opac.oireachtas.ie/AWData/Library3/Library2/DL015721.pdf
- http://irelandelection.com/council.php?elecid=169&tab=constit&detail=yes&electype=5&councilid=12&electype=5
- https://irishelectionliterature.com/others-project/old-local-election-results/
| Dáil elections | |
|---|---|
| Seanad elections | |
| Presidential elections | |
| European elections | |
| Local elections | |
| Referendums | |
| |
This article is issued from Wikipedia. The text is licensed under Creative Commons - Attribution - Sharealike. Additional terms may apply for the media files.