2009 Dún Laoghaire–Rathdown County Council election
An election to Dún Laoghaire–Rathdown County Council took place on 5 June 2009 as part of that year's Irish local elections. 28 councillors were elected from six electoral divisions by PR-STV voting for a five-year term of office.
| |||||||||||||||||||||||||||||||||||||||||||||||||||||
All 28 seats to Dún Laoghaire–Rathdown County Council | |||||||||||||||||||||||||||||||||||||||||||||||||||||
|---|---|---|---|---|---|---|---|---|---|---|---|---|---|---|---|---|---|---|---|---|---|---|---|---|---|---|---|---|---|---|---|---|---|---|---|---|---|---|---|---|---|---|---|---|---|---|---|---|---|---|---|---|---|
| |||||||||||||||||||||||||||||||||||||||||||||||||||||
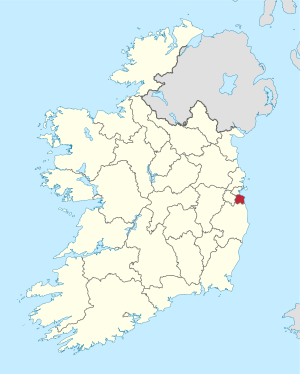 Map showing the area of Dún Laoghaire–Rathdown County Council | |||||||||||||||||||||||||||||||||||||||||||||||||||||
| |||||||||||||||||||||||||||||||||||||||||||||||||||||
Results by party
| Party | Seats | ± | First Pref. votes | FPv% | ±% | |
|---|---|---|---|---|---|---|
| Fine Gael | 11 | +2 | 28,754 | 34.35% | ||
| Labour Party | 8 | +2 | 19,094 | 22.81% | ||
| Fianna Fáil | 4 | -3 | 13,116 | 15.67% | ||
| Independent | 3 | +2 | 9,061 | 10.82% | ||
| People Before Profit | 2 | +2 | 6,266 | 7.49% | ||
| Green Party | 0 | -4 | 5,260 | 6.28% | ||
| Progressive Democrats | 0 | -1 | - | - | ||
| Totals | 28 | - | 83,708 | 100% | — | |
Results by Electoral Area
Ballybrack
| Ballybrack - 5 seats | |||||||||
|---|---|---|---|---|---|---|---|---|---|
| Party | Candidate | FPv% | Count 1 | Count 2 | Count 3 | Count 4 | Count 5 | ||
| Labour Party | Denis O'Callaghan* | 18.15 | 2,543 | ||||||
| Fine Gael | Maria Bailey* | 16.40 | 2,298 | 2,314 | 2,353 | ||||
| Labour Party | Carrie Smyth* | 15.77 | 2,210 | 2,350 | |||||
| People Before Profit | Hugh Lewis | 15.52 | 2,175 | 2,194 | 2,450 | ||||
| Fine Gael | Donal Marren* | 13.97 | 1,957 | 1,968 | 1,999 | 2,074 | '2,455 | ||
| Fianna Fáil | Gareth Crowe* | 7.52 | 1,053 | 1,057 | 1,077 | 1,428 | 1,605 | ||
| Green Party | Tom Kivlehan* | 5.22 | 732 | 739 | 779 | 846 | |||
| Fianna Fáil | Larry Lohan | 3.84 | 538 | 541 | 555 | ||||
| Sinn Féin | Eoin O Broin | 3.60 | 504 | 511 | |||||
| Electorate: 25,994 Valid: 14,010 (53.90%) Spoilt: 144 Quota: 2,336 Turnout: 14,154 (54.45%) | |||||||||
Blackrock
| Blackrock - 4 seats | ||||||||||
|---|---|---|---|---|---|---|---|---|---|---|
| Party | Candidate | FPv% | Count 1 | Count 2 | Count 3 | Count 4 | Count 5 | Count 6 | ||
| Fine Gael | Marie Baker* | 23.61 | 2,855 | |||||||
| Fine Gael | Barry Ward | 16.26 | 1,966 | 2,211 | 2,368 | 2,503 | ||||
| Labour Party | Niamh Bhreathnach* | 14.74 | 1,782 | 1,868 | 2,076 | 2,172 | 2,918 | |||
| Independent | Victor Boyhan | 13.25 | 1,602 | 1,635 | 1,775 | 1,880 | 2,070 | 2,416 | ||
| Fianna Fáil | Barry Conway* | 9.96 | 1,204 | 1,223 | 1,285 | 1,820 | 1,871 | 1,934 | ||
| Fianna Fáil | Fred Gilligan | 7.76 | 938 | 948 | 994 | |||||
| Labour Party | Ronan Farren | 7.74 | 936 | 957 | 1,105 | 1,151 | ||||
| Green Party | Ruairi Holohan* | 6.69 | 809 | 831 | ||||||
| Electorate: 21,619 Valid: 12,092 (55.93%) Spoilt: 87 Quota: 2,419 Turnout: 12,179 (56.33%) | ||||||||||
Dundrum
| Dundrum - 5 seats | ||||||||||||
|---|---|---|---|---|---|---|---|---|---|---|---|---|
| Party | Candidate | FPv% | Count 1 | Count 2 | Count 3 | Count 4 | Count 5 | Count 6 | Count 7 | Count 8 | ||
| Fine Gael | Jim O'Leary* | 10.64 | 3,583 | |||||||||
| Labour Party | Aidan Culhane* | 15.67 | 2,727 | 2,817 | 2,925 | |||||||
| Fine Gael | Pat Hand* | 13.48 | 2,347 | 2,751 | 2,832 | 2,878 | 3,012 | |||||
| Fianna Fáil | Aoife Brennan | 12.83 | 2,233 | 2,259 | 2,309 | 2,363 | 2,422 | 2,854 | 2,864 | 2,958 | ||
| Independent | Tony Fox* | 10.29 | 1,792 | 1,819 | 1,894 | 1,999 | 2,195 | 2,307 | 2,330 | 2,552 | ||
| Green Party | Terence Corish* | 7.85 | 1,367 | 1,407 | 1,451 | 1,511 | 1,654 | 1,757 | 1,780 | 2,163 | ||
| Fianna Fáil | Tony Kelly | 4.80 | 835 | 855 | 877 | 894 | 915 | |||||
| Labour Party | Veronica O'Doherty | 4.10 | 714 | 749 | 777 | 916 | 1,063 | 1,135 | 1,173 | |||
| Sinn Féin | Oonagh O'Reilly | 3.59 | 619 | 623 | 654 | |||||||
| Independent | Seamus O'Neill | 3.46 | 603 | 619 | 738 | 843 | ||||||
| Independent | Stephen O'Shea | 3.38 | 588 | 607 | ||||||||
| Electorate: 29,556 Valid: 17,408 (58.90%) Spoilt: 227 Quota: 2,902 Turnout: 17,635 (59.67%) | ||||||||||||
Dún Laoghaire
| Dún Laoghaire - 6 seats | |||||||||||||||
|---|---|---|---|---|---|---|---|---|---|---|---|---|---|---|---|
| Party | Candidate | FPv% | Count 1 | Count 2 | Count 3 | Count 4 | Count 5 | Count 6 | Count 7 | Count 8 | Count 9 | Count 10 | Count 11 | ||
| People Before Profit | Richard Boyd Barrett | 22.81 | 4,091 | ||||||||||||
| Fine Gael | John Bailey* | 17.05 | 3,058 | ||||||||||||
| Fine Gael | Mary Mitchell O'Connor* | 11.32 | 2,031 | 2,203 | 2,394 | 2,403 | 2,418 | 2,476 | 2,543 | 2,633 | |||||
| Fianna Fáil | Cormac Devlin* | 7.42 | 1,331 | 1,440 | 1,480 | 1,485 | 1,508 | 1,525 | 1,906 | 1,943 | 1,950 | 2,105 | 2,292 | ||
| Fine Gael | Tom O'Higgins* | 6.90 | 1,237 | 1,307 | 1,390 | 1,394 | 1,400 | 1,425 | 1,457 | 1,501 | 1,513 | 1,806 | 2,084 | ||
| Labour Party | Stephen Fitzpatrick | 6.43 | 1,154 | 1,362 | 1,408 | 1,416 | 1,453 | 1,489 | 1,514 | 1,888 | 1,907 | 2,165 | 2,536 | ||
| Green Party | Gene Feighery* | 5.81 | 1,042 | 1,216 | 1,241 | 1,246 | 1,273 | 1,329 | 1,367 | 1,441 | 1,453 | 1,637 | |||
| Independent | Trevor Patton | 5.59 | 1,002 | 1,131 | 1,150 | 1,187 | 1,219 | 1,311 | 1,351 | 1,385 | 1,388 | ||||
| Labour Party | Jane Dillon-Byrne* | 5.43 | 974 | 1,232 | 1,282 | 1,289 | 1,328 | 1,365 | 1,394 | 1,670 | 1,687 | 1,863 | 2,229 | ||
| Labour Party | Angela Timlin | 4.30 | 771 | 912 | 928 | 942 | 971 | 1,002 | 1,027 | ||||||
| Fianna Fáil | Peter O'Brien | 3.61 | 647 | 678 | 687 | 691 | 696 | 709 | |||||||
| Independent | James Coyle | 1.56 | 279 | 368 | 379 | 389 | 421 | ||||||||
| Sinn Féin | Brian McNally | 1.33 | 239 | 337 | 341 | 344 | |||||||||
| Independent | Brigid Timmons | 0.23 | 42 | 63 | 63 | ||||||||||
| Independent | Shane O'Neill | 0.20 | 36 | 64 | 65 | ||||||||||
| Electorate: 32,655 Valid: 17,934 (54.92%) Spoilt: 196 Quota: 2,563 Turnout: 18,130 (55.52%) | |||||||||||||||
Glencullen-Sandyford
| Glencullen-Sandyford - 4 seats | ||||||||||
|---|---|---|---|---|---|---|---|---|---|---|
| Party | Candidate | FPv% | Count 1 | Count 2 | Count 3 | Count 4 | Count 5 | Count 6 | ||
| Labour Party | Lettie McCarthy* | 25.98 | 2,818 | |||||||
| Fine Gael | Neale Richmond | 17.14 | 1,859 | 1,944 | 1,956 | 2,008 | 2,183 | |||
| Fine Gael | Tom Joyce* | 15.86 | 1,720 | 1,830 | 1,843 | 1,894 | 2,028 | 2,328 | ||
| Fianna Fáil | Tom Murphy | 11.39 | 1,236 | 1,293 | 1,297 | 1,352 | 1,437 | 2,122 | ||
| Fianna Fáil | John Byrne* | 8.96 | 972 | 1,017 | 1,028 | 1,088 | 1,168 | |||
| Labour Party | Aidan O'Sulliavan | 7.17 | 778 | 1,035 | 1,069 | 1,217 | 1,484 | 1,570 | ||
| Green Party | Adrianne Wyse | 6.04 | 655 | 717 | 776 | 901 | ||||
| Sinn Féin | Shaun Tracey | 5.91 | 641 | 664 | 678 | |||||
| Independent | Raymond Whitehead | 1.56 | 169 | 178 | ||||||
| Electorate: 20,556 Valid: 10,848 (52.77%) Spoilt: 109 Quota: 2,170 Turnout: 10,957 (53.30%) | ||||||||||
Stillorgan
| Stillorgan - 4 seats | |||||||||||
|---|---|---|---|---|---|---|---|---|---|---|---|
| Party | Candidate | FPv% | Count 1 | Count 2 | Count 3 | Count 4 | Count 5 | Count 6 | Count 7 | ||
| Fine Gael | Barry Saul | 22.79 | 2,602 | ||||||||
| Independent | Gearóid O'Keeffe* | 20.87 | 2,383 | ||||||||
| Labour Party | Richard Humphreys | 14.78 | 1,687 | 1,736 | 1,776 | 1,800 | 1,940 | 2,206 | 2,319 | ||
| Fine Gael | Louise Cosgrave* | 10.87 | 1,241 | 1,441 | 1,447 | 1,474 | 1,614 | 1,851 | 1,971 | ||
| Fianna Fáil | Gerry Horkan* | 9.94 | 1,135 | 1,151 | 1,167 | 1,180 | 1,258 | 1,328 | 2,075 | ||
| Fianna Fáil | Liam Dockery | 8.71 | 994 | 1,004 | 1,015 | 1,022 | 1,056 | 1,149 | |||
| Green Party | Meabh Cody | 5.74 | 655 | 678 | 705 | 719 | 831 | ||||
| Independent | Catriona Lawlor | 4.95 | 565 | 581 | 611 | 625 | |||||
| Sinn Féin | Seamus MacFloinn | 1.35 | 154 | 158 | |||||||
| Electorate: 19,760 Valid: 11,416 (57.77%) Spoilt: 99 Quota: 2,284 Turnout: 11,515 (58.27%) | |||||||||||
External links
| Preceded by 2004 Dún Laoghaire–Rathdown County Council election |
Dún Laoghaire–Rathdown County Council elections | Succeeded by 2014 Dún Laoghaire–Rathdown County Council election |
This article is issued from Wikipedia. The text is licensed under Creative Commons - Attribution - Sharealike. Additional terms may apply for the media files.