Sunderland City Council election, 2006
|
| |||||||||||||||||||||||||||||||||||||||||||||||
| |||||||||||||||||||||||||||||||||||||||||||||||
One third of 75 seats on Sunderland City Council 38 seats needed for a majority | |||||||||||||||||||||||||||||||||||||||||||||||
|---|---|---|---|---|---|---|---|---|---|---|---|---|---|---|---|---|---|---|---|---|---|---|---|---|---|---|---|---|---|---|---|---|---|---|---|---|---|---|---|---|---|---|---|---|---|---|---|
| |||||||||||||||||||||||||||||||||||||||||||||||
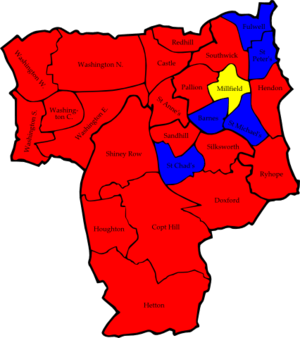 Map of the 2006 Sunderland City Council election results. Labour in red, Conservatives in blue, and Liberal Democrats in yellow. | |||||||||||||||||||||||||||||||||||||||||||||||
| |||||||||||||||||||||||||||||||||||||||||||||||
The 2006 Sunderland Council election took place on 4 May 2006 to elect members of Sunderland City Council in Tyne and Wear, England. One third of the Council was up for election and the Labour party stayed in overall control.[1][2]
Campaign
Before the election the council was composed of 60 Labour, 12 Conservative, 2 Liberal Democrat and 1 independent councillors.[3] In the period since the previous local elections in May 2004, there had been two by-elections, in Barnes Ward and Millfield Ward (with seats held by the Conservatives and Liberal Democrats respectively), and Doxford councillor Mike Tansey had left the Labour Party to sit as an Independent.[4]
In total 99 candidates stood in the election for the 25 seats that were being contested, with the Labour Party, Conservative Party and British National Party contesting every seat.[5] Other candidates included 22 from the Liberal Democrats and 1 from the Official Monster Raving Loony Party.[6] The council was safe for Labour, but the Conservatives were hoping to make gains in the wards of Doxford, St Peters, Washington East and Washington South.[3]
Sunderland was one of 4 local councils which had early polling stations available so voters could vote up to 2 weeks before the election.[7]
Election results
The results saw Labour keep a strong majority on the council after finishing just one seat down with 59 councillors.[6] The Labour leader of the council, Robert Symonds, was among those to hold his seat in Castle ward, but the party did lose 2 seats including St Peters to the Conservatives.[6][8] The other Labour loss was to the Liberal Democrats in Millfield, but Labour also gained Washington South from the Liberal Democrats.[8][9] This meant the Conservatives had 13 seats, the Liberal Democrats 2 and 1 independent.[6] Meanwhile, the British National Party failed to win any seats, but did win almost 15% of the vote.[9][10] Overall turnout was 32.2%, with 1,436 voters having used the early voting scheme, while 30,304 people used postal voting, which was 67.54% of those registered to vote by post.[6][10]
Following the election the leader of the Conservative group, Peter Wood, was challenged for the leadership by Lee Martin, but held on by one vote.[11]
| Party | Seats | Gains | Losses | Net gain/loss | Seats % | Votes % | Votes | +/− | |
|---|---|---|---|---|---|---|---|---|---|
| Labour | 19 | 1 | 2 | 76.0 | 40.5 | 27,546 | |||
| Conservative | 5 | 1 | 0 | 20.0 | 28.4 | 19,280 | |||
| Liberal Democrat | 1 | 1 | 1 | 4.0 | 15.7 | 10,683 | |||
| BNP | 0 | 0 | 0 | 0 | 14.6 | 9,948 | |||
| Independent | 0 | 0 | 0 | 0 | 0.7 | 449 | |||
| Monster Raving Loony | 0 | 0 | 0 | 0 | 0.1 | 48 | |||
This resulted in the following composition of the Council:
| Party | Previous Council | New Council | |
|---|---|---|---|
| Labour | 60 | 59 | |
| Conservatives | 12 | 13 | |
| Liberal Democrats | 2 | 2 | |
| Independent | 1 | 1 | |
| Total | 75 | 75 | |
| Working majority | 45 | 43 | |
Ward by ward results
| Party | Candidate | Votes | % | ± | |
|---|---|---|---|---|---|
| Conservative | Michael Arnott | 1,540 | 46.6 | ||
| Labour | David Errington | 779 | 23.6 | ||
| Liberal Democrat | Peter Taylor | 652 | 19.7 | ||
| BNP | Jason Dent | 334 | 10.1 | ||
| Majority | 761 | 23.0 | |||
| Turnout | 3,305 | 37.3 | -11.2 | ||
| Conservative hold | Swing | ||||
| Party | Candidate | Votes | % | ± | |
|---|---|---|---|---|---|
| Labour | Robert Symonds | 1,203 | 49.7 | ||
| BNP | Ian McDonald | 515 | 21.3 | ||
| Independent | Stephen Hanratty | 449 | 18.6 | ||
| Conservative | Alice Mclaren | 253 | 10.5 | ||
| Majority | 688 | 28.4 | |||
| Turnout | 2,420 | 28.4 | -7.9 | ||
| Labour hold | Swing | ||||
| Party | Candidate | Votes | % | ± | |
|---|---|---|---|---|---|
| Labour | Robert Heron | 1,372 | 50.7 | ||
| Conservative | David Wilson | 898 | 33.2 | ||
| BNP | Michael Webb | 438 | 16.2 | ||
| Majority | 474 | 17.5 | |||
| Turnout | 2,708 | 29.8 | -7.4 | ||
| Labour hold | Swing | ||||
| Party | Candidate | Votes | % | ± | |
|---|---|---|---|---|---|
| Labour | Elizabeth Gibson | 1,020 | 39.1 | ||
| Conservative | Peter Elliot-West | 758 | 29.1 | ||
| Liberal Democrat | James Major | 438 | 16.8 | ||
| BNP | Peter Swain | 391 | 15.0 | ||
| Majority | 262 | 10.0 | |||
| Turnout | 2,607 | 32.5 | -6.4 | ||
| Labour hold | Swing | ||||
| Party | Candidate | Votes | % | ± | |
|---|---|---|---|---|---|
| Conservative | George Howe | 1,996 | 52.2 | ||
| Labour | Robert Price | 977 | 25.5 | ||
| Liberal Democrat | Leslie Wascoe | 459 | 12.0 | ||
| BNP | Joseph Dobbie | 392 | 10.3 | ||
| Majority | 1,019 | 26.6 | |||
| Turnout | 3,824 | 42.7 | -9.0 | ||
| Conservative hold | Swing | ||||
| Party | Candidate | Votes | % | ± | |
|---|---|---|---|---|---|
| Labour | Mary Smith | 1,062 | 41.9 | ||
| BNP | David Guynan | 534 | 21.1 | ||
| Conservative | Alistair Newton | 528 | 20.8 | ||
| Liberal Democrat | John Jackson | 361 | 14.3 | ||
| Monster Raving Loony | Rosalyn Warner | 48 | 1.9 | ||
| Majority | 528 | 20.8 | |||
| Turnout | 2,533 | 31.4 | -4.6 | ||
| Labour hold | Swing | ||||
| Party | Candidate | Votes | % | ± | |
|---|---|---|---|---|---|
| Labour | Richard Tate | 1,364 | 56.8 | ||
| BNP | John Richardson | 544 | 22.6 | ||
| Conservative | George Brown | 494 | 20.6 | ||
| Majority | 820 | 34.1 | |||
| Turnout | 2,402 | 27.4 | -9.8 | ||
| Labour hold | Swing | ||||
| Party | Candidate | Votes | % | ± | |
|---|---|---|---|---|---|
| Labour | Dennis Richardson | 1,312 | 50.6 | ||
| Liberal Democrat | Avril Snowball | 476 | 18.4 | ||
| Conservative | Jane Wilson | 428 | 16.5 | ||
| BNP | Lesley Dathan | 376 | 14.5 | ||
| Majority | 836 | 32.3 | -6.0 | ||
| Turnout | 2,592 | 29.6 | |||
| Labour hold | Swing | ||||
| Party | Candidate | Votes | % | ± | |
|---|---|---|---|---|---|
| Liberal Democrat | Peter Maddison | 856 | 41.0 | ||
| Labour | Kevin O'Connor | 660 | 31.6 | ||
| Conservative | Leslie Dobson | 313 | 15.0 | ||
| BNP | Christopher Lathan | 258 | 12.4 | ||
| Majority | 196 | 9.4 | |||
| Turnout | 2,087 | 29.2 | -6.7 | ||
| Liberal Democrat gain from Labour | Swing | ||||
| Party | Candidate | Votes | % | ± | |
|---|---|---|---|---|---|
| Labour | Cecilia Gofton | 1,013 | 43.5 | ||
| Liberal Democrat | Margaret Hollern | 453 | 19.4 | ||
| BNP | James Davison | 441 | 18.9 | ||
| Conservative | Gwennyth Gibson | 424 | 18.2 | ||
| Majority | 560 | 24.0 | |||
| Turnout | 2,331 | 29.7 | -6.3 | ||
| Labour hold | Swing | ||||
| Party | Candidate | Votes | % | ± | |
|---|---|---|---|---|---|
| Labour | Paul Stewart | 1,313 | 51.1 | ||
| BNP | Ian Leadbitter | 687 | 26.8 | ||
| Liberal Democrat | David Griffin | 302 | 11.8 | ||
| Conservative | Gillian Connor | 266 | 10.4 | ||
| Majority | 626 | 24.4 | |||
| Turnout | 2,568 | 29.7 | -6.8 | ||
| Labour hold | Swing | ||||
| Party | Candidate | Votes | % | ± | |
|---|---|---|---|---|---|
| Labour | David Wares | 1,077 | 41.2 | ||
| Conservative | Stephen Daughton | 740 | 28.3 | ||
| BNP | William Brown | 415 | 15.9 | ||
| Liberal Democrat | Jane Walters | 383 | 14.6 | ||
| Majority | 337 | 12.9 | |||
| Turnout | 2,615 | 32.6 | -5.0 | ||
| Labour hold | Swing | ||||
| Party | Candidate | Votes | % | ± | |
|---|---|---|---|---|---|
| Labour | David Allan | 1,033 | 42.7 | ||
| Conservative | Richard Vardy | 577 | 23.8 | ||
| Liberal Democrat | Gary Hollern | 439 | 18.1 | ||
| BNP | Joseph Dobbie | 373 | 15.4 | ||
| Majority | 456 | 18.8 | |||
| Turnout | 2,422 | 29.0 | -7.7 | ||
| Labour hold | Swing | ||||
| Party | Candidate | Votes | % | ± | |
|---|---|---|---|---|---|
| Labour | Melville Speding | 1,477 | 50.0 | ||
| Conservative | Douglas Middlemiss | 552 | 18.7 | ||
| Liberal Democrat | Paul Forster | 548 | 18.5 | ||
| BNP | Sharon Leadbitter | 379 | 12.8 | ||
| Majority | 925 | 31.3 | |||
| Turnout | 2,956 | 30.5 | -8.3 | ||
| Labour hold | Swing | ||||
| Party | Candidate | Votes | % | ± | |
|---|---|---|---|---|---|
| Labour | Philip Tye | 1,345 | 45.6 | ||
| Conservative | Paula Wilkinson | 691 | 23.4 | ||
| Liberal Democrat | Sandra Hall | 479 | 16.2 | ||
| BNP | Anthony James | 433 | 14.7 | ||
| Majority | 654 | 22.2 | |||
| Turnout | 2,948 | 34.9 | -8.3 | ||
| Labour hold | Swing | ||||
| Party | Candidate | Votes | % | ± | |
|---|---|---|---|---|---|
| Labour | Norma Wright | 1,063 | 42.1 | ||
| Conservative | Terence Docherty | 536 | 21.3 | ||
| BNP | Alan Brettwood | 532 | 21.1 | ||
| Liberal Democrat | Christine Griffin | 391 | 15.5 | ||
| Majority | 527 | 20.9 | |||
| Turnout | 2,522 | 30.8 | -7.0 | ||
| Labour hold | Swing | ||||
| Party | Candidate | Votes | % | ± | |
|---|---|---|---|---|---|
| Labour | Thomas Wright | 977 | 45.5 | ||
| Conservative | Marjorie Matthews | 440 | 20.5 | ||
| Liberal Democrat | Emma Pryke | 368 | 17.1 | ||
| BNP | John Boyd | 362 | 16.9 | ||
| Majority | 537 | 25.0 | |||
| Turnout | 2,147 | 27.7 | -7.4 | ||
| Labour hold | Swing | ||||
| Party | Candidate | Votes | % | ± | |
|---|---|---|---|---|---|
| Conservative | Robert Oliver | 1,743 | 54.0 | ||
| Labour | Alan Whitwham | 1,017 | 31.5 | ||
| BNP | Carol Dobbie | 250 | 7.7 | ||
| Liberal Democrat | Diana Lambton | 218 | 6.8 | ||
| Majority | 726 | 22.5 | |||
| Turnout | 3,228 | 41.0 | -5.4 | ||
| Conservative hold | Swing | ||||
| Party | Candidate | Votes | % | ± | |
|---|---|---|---|---|---|
| Conservative | Paul Maddison | 1,680 | 53.1 | ||
| Labour | Garry Dent | 640 | 20.2 | ||
| Liberal Democrat | Lesley Dixon | 523 | 16.5 | ||
| BNP | Ian Sayers | 321 | 10.1 | ||
| Majority | 1,040 | 32.9 | |||
| Turnout | 3,164 | 38.5 | -9.8 | ||
| Conservative hold | Swing | ||||
| Party | Candidate | Votes | % | ± | |
|---|---|---|---|---|---|
| Conservative | Shirley Leadbitter | 1,289 | 41.5 | ||
| Labour | Christine Shattock | 947 | 30.5 | ||
| Liberal Democrat | Geoffrey Pryke | 470 | 15.1 | ||
| BNP | John McCaffrey | 402 | 12.9 | ||
| Majority | 342 | 11.0 | |||
| Turnout | 3,108 | 38.1 | -7.1 | ||
| Conservative gain from Labour | Swing | ||||
| Party | Candidate | Votes | % | ± | |
|---|---|---|---|---|---|
| Labour | Denis Whalen | 1,263 | 44.1 | ||
| Liberal Democrat | Edward Keogh | 622 | 21.7 | ||
| Conservative | Jacqueline Atkinson | 576 | 20.1 | ||
| BNP | Kevin Lathan | 404 | 14.1 | ||
| Majority | 641 | 22.4 | |||
| Turnout | 2,865 | 32.4 | -7.8 | ||
| Labour hold | Swing | ||||
| Party | Candidate | Votes | % | ± | |
|---|---|---|---|---|---|
| Labour | Neil MacKnight | 1,103 | 38.3 | ||
| Conservative | Ian Cuthbert | 1,005 | 34.9 | ||
| Liberal Democrat | Avril Grundy | 487 | 16.9 | ||
| BNP | Derek Wright | 286 | 9.9 | ||
| Majority | 98 | 3.4 | |||
| Turnout | 2,881 | 33.2 | -3.8 | ||
| Labour hold | Swing | ||||
| Party | Candidate | Votes | % | ± | |
|---|---|---|---|---|---|
| Labour | Jill Fletcher | 1,343 | 54.8 | ||
| Liberal Democrat | Paul Hillman | 455 | 18.6 | ||
| Conservative | Russell Bloxsom | 354 | 14.4 | ||
| BNP | David Laing | 299 | 12.2 | ||
| Majority | 888 | 36.2 | |||
| Turnout | 2,451 | 28.1 | -8.5 | ||
| Labour hold | Swing | ||||
| Party | Candidate | Votes | % | ± | |
|---|---|---|---|---|---|
| Labour | Graeme Miller | 786 | 30.9 | ||
| Conservative | Kathyrn Chamberlin | 751 | 29.5 | ||
| Liberal Democrat | Robert Boyce | 720 | 28.3 | ||
| BNP | Deborah Boyd | 290 | 11.4 | ||
| Majority | 35 | 1.4 | |||
| Turnout | 2,547 | 30.9 | -6.0 | ||
| Labour gain from Liberal Democrat | Swing | ||||
| Party | Candidate | Votes | % | ± | |
|---|---|---|---|---|---|
| Labour | Jean Stephenson | 1,400 | 51.4 | ||
| Liberal Democrat | Irene Bannister | 583 | 21.4 | ||
| Conservative | Olwyn Bird | 448 | 16.5 | ||
| BNP | Frederick Donkin | 292 | 10.7 | ||
| Majority | 817 | 30.0 | |||
| Turnout | 2,723 | 30.5 | -7.0 | ||
| Labour hold | Swing | ||||
References
- ↑ "Local elections: Sunderland". BBC News Online. Retrieved 2010-12-25.
- ↑ "Local elections 2006: Results in full". The Guardian. 2006-05-06. p. 20.
- 1 2 "Stakes are high in authorities around the North". The Journal. 2006-04-18. p. 8.
- ↑ Administrator, journallive (2006-08-10). "Councillor `treated like a pariah'". journallive. Retrieved 2018-07-02.
- ↑ Young, Peter (2006-04-04). "Tories miss election boat". Evening Chronicle. p. 6.
- 1 2 3 4 5 "Sunderland". The Journal. 2006-05-05. p. 4.
- ↑ "Cast your vote early". Evening Chronicle. 2006-04-11. p. 13.
- 1 2 "Lib Dems' grip on city strengthened". Evening Chronicle. 2006-05-05. p. 4.
- 1 2 "All smiles as Labour comes through unscathed". Sunderland Echo. 2006-05-05. Retrieved 2010-12-26.
- 1 2 "Labour keep control of Sunderland". BBC News Online. 2006-05-05. Retrieved 2010-12-26.
- ↑ "Councillor criticises his own party". The Journal. 2006-05-10. p. 15.
- 1 2 3 4 5 6 7 8 9 10 11 12 13 14 15 16 17 18 19 20 21 22 23 24 25 26 "Results of Poll". Sunderland City Council. Retrieved 2010-12-25.
- ↑ "Local elections". The Times. 2006-05-06. p. 64.
| Preceded by Sunderland City Council election, 2004 |
Sunderland City Council elections | Succeeded by Sunderland City Council election, 2007 |
| Gateshead Metropolitan Borough Council | |
|---|---|
| Newcastle City Council | |
| North Tyneside Metropolitan Borough Council | |
| South Tyneside Metropolitan Borough Council | |
| Sunderland City Council | |
| Tyne and Wear County Council |
|
| |