North Carolina's 3rd congressional district
| North Carolina's 3rd congressional district | |
|---|---|
.tif.png) North Carolina's 3rd congressional district - since January 3, 2017. | |
| Current Representative | Walter B. Jones (R–Farmville) |
| Distribution |
|
| Population (2000) | 749,823 |
| Median income | 44,871 |
| Ethnicity |
|
| Cook PVI | R+12[1] |
North Carolina's 3rd congressional district is located on the Atlantic coast of North Carolina. It covers the Outer Banks and the counties adjacent to the Pamlico Sound.
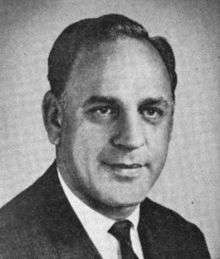
The district is represented by Walter B. Jones, a Republican. He has been its representative since 1995. In 2008, he defeated Democrat Craig Weber for reelection, and was challenged in 2010 by former Chair of the Pitt County Democratic Party Johnny Rouse, whom he defeated by a vote of 72% to 26% (141,978 votes to 50,600). In 2012, he was challenged by Frank Palombo, the former New Bern Police Chief, for the Republican Party nomination.[2] The winner of the Republican primary then faced Marine Corps Veteran Erik Anderson in the general election.[3]
List of representatives
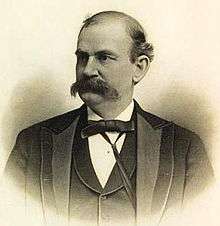
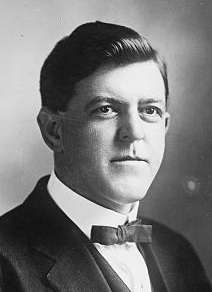
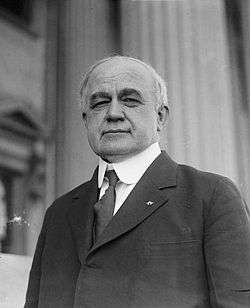
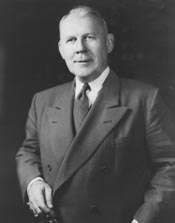
| Representative | Party | Years | Note | ||
|---|---|---|---|---|---|
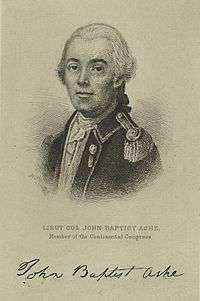
 |
Anti-Administration | April 6, 1790 – March 3, 1791 | |||
 |
Anti-Administration | March 4, 1791 – March 3, 1793 | Redistricted from the 1st district | ||
 |
Anti-Administration | March 4, 1793 – March 3, 1795 | |||
|
Democratic-Republican | March 4, 1795 – March 3, 1797 | |||
|
Democratic-Republican | March 4, 1797 – March 3, 1803 | |||
|
Democratic-Republican | March 4, 1803 – March 3, 1805 | |||
|
Democratic-Republican | March 4, 1805 – March 3, 1809 | |||
|
Democratic-Republican | March 4, 1809 – March 3, 1811 | |||
|
Democratic-Republican | March 4, 1811 – February 7, 1812 | Died eleven months and three days into 1811–13 term | ||
|
Democratic-Republican | January 30, 1813 – March 3, 1815 | |||
|
Democratic-Republican | March 4, 1815 – March 3, 1817 | |||
|
Democratic-Republican | March 4, 1817 – March 3, 1823 | |||
| Crawford D-R | March 4, 1823 – March 3, 1825 | ||||
|
Jacksonian | March 4, 1825 – March 3, 1827 | |||
|
Jacksonian | March 4, 1827 – March 3, 1835 | |||
|
Anti-Jacksonian | March 4, 1835 – March 3, 1837 | |||
 |
Whig | March 4, 1837 – March 3, 1843 | |||
 |
Democratic | March 4, 1843 – March 3, 1847 | |||
|
Whig | March 4, 1847 – March 3, 1849 | Redistricted from the 2nd district | ||
|
Whig | March 4, 1849 – March 3, 1851 | |||
|
Whig | March 4, 1851 – March 3, 1853 | |||
|
Democratic | March 4, 1853 – March 3, 1855 | Redistricted from the 7th district | ||
 |
Democratic | March 4, 1855 – March 3, 1861 | |||
| Civil War and Reconstruction | |||||
 |
Republican | July 13, 1868 – March 3, 1871 | |||
 |
Democratic | March 4, 1871 – March 3, 1879 | |||
 |
Greenback | March 4, 1879 – March 3, 1881 | |||
 |
Democratic | March 4, 1881 – January 18, 1883 | Died one year, ten months and fourteen days into 1881–83 term | ||
 |
Democratic | March 4, 1883 – March 3, 1887 | |||
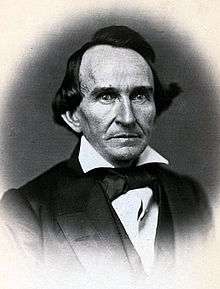
 |
Democratic | March 4, 1887 – March 3, 1891 | |||
|
Democratic | March 4, 1891 – March 3, 1895 | |||
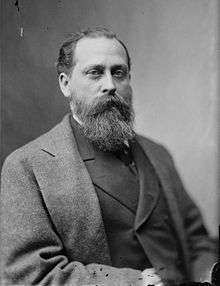
|
Democratic | March 4, 1895 – March 3, 1897 | |||
|
Populist | March 4, 1897 – March 3, 1899 | |||
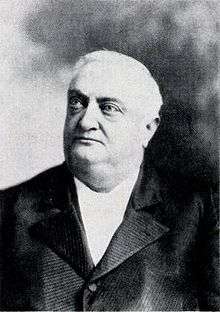
|
Democratic | March 4, 1899 – March 3, 1911 | |||
|
Democratic | March 4, 1911 – March 3, 1915 | |||
 |
Democratic | March 4, 1915 – March 3, 1919 | |||
|
Democratic | March 4, 1919 – April 13, 1922 | Died one year, one month and nine days into 1921–23 term | ||
 |
Democratic | November 7, 1922 – January 3, 1935 | |||
 |
Democratic | January 3, 1935 – January 3, 1961 | |||
 |
Democratic | January 3, 1961 – January 3, 1977 | |||
 |
Democratic | January 3, 1977 – December 31, 1986 | Resigned | ||
 |
Democratic | January 3, 1987 – January 3, 1995 | |||
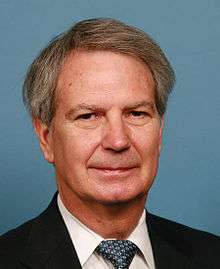 |
Republican | January 3, 1995 – Present | |||
Historical district boundaries

.tif.png)
Election results
2002
| Party | Candidate | Votes | % | |
|---|---|---|---|---|
| Republican | Walter B. Jones | 131,448 | 90.7 | |
| Libertarian | Gary Goodson | 13,486 | 9.3 | |
| Total votes | 144,934 | 100 | ||
2004
| Party | Candidate | Votes | % | |
|---|---|---|---|---|
| Republican | Walter B. Jones | 171,863 | 70.7 | |
| Democratic | Roger A. Eaton | 71,227 | 29.3 | |
| Total votes | 243,090 | 100 | ||
2006
| Party | Candidate | Votes | % | |
|---|---|---|---|---|
| Republican | Walter B. Jones | 99,519 | 68.64 | |
| Democratic | Craig Weber | 45,458 | 31.36 | |
| Total votes | 144,977 | 100 | ||
2008
| Party | Candidate | Votes | % | |
|---|---|---|---|---|
| Republican | Walter B. Jones | 201,686 | 65.9 | |
| Democratic | Craig Weber | 104,364 | 34.1 | |
| Total votes | 306,050 | 100 | ||
2010
| Party | Candidate | Votes | % | |
|---|---|---|---|---|
| Republican | Walter B. Jones | 143,225 | 71.86 | |
| Democratic | Johnny G. Rouse | 51,317 | 25.75 | |
| Libertarian | Darryl Holloman | 4,762 | 2.39 | |
| Total votes | 199,304 | 100 | ||
2012
| Party | Candidate | Votes | % | |
|---|---|---|---|---|
| Republican | Walter B. Jones | 195,571 | 63.11 | |
| Democratic | Erik Anderson | 114,314 | 36.89 | |
| Total votes | 309,885 | 100 | ||
2014
| Party | Candidate | Votes | % | |
|---|---|---|---|---|
| Republican | Walter B. Jones | 139,415 | 67.81 | |
| Democratic | Marshall Adame | 66,182 | 32.19 | |
| Total votes | 205,597 | 100 | ||
2016
| Party | Candidate | Votes | % | |
|---|---|---|---|---|
| Republican | Walter B. Jones | 217,531 | 67.2 | |
| Democratic | Ernest T. Reeves | 106,170 | 32.8 | |
| Total votes | 323,701 | 100 | ||
See also
References
- ↑ "Partisan Voting Index – Districts of the 115th Congress" (PDF). The Cook Political Report. April 7, 2017. Retrieved April 7, 2017.
- ↑ "Former New Bern police chief seeks House seat". Kinston Free Press. January 17, 2012. Retrieved January 30, 2012.
- ↑ "Pitt County political rallies set". 2012-03-17.
- ↑ "11/05/2002 Official General Election Results - Statewide". North Carolina State Board of Elections. November 15, 2002. Retrieved December 24, 2017.
- ↑ "11/02/2004 Official General Election Results - Statewide". North Carolina State Board of Elections. November 12, 2004. Retrieved December 24, 2017.
- ↑ "11/07/2006 Official General Election Results - Statewide". North Carolina State Board of Elections. November 17, 2006. Retrieved December 24, 2017.
- ↑ "11/04/2008 Official General Election Results - Statewide". North Carolina State Board of Elections. November 14, 2008. Retrieved December 24, 2017.
- ↑ "11/02/2010 Official General Election Results - Statewide". North Carolina State Board of Elections. November 12, 2010. Retrieved December 24, 2017.
- ↑ "11/06/2012 Official General Election Results - Statewide". North Carolina State Board of Elections. November 16, 2012. Retrieved December 24, 2017.
- ↑ "11/04/2014 Official General Election Results - Statewide". North Carolina State Board of Elections. November 25, 2014. Retrieved December 24, 2017.
- ↑ "11/08/2016 Official General Election Results - Statewide". North Carolina State Board of Elections. December 13, 2016. Retrieved December 24, 2017.
- Martis, Kenneth C. (1989). The Historical Atlas of Political Parties in the United States Congress. New York: Macmillan Publishing Company.
- Martis, Kenneth C. (1982). The Historical Atlas of United States Congressional Districts. New York: Macmillan Publishing Company.
- Congressional Biographical Directory of the United States 1774–present
- Rouse for Congress, North Carolina election results - Politics - Decision 2010 - msnbc.com
Coordinates: 35°24′20″N 76°37′47″W / 35.40556°N 76.62972°W