List of U.S. states and territories by income
| This article is part of a series on |
| Income in the United States of America |
|---|
 |
|
Lists by income |
|
|
This is a list of U.S. states, territories and the District of Columbia by income.
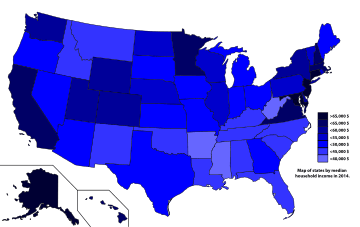
States and territories ranked by median household income
Data for the states, the District of Columbia and Puerto Rico is from the U.S. Census (Note that table does not reflect the margin of error in the values).[1] 2011 to 2015 data is unavailable for American Samoa, Guam, the Northern Mariana Islands and the U.S. Virgin Islands; data for those territories is from 2009/2010.
| Rank | State or territory | 2015 | 2014 | 2013 | 2012 | 2011[n 1] |
|---|---|---|---|---|---|---|
| 1 | $75,847 | $73,971 | $72,483 | $71,122 | $70,004 | |
| 2 | $75,628 | $71,648 | $67,572 | $66,583 | $63,124 | |
| 3 | $73,486 | $69,592 | $68,020 | $66,259 | $61,821 | |
| 4 | $73,355 | $71,583 | $72,237 | $67,712 | $67,825 | |
| 5 | $72,222 | $71,919 | $70,165 | $69,667 | $67,458 | |
| 6 | $71,346 | $70,048 | $67,098 | $67,276 | $65,753 | |
| 7 | $70,628 | $69,160 | $66,768 | $65,339 | $62,859 | |
| 8 | $70,303 | $66,532 | $64,230 | $63,280 | $62,647 | |
| 9 | $66,262 | $64,902 | $62,666 | $61,741 | $61,882 | |
| 10 | $64,500 | $61,933 | $60,190 | $58,328 | $57,287 | |
| 11 | $64,129 | $61,366 | $58,405 | $57,573 | $56,835 | |
| 12 | $63,909 | $61,303 | $58,823 | $56,765 | $55,387 | |
| 13 | $63,488 | $61,481 | $60,702 | $58,906 | $56,954 | |
| 14 | $62,912 | $60,922 | $59,770 | $57,049 | $55,869 | |
| 15 | $61,255 | $59,716 | $57,846 | $58,415 | $58,814 | |
| 16 | $60,850 | 58,878 | $57,369 | $56,448 | $55,246 | |
| 17 | $60,557 | $59,029 | $55,759 | $53,585 | $51,704 | |
| 18 | $60,214 | $57,055 | $58,752 | $54,901 | $56,322 | |
| 19 | $59,588 | $57,444 | $56,210 | $55,137 | $53,234 | |
| 20 | $58,073 | $54,891 | $55,902 | $54,554 | $53,636 | |
| 21 | $56,990 | $54,166 | $52,578 | $52,977 | $52,776 | |
| $55,775 | $53,657 | $52,250 | $51,371 | $50,502 | ||
| 22 | $55,702 | $53,234 | $52,007 | $51,230 | $50,228 | |
| 23 | $55,653 | $53,035 | $51,704 | $50,740 | $49,392 | |
| 24 | $55,638 | $52,622 | $51,467 | $51,059 | $50,395 | |
| 25 | $54,996 | $52,686 | $51,440 | $50,723 | $50,296 | |
| 26 | $54,736 | $53,712 | $52,229 | $50,957 | $49,427 | |
| 27 | $54,148 | $51,075 | $50,251 | $49,161 | $46,816 | |
| 28 | $53,906 | 52,504 | $50,972 | $50,241 | $48,964 | |
| 29 | $53,017 | $50,979 | $48,947 | $48,362 | $48,321 | |
| 30 | $52,431 | $51,450 | $51,230 | $49,760 | $48,927 | |
| 31 | $51,494 | $49,462 | $46,974 | $46,709 | $46,033 | |
| 32 | $51,492 | $50,068 | $48,510 | $47,826 | $46,709 | |
| 33 | $51,244 | $49,321 | $47,829 | $47,209 | $46,007 | |
| 34 | $51,084 | $49,847 | $48,273 | $46,859 | $45,981 | |
| 35 | $51,075 | $49,308 | $48,081 | $46,829 | $45,749 | |
| 36 | $50,532 | $49,446 | $47,529 | $46,974 | $46,438 | |
| 37 | $50,238 | $48,363 | $46,931 | $45,321 | $45,247 | |
| 38 | $49,509 | $46,328 | $46,972 | $45,076 | $44,222 | |
| 39 | $49,426 | $47,463 | $46,036 | $45,040 | $44,299 | |
| 40 | $48,568 | $47,529 | $45,690 | $44,312 | $43,225 | |
| 41 | $48,275 | $47,861 | $46,783 | $45,489 | $43,341 | |
| 42 | $47,830 | $46,556 | $45,906 | $45,150 | $43,916 | |
| 43 | $47,275 | $44,361 | $44,297 | $42,764 | $41,693 | |
| 44 | $47,238 | $45,238 | $44,163 | $43,107 | $42,367 | |
| 45 | $45,727 | $44,555 | $44,164 | $42,944 | $41,734 | |
| 46 | $45,382 | $44,803 | $43,872 | $42,558 | $41,963 | |
| 47 | $45,215 | $42,958 | $43,399 | $41,724 | $41,141 | |
| 48 | $44,765 | $42,830 | $42,849 | $41,574 | $41,415 | |
| 49 | $42,019 | $41,059 | $41,253 | $40,196 | $38,482 | |
| 50 | $41,995 | $41,262 | $40,511 | $40,112 | $38,758 | |
| 51 | $40,593 | $39,680 | $37,963 | $37,095 | $36,919 | |
| 52 | — | — | — | — | $39,052[2] | |
| 53 | — | — | — | — | $37,254[3] | |
| 54 | — | — | — | — | $23,892[4] | |
| 55 | — | — | — | — | $19,958[5] | |
| 56 | $18,626 | $18,928 | $19,183 | $19,429 | $18,660 |
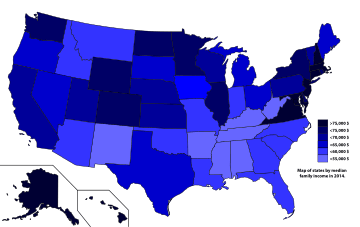
States and territories ranked by per capita income
All data is from the 2010-2014 American Community Survey 1-Year Estimates.[6][7][n 2] Per capita income data in unavailable for American Samoa, the Northern Mariana Islands and the U.S. Virgin Islands.
| Rank | State or territory | Per capita income |
Median household income |
Median family income |
Population | Number of households |
Number of families |
|---|---|---|---|---|---|---|---|
| 1 | $45,877 | $71,648 | $84,094 | 658,893 | 277,378 | 117,864 | |
| 2 | $39,373 | $70,048 | $88,819 | 3,596,677 | 1,355,817 | 887,263 | |
| 3 | $37,288 | $69,160 | $87,951 | 8,938,175 | 2,549,336 | 1,610,581 | |
| 4 | $36,593 | $71,919 | $88,419 | 6,938,608 | 3,194,844 | 2,203,675 | |
| 5 | $36,338 | $73,971 | $89,678 | 5,976,407 | 2,165,438 | 1,445,972 | |
| 6 | $34,691 | $66,532 | $80,581 | 1,326,813 | 519,756 | 345,901 | |
| 7 | $34,052 | $64,902 | $78,290 | 8,326,289 | 3,083,820 | 2,058,820 | |
| 8 | $33,095 | $58,878 | $71,115 | 19,746,227 | 7,282,398 | 4,621,954 | |
| 9 | $33,071 | $59,029 | $75,221 | 739,482 | 305,431 | 187,800 | |
| 10 | $33,062 | $71,583 | $82,307 | 736,732 | 249,659 | 165,015 | |
| 11 | $32,638 | $61,481 | $77,941 | 5,457,173 | 2,129,195 | 1,369,594 | |
| 12 | $32,357 | $61,303 | $75,405 | 5,355,866 | 2,039,592 | 1,315,283 | |
| 13 | $31,841 | $61,366 | $74,193 | 7,061,530 | 2,679,601 | 1,725,099 | |
| 14 | $30,830 | $54,891 | $71,212 | 1,055,173 | 409,654 | 257,165 | |
| 15 | $30,488 | $59,716 | $72,594 | 935,614 | 349,743 | 233,000 | |
| 16 | $30,441 | $61,933 | $71,015 | 38,802,500 | 12,758,648 | 8,762,059 | |
| 17 | $30,417 | $57,444 | $71,796 | 12,880,580 | 4,772,421 | 3,099,184 | |
| 18 | $29,736 | $69,592 | $79,187 | 1,419,561 | 450,769 | 314,151 | |
| 19 | $29,698 | $57,055 | $72,460 | 584,153 | 232,594 | 149,032 | |
| 20 | $29,220 | $53,234 | $67,876 | 12,787,209 | 4,945,972 | 3,185,054 | |
| 21 | $29,178 | $54,166 | $67,154 | 626,562 | 257,229 | 162,017 | |
| $28,889 | $53,657 | $65,910 | 318,857,056 | 117,259,427 | 77,152,072 | ||
| 22 | $28,361 | $53,712 | $67,771 | 3,107,126 | 1,241,471 | 801,562 | |
| 23 | $28,213 | $52,622 | $67,187 | 5,757,564 | 2,307,685 | 1,485,877 | |
| 24 | $27,978 | $49,462 | $62,078 | 1,330,089 | 549,841 | 344,585 | |
| 25 | $27,870 | $52,504 | $66,425 | 2,904,021 | 1,109,280 | 728,602 | |
| 26 | $27,646 | $51,075 | $62,670 | 3,970,239 | 1,535,511 | 966,250 | |
| 27 | $27,446 | $52,686 | $66,120 | 1,881,503 | 740,765 | 480,317 | |
| 28 | $27,125 | $53,035 | $62,830 | 26,956,958 | 9,277,197 | 6,407,165 | |
| 29 | $26,959 | $50,979 | $66,936 | 853,175 | 334,475 | 211,235 | |
| 30 | $26,937 | $49,308 | $62,300 | 11,594,163 | 4,593,172 | 2,923,523 | |
| 31 | $26,613 | $49,847 | $62,143 | 9,909,877 | 3,834,574 | 2,485,159 | |
| 32 | $26,582 | $47,463 | $57,212 | 19,893,297 | 7,328,046 | 4,693,411 | |
| 33 | $26,126 | $48,363 | $61,299 | 6,063,589 | 2,354,809 | 1,508,816 | |
| 34 | $25,989 | $46,328 | $60,643 | 1,023,579 | 410,962 | 251,176 | |
| 35 | $25,774 | $46,556 | $57,380 | 9,943,964 | 3,790,620 | 2,492,048 | |
| 36 | $25,773 | $51,450 | $60,824 | 2,839,099 | 1,021,519 | 642,461 | |
| 37 | $25,715 | $50,068 | $59,700 | 6,731,484 | 2,428,743 | 1,579,481 | |
| 38 | $25,615 | $49,321 | $58,885 | 10,097,343 | 3,587,521 | 2,426,392 | |
| 39 | $25,229 | $47,529 | $58,710 | 3,878,051 | 1,459,759 | 966,516 | |
| 40 | $25,140 | $49,446 | $60,780 | 6,596,855 | 2,502,739 | 1,657,223 | |
| 41 | $24,922 | $44,361 | $55,557 | 6,549,352 | 2,509,665 | 1,660,344 | |
| 42 | $24,877 | $60,922 | $69,535 | 2,942,902 | 918,370 | 691,495 | |
| 43 | $24,800 | $44,555 | $56,573 | 4,649,676 | 1,718,194 | 1,112,659 | |
| 44 | $24,596 | $45,238 | $56,491 | 4,832,482 | 1,826,914 | 1,201,616 | |
| 45 | $23,938 | $47,861 | $58,101 | 1,634,464 | 591,587 | 407,499 | |
| 46 | $23,684 | $42,958 | $54,776 | 4,413,457 | 1,712,094 | 1,124,586 | |
| 47 | $23,683 | $44,803 | $54,705 | 2,085,572 | 760,916 | 489,532 | |
| 48 | $23,606 | $42,830 | $53,764 | 4,849,377 | 1,841,217 | 1,232,515 | |
| 49 | $22,883 | $41,262 | $51,528 | 2,966,369 | 1,131,288 | 752,212 | |
| 50 | $22,714 | $41,059 | $52,413 | 1,850,326 | 735,375 | 472,869 | |
| 51 | $21,036 | $39,680 | $50,178 | 2,994,079 | 1,095,823 | 738,463 | |
| 52 | $12,864 | $39,052 | — | 162,742 | — | — | |
| 53 | $11,241 | $18,928 | $22,477 | 3,548,397 | 1,233,490 | 867,505 | |
About the District of Columbia and territories
The District of Columbia and the inhabited U.S. territories (Puerto Rico, the U.S. Virgin Islands, Guam, the Northern Mariana Islands and American Samoa) are not formally US states, but their residents are American citizens (except for American Samoa — people born in American Samoa are non-citizen U.S. nationals).[8] Puerto Rico has a higher population than 21 US states, while D.C. has a higher population than 2 states.
See also
Notes
References
- ↑ Bureau, U.S. Census. "American FactFinder - Results". factfinder.census.gov. Retrieved 28 July 2017.
- 1 2 http://bls.guam.gov/wp-content/uploads/bsk-pdf-manager/76_HOUSEHOLDPERCAPITAINCOME-2010.PDF Bls.guam.gov. Bureau of Labor Statistics - Department of Labor - Government of Guam. Leah Beth O. Naholowaa, Director. Gary A. Hiles, Chief Economist. Household and per capita income: 2010. Retrieved October 6, 2018.
- ↑ https://www.ruralhealthinfo.org/states/us-virgin-islands Ruralhealthinfo.org. U.S. Virgin Islands. Retrieved October 6, 2018.
- ↑ https://www.ruralhealthinfo.org/states/american-samoa Ruralhealthinfo.org. American Samoa. Retrieved October 6, 2018.
- ↑ https://www.ruralhealthinfo.org/states/northern-mariana Ruralhealthinfo.org. Northern Mariana Islands. Retrieved October 6, 2018.
- ↑ "SELECTED ECONOMIC CHARACTERISTICS 2010-2014 American Community Survey 1-Year Estimates". U.S. Census Bureau. Retrieved 2016-02-12.
- ↑ "ACS DEMOGRAPHIC AND HOUSING ESTIMATES 2010-2014 American Community Survey 1-Year Estimates". U.S. Census Bureau. Retrieved 2016-02-12.
- ↑ https://harvardlawreview.org/2017/04/american-samoa-and-the-citizenship-clause/ American Samoa and the Citizenship Clause: A Study in Insular Cases Revisionism. Chapter 3. Harvard Law Review. Retrieved October 6, 2018.
External links
| Demographics | |
|---|---|
| Economy | |
| Environment | |
| Geography | |
| Government |
|
| Health | |
| History | |
| Law | |
| Miscellaneous | |
| |