Demographics of Ontario
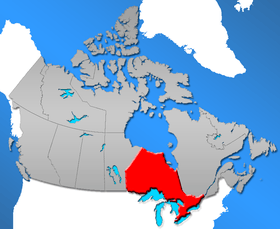
Ontario, one of the 13 provinces and territories of Canada, is located in east-central Canada. It is Canada's most populous province by a large margin, accounting for nearly 40 percent of all Canadians, and is the second-largest province in total area. Ontario is fourth-largest in total area when the territories of the Northwest Territories and Nunavut are included. It is home to the nation's capital city, Ottawa, and the nation's most populous city, Toronto.
Vital statistics
Birth Rate: 10.8/1,000 people [1]
Death Rate: 7.1/1,000 people [2]
Life Expectancy at birth: 81 years (2006 est) [3]
Infant Mortality rate: 5.2 (2007 est) [4]
Historic populations since 1851
| Year | Population | 5 year % change |
10 year % change |
% Canadian population |
|---|---|---|---|---|
| 1851 | 952,004 | - | - | 39.0% |
| 1861 | 1,396,091 | - | 46.6% | 43.2% |
| 1871 | 1,620,851 | - | 16.1% | 43.9% |
| 1881 | 1,926,922 | - | 18.8% | 45.4% |
| 1891 | 2,114,321 | - | 9.7% | 48.9% |
| 1901 | 2,182,947 | - | 3.2% | 40.6% |
| 1911 | 2,527,292 | - | 15.8% | 35.1% |
| 1921 | 2,933,662 | - | 16.1% | 33.4% |
| 1931 | 3,431,683 | - | 17.0% | 33.1% |
| 1941 | 3,787,655 | - | 10.4% | 32.9% |
| 1951 | 4,597,542 | - | 21.3% | 32.8% |
| 1956 | 5,404,933 | 17.6% | - | 33.6% |
| 1961 | 6,236,092 | 15.4% | 35.6% | 34.2% |
| 1966 | 6,960,870 | 11.6% | 28.8% | 34.9% |
| 1971 | 7,703,105 | 10.7% | 23.5% | 35.7% |
| 1976 | 8,264,465 | 7.3% | 18.7% | 35.9% |
| 1981 | 8,625,107 | 4.4% | 12.0% | 35.4% |
| 1986 | 9,101,695 | 5.5% | 10.1% | 36.0% |
| 1991 | 10,084,885 | 10.8% | 16.9% | 36.9% |
| 1996 | 10,753,573 | 10.7% | 18.2% | 37.3% |
| 2001 | 11,410,046 | 6.1% | 13.2% | 38.0% |
| 2006 | 12,160,282 | 6.6% | 13.1% | 38.4% |
| 2011 | 12,851,821 | 5.7% | 12.6% | 38.4% |
| 2016 | 13,448,494 | 4.6% | 9.6% | 38.3% |
Source: Statistics Canada [5]
Age structure
| Age Groups | Total | Male | Female |
|---|---|---|---|
| 0 to 14 years | 2,207,970 | 1,131,615 | 1,076,350 |
| 0 to 4 years | 697,360 | 357,300 | 340,055 |
| 5 to 9 years | 756,085 | 387,320 | 368,765 |
| 10 to 14 years | 754,530 | 387,000 | 367,530 |
| 15 to 64 years | 8,988,865 | 4,412,115 | 4,576,750 |
| 15 to 19 years | 811,670 | 416,730 | 394,944 |
| 20 to 24 years | 894,390 | 457,815 | 436,570 |
| 25 to 29 years | 874,350 | 436,345 | 438,010 |
| 30 to 34 years | 864,765 | 420,800 | 443,965 |
| 35 to 39 years | 842,485 | 402,900 | 439,585 |
| 40 to 44 years | 871,875 | 418,465 | 453,415 |
| 45 to 49 years | 937,385 | 453,105 | 484,275 |
| 50 to 54 years | 1,056,345 | 517,170 | 539,175 |
| 55 to 59 years | 989,460 | 482,280 | 507,180 |
| 60 to 64 years | 846,145 | 406,505 | 439,640 |
| 65 years and over | 2,251,655 | 1,015,655 | 1,236,000 |
| 65 to 69 years | 737,745 | 352,475 | 385,270 |
| 70 to 74 years | 528,645 | 250,455 | 278,185 |
| 75 to 79 years | 393,010 | 179,810 | 213,195 |
| 80 to 84 years | 291,185 | 126,825 | 164,360 |
| 85 years and over | 301,075 | 106,090 | 194,985 |
| 85 to 89 years | 188,470 | 73,045 | 115,425 |
| 90 to 94 years | 88,390 | 27,400 | 60,990 |
| 95 to 99 years | 21,210 | 5,150 | 16,060 |
| 100 years and over | 3,005 | 495 | 2,520 |
Visible minorities and Aboriginals
| Visible minority and Aboriginal population (Canada 2016 Census) | |||
|---|---|---|---|
| Population group | Population | % of total population | |
| European | 8,982,180 | 67.8% | |
| Visible minority group Source:[7] | South Asian | 1,150,415 | 8.7% |
| Chinese | 754,550 | 5.7% | |
| Black | 627,715 | 4.7% | |
| Filipino | 311,675 | 2.4% | |
| Latin American | 195,950 | 1.5% | |
| Arab | 210,435 | 1.6% | |
| Southeast Asian | 133,855 | 1% | |
| West Asian | 154,670 | 1.2% | |
| Korean | 88,935 | 0.7% | |
| Japanese | 30,830 | 0.2% | |
| Visible minority, n.i.e. | 81,130 | 0.6% | |
| Multiple visible minority | 97,970 | 0.7% | |
| Total visible minority population | 3,885,585 | 29.3% | |
| Aboriginal group | First Nations | 236,680 | 1.8% |
| Métis | 120,585 | 0.9% | |
| Inuit | 3,860 | 0% | |
| Aboriginal, n.i.e. | 7,540 | 0.1% | |
| Multiple Aboriginal identity | 5,730 | 0% | |
| Total Aboriginal population | 374,395 | 2.8% | |
| Total population | 13,242,160 | 100% | |
Ethnic groups
As of 2016 census.[8]
| Ethnic group | Responses | % |
|---|---|---|
| Canadian | 3,109,770 | 23.48 |
| English | 2,808,810 | 21.21 |
| Scottish | 2,107,290 | 15.91 |
| Irish | 2,095,465 | 15.82 |
| French | 1,349,255 | 10.19 |
| German | 1,189,670 | 8.98 |
| Italian | 931,805 | 7.04 |
| Chinese | 849,340 | 6.41 |
| East Indian | 774,495 | 5.85 |
| Dutch (Netherlands) | 527,750 | 3.99 |
| Polish | 523,490 | 3.95 |
| North American Indian | 385,505 | 2.91 |
| Ukrainian | 376,440 | 2.84 |
| Filipino | 337,760 | 2.55 |
| Portuguese | 324,930 | 2.45 |
| British, not included elsewhere | 323,180 | 2.44 |
| Jamaican | 257,055 | 1.94 |
| Russian | 220,850 | 1.67 |
| Welsh | 198,470 | 1.50 |
| Spanish | 171,145 | 1.29 |
| Hungarian (Magyar) | 163,500 | 1.23 |
| Pakistani | 149,060 | 1.13 |
| Greek | 148,555 | 1.12 |
| American (USA) | 140,165 | 1.06 |
| Métis | 137,485 | 1.04 |
Note: The table takes dual responses (for example if someone is French-Canadian he/she would be added to both French and Canadian). Some places of one's ethnic origin do not refer to a single specified country of origin, i.e. Spanish refers to people from Spanish speaking countries such as Colombia, Argentina, Cuba and others; or East Indian where the respondents origin could be from Pakistan, India, Nepal, Bangladesh, etc.; and the list contains about 200 nationalities known to reside in the province. However, there are options for the respondent to identify the country alone.
Ontario is a very diverse province. For example, 54.8% of the population of Toronto was born outside Canada,[9] which is the second-largest percentage of immigrants in a single city on Earth, after Miami. Hamilton is ranked the third-most diverse urbanized area in Canada (after Toronto and Vancouver).
Mother tongue
As of the 2016 census.[6]
| Mother tongue | Responses | % |
|---|---|---|
| English | 8,902,320 | 66.87 |
| French | 490,715 | 3.68 |
| Mandarin | 283,735 | 2.13 |
| Cantonese | 275,315 | 2.07 |
| Italian | 231,040 | 1.74 |
| Panjabi (Punjabi) | 197,060 | 1.48 |
| Spanish | 191,025 | 1.43 |
| Arabic | 171,370 | 1.29 |
| Urdu | 152,385 | 1.14 |
| Portuguese | 150,000 | 1.13 |
| Tagalog (Filipino) | 163,415 | 1.23 |
| German | 131,525 | 0.99 |
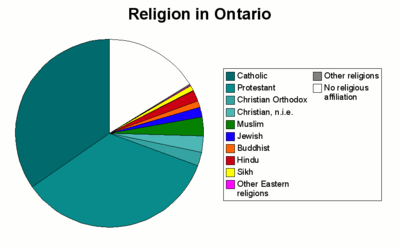
Religious groups
| Christian denominations in Canada |
|---|
|
Anabaptist and Friends
Presbyterian and Reformed
Other
|
| Religion | People | % |
|---|---|---|
| Total | 12,651,795 | 100 |
| Christian | 8,167,295 | 64.6 |
| No Religious Affiliation | 2,927,790 | 23.1 |
| Muslim | 581,950 | 4.6 |
| Hindu | 366,720 | 2.9 |
| Jewish | 195,540 | 1.5 |
| Sikh | 179,765 | 1.4 |
| Buddhist | 163,750 | 1.3 |
| Traditional Aboriginal (Spirituality) | 15,905 | 0.1 |
| Other Religions | 53,080 | 0.4 |
- Of Christian faith: Catholic at 3,976,610 (31.4%); United Church 952,465 (7.5%); Anglican 774,560 (6.1%); Presbyterian 319,585 (2.5%); Christian Orthodox 297,710 (2.4%); Baptist 244,650 (1.9%); Pentecostal 213,945 (1.7%); Lutheran 163,460 (1.3%); Other Christian 1,224,300 (9.7%)
Source: Statistics Canada [7] StatsCan 2011 National Household Survey
Census Metropolitan Areas
| City | 2016 [10] | 2011 [11] | 2006 [12] | 2001 [13] | 1996 [14] | 1991 [14] |
|---|---|---|---|---|---|---|
| Toronto | 5,928,040 | 5,583,064 | 5,113,149 | 4,682,897 | 4,263,757 | 3,898,933 |
| Ottawa-Gatineau | 1,323,783 | 1,236,324 | 1,130,761 | 1,063,664 | 1,010,498 | 941,814 |
| Hamilton | 747,545 | 721,053 | 692,911 | 662,401 | 624,360 | 599,760 |
| Kitchener-Cambridge-Waterloo | 523,894 | 477,160 | 451,235 | 414,284 | 382,940 | 356,421 |
| London | 494,069 | 474,786 | 457,720 | 432,451 | 398,616 | 381,522 |
| St. Catharines-Niagara | 406,074 | 392,184 | 390,317 | 377,009 | 372,406 | 364,552 |
| Oshawa | 379,848 | 356,177 | 330,594 | 296,298 | 268,773 | 240,104 |
| Windsor | 329,144 | 319,246 | 323,342 | 307,877 | 278,685 | 262,075 |
| Barrie | 197,059 | 187,013 | 177,061 | 148,480 | 118,695 | 97,150 |
| Greater Sudbury | 164,689 | 160,770 | 158,258 | 155,601 | 160,488 | 157,613 |
| Kingston | 161,175 | 159,561 | 152,358 | 146,838 | 143,416 | 136,401 |
| Guelph | 151,984 | 141,097 | 127,009 | 117,344 | 105,420 | 97,667 |
| Brantford | 134,203 | 135,501 | 124,607 | 86,417 | 100,238 | 97,106 |
| Peterborough | 121,721 | 118,975 | |102,423 | 100,193 | 98,060 | - |
| Thunder Bay | 121,621 | 121,596 | 122,907 | 121,986 | 125,562 | 124,925 |
| Belleville | 103,472 | 101,668 | 91,518 | 87,395 | 87,871 | - |
See also
References
- ↑
- ↑
- ↑ "{title}". Archived from the original on 2011-01-14. Retrieved 2010-08-02.
- ↑ "{title}". Archived from the original on 2011-10-05. Retrieved 2010-08-02.
- ↑ "Population and Dwelling Count Highlight Tables, 2016 Census". 12.statcan.gc.ca. Retrieved 27 May 2018.
- 1 2 "{title}". Archived from the original on 2017-09-14. Retrieved 2017-10-31.
- 1 2 "2011 National Household Survey Profile - Province/Territory". 12.statcan.gc.ca. Retrieved 27 May 2018.
- ↑ "Immigration and Ethnocultural Diversity Highlight Tables - Ethnic Origin, both sexes, age (total), Ontario, 2016 Census – 25% Sample data". 12.statcan.gc.ca. Retrieved 27 May 2018.
- ↑ "TMMIS - Committees" (PDF). Toronto.ca. Retrieved 27 May 2018.
- ↑ "Population and Dwelling Count Highlight Tables, 2016 Census". 12.statcan.gc.ca. Retrieved 27 May 2018.
- ↑ "Population and dwelling counts, for Canada, provinces and territories, census metropolitan areas and census agglomerations, 2011 and 2006 censuses". 12.statcan.gc.ca. Retrieved 27 May 2018.
- ↑ "Population and dwelling counts, for Canada, provinces and territories, census metropolitan areas and census agglomerations, 2006 and 2001 censuses - 100% data". 12.statcan.gc.ca. Retrieved 27 May 2018.
- ↑ "Population and Dwelling Counts, for Canada, Provinces and Territories, Census Metropolitan Areas and Census Agglomerations, 2001 and 1996 Censuses - 100% Data". 12.statcan.gc.ca. Retrieved 27 May 2018.
- 1 2 "Population and Dwelling Counts, for Census Metropolitan : Areas in Decreasing Order of 1996 Population, 1991 and 1996 Censuses - 100% Data". Statcan.gc.ca. Retrieved 27 May 2018.
| Provinces | |
|---|---|
| Territories | |
| |
| Ethnic ancestry |
| ||||||||||||||||||||||||||||||||||||||||||||||||||
|---|---|---|---|---|---|---|---|---|---|---|---|---|---|---|---|---|---|---|---|---|---|---|---|---|---|---|---|---|---|---|---|---|---|---|---|---|---|---|---|---|---|---|---|---|---|---|---|---|---|---|---|
| Demographics | |||||||||||||||||||||||||||||||||||||||||||||||||||
| Culture & society | |||||||||||||||||||||||||||||||||||||||||||||||||||
| List of Canadians |
| ||||||||||||||||||||||||||||||||||||||||||||||||||
| |||||||||||||||||||||||||||||||||||||||||||||||||||