Opinion polling for the United Kingdom general election, 2017
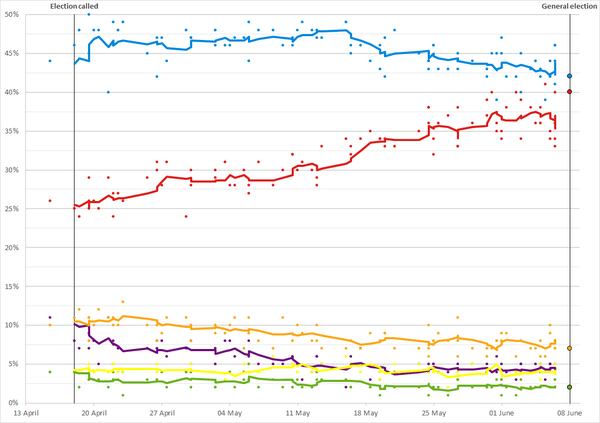
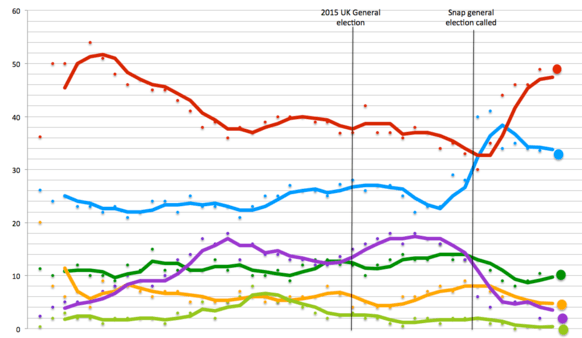
In the run-up to the general election on 8 June 2017, various organisations carried out opinion polling to gauge voting intentions. Results of such polls are displayed in this article. Most of the polling companies listed are members of the British Polling Council (BPC) and abide by its disclosure rules.
The date range for these opinion polls is from after the previous general election, held on 7 May 2015, to immediately before 8 June 2017. Under fixed-term legislation, the next general election was scheduled to be held on 7 May 2020. However, on 18 April 2017, Prime Minister Theresa May said that she would seek to bring forward the general election to Thursday 8 June 2017, which the House of Commons approved on 19 April. For an early election to be held, two-thirds of the total membership of the House had to support the resolution. The Conservative Party went into the election defending its overall majority won in 2015 with the Labour Party as the leading opposition party both in terms of polling numbers and seats.
Most opinion polls cover only Great Britain, as Northern Ireland seats are contested by a different set of political parties. Most YouGov polls include the Scottish National Party and Plaid Cymru as single options. The English and Welsh, Scottish, and Northern Irish Green Parties are also treated as a single option by most polls.
Graphical summaries
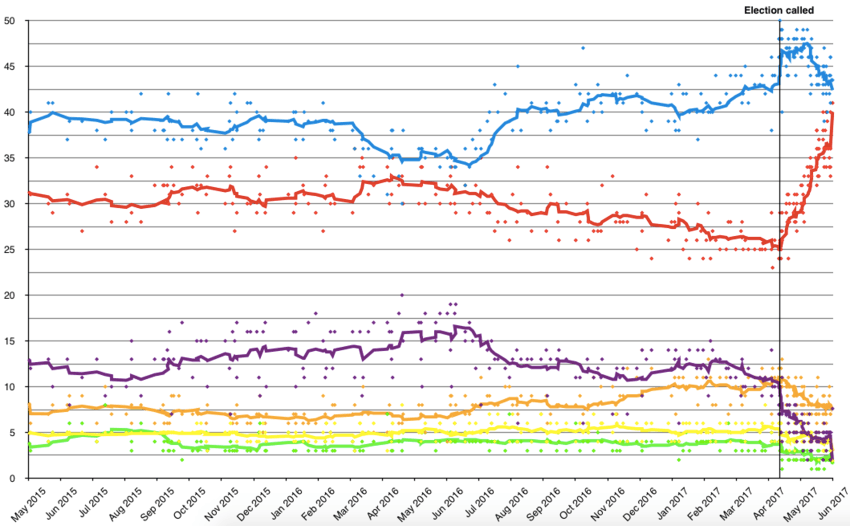
Poll results
Poll results are listed in the table below in reverse chronological order.[1] The highest percentage figure in each polling survey is displayed in bold, and the background shaded in the leading party's colour. The "Lead" column shows the percentage-point difference between the two parties with the highest figures. If there is a tie, no figure is shaded but both are displayed in bold. Poll results are generally rounded to the nearest percentage point (where a result is less than 0.5%, but more than zero, it is indicated by '*'). Percentages may not add to 100%, due to rounding. Data for all polls listed was obtained online, with the exception of Ipsos MORI and Survation, who obtained their data both online and by telephone.
The poll results shown are the 'headline' figures, those published or broadcast in the mainstream media. Polling organisations obtain raw data from respondents and subsequently adjust or 'weight' this according to their projections of turnout and voting on election day based on, for example, age and party preference. Each polling organisation weights its raw data differently.
The six parties with the largest numbers of votes in the 2015 general election are listed here. Other parties are included in the "Others" column.
2017
| Date(s) conducted |
Polling organisation/client | Sample size | Con | Lab | UKIP | Lib Dem | SNP | Green | Others | Lead |
|---|---|---|---|---|---|---|---|---|---|---|
| 8 June | General Election results (GB only) [2] | – | 43.5% | 41.0% | 1.9% | 7.6% | 3.1% | 1.7% | 1.2% | 2.5% |
| 6–7 Jun | Ipsos MORI/Evening Standard | 1,291 | 44% | 36% | 4% | 7% | 5% | 2% | 2% | 8% |
| 6–7 Jun | BMG/The Herald | 1,199 | 46% | 33% | 5% | 8% | 4% | 3% | 2% | 13% |
| 6–7 Jun | Survation | 2,798 | 41% | 40% | 2% | 8% | 4% | 2% | 2% | 1% |
| 6–7 Jun | ICM/The Guardian | 1,532 | 46% | 34% | 5% | 7% | 5% | 2% | 1% | 12% |
| 5–7 Jun | YouGov/The Times | 2,130 | 42% | 35% | 5% | 10% | 5%[lower-alpha 1] | 2% | 1% | 7% |
| 5–7 Jun | ComRes/Independent | 2,051 | 44% | 34% | 5% | 9% | 4% | 2% | 1% | 10% |
| 4–7 Jun | Qriously/Wired | 2,213 | 39% | 41% | 4% | 6% | 3% | 7% | 2% | |
| 2–7 Jun | Panelbase | 3,018 | 44% | 36% | 5% | 7% | 4% | 2% | 2% | 8% |
| 1–7 Jun | Kantar Public | 2,159 | 43% | 38% | 4% | 7% | 4% | 2% | 2% | 5% |
| 4–6 Jun | SurveyMonkey/The Sun | 11,000 | 42% | 38% | 4% | 6% | 3% | 2% | 5% | 4% |
| 4–6 Jun | Opinium | 3,002 | 43% | 36% | 5% | 8% | 5% | 2% | 1% | 7% |
| 2–4 Jun | ICM/The Guardian | 2,000 | 45% | 34% | 5% | 8% | 4% | 3% | 1% | 11% |
| 3 Jun | London terror attack, national campaigning partially suspended on 4 June[3] | |||||||||
| 3 Jun | Survation/Mail on Sunday | 1,049 | 40% | 39% | 5% | 8% | 4% | 5% | 1% | |
| 2–3 Jun | Survation/Good Morning Britain[lower-alpha 2] | 1,103 | 41% | 40% | 3% | 6% | 4% | 1% | 4% | 1% |
| 1–2 Jun | YouGov/Sunday Times | 1,989 | 42% | 38% | 4% | 9% | 4%[lower-alpha 1] | 2% | 0% | 4% |
| 31 May–2 Jun | ICM/The Sun on Sunday | 2,051 | 45% | 34% | 5% | 9% | 4% | 3% | 1% | 11% |
| 31 May–2 Jun | ComRes/Sunday Mirror, Independent on Sunday | 2,038 | 47% | 35% | 4% | 8% | 3% | 1% | 1% | 12% |
| 31 May–1 Jun | Norstat | 1,013 | 39% | 35% | 6% | 8% | * | 3% | 9% | 4% |
| 31 May–1 Jun | ORB/Telegraph | 1,656 | 45% | 36% | 4% | 8% | 7% | 9% | ||
| 30 May–1 Jun | Ipsos MORI/Evening Standard[lower-alpha 2] | 1,046 | 45% | 40% | 2% | 7% | 3%[lower-alpha 1] | 2% | 1% | 5% |
| 26 May–1 Jun | Panelbase | 1,224 | 44% | 36% | 5% | 7% | 5% | 2% | 1% | 8% |
| 30–31 May | Opinium/Observer | 2,006 | 43% | 37% | 5% | 6% | 5% | 2% | 1% | 6% |
| 30–31 May | YouGov/The Times | 1,875 | 42% | 39% | 4% | 7% | 4%[lower-alpha 1] | 2% | 1% | 3% |
| Pre-31 May | SurveyMonkey/The Sun | 19,000 | 44% | 38% | 4% | 6% | 7% | 6% | ||
| 25–30 May | Kantar Public | 1,199 | 43% | 33% | 4% | 11% | 4% | 3% | 1% | 10% |
| 26–29 May | ICM/The Guardian | 2,002 | 45% | 33% | 5% | 8% | 4% | 3% | 2% | 12% |
| 26–29 May | Qriously | 1,153 | 43% | 39% | 5% | 6% | 3% | 2% | 3% | 4% |
| 26–27 May | Survation/Good Morning Britain[lower-alpha 2] | 1,009 | 43% | 37% | 4% | 8% | 2% | 1% | 4% | 6% |
| 25–26 May | YouGov/Sunday Times | 2,003 | 43% | 36% | 4% | 9% | 4%[lower-alpha 1] | 2% | 1% | 7% |
| 24–26 May | ICM/The Sun on Sunday | 2,044 | 46% | 32% | 5% | 8% | 4% | 2% | 1% | 14% |
| 24–26 May | ComRes/Sunday Mirror, Independent on Sunday | 2,024 | 46% | 34% | 5% | 8% | 4% | 2% | 1% | 12% |
| 24–25 May | ORB/Sunday Telegraph | 1,556 | 44% | 38% | 5% | 7% | 4% | 2% | 6% | |
| 24–25 May | SurveyMonkey/The Sun | 6,000 | 44% | 36% | 4% | 6% | 9% | 8% | ||
| 24–25 May | YouGov/The Times | 2,052 | 43% | 38% | 4% | 10% | 5%[lower-alpha 1] | 1% | 0% | 5% |
| 23–24 May | Opinium/Observer | 2,002 | 45% | 35% | 5% | 7% | 5% | 2% | 1% | 10% |
| 19–23 May | Panelbase/The Sunday Times | 1,019 | 48% | 33% | 4% | 7% | 5% | 2% | 1% | 15% |
| 22 May | Manchester Arena bombing, national campaigning suspended 23–24 May | |||||||||
| 18–22 May | Kantar Public | 1,200 | 42% | 34% | 4% | 9% | 4% | 4% | 2% | 8% |
| 19–21 May | ICM/The Guardian | 2,004 | 47% | 33% | 4% | 9% | 4% | 2% | 1% | 14% |
| 19–20 May | Survation/Good Morning Britain[lower-alpha 2] | 1,034 | 43% | 34% | 4% | 8% | 3% | 2% | 5% | 9% |
| 19–20 May | Survation/Mail on Sunday | 1,017 | 46% | 34% | 3% | 8% | 4% | 1% | 3% | 12% |
| 18–19 May | YouGov/Sunday Times | 1,925 | 44% | 35% | 3% | 9% | 5%[lower-alpha 1] | 2% | 1% | 9% |
| 17–18 May | ORB/Sunday Telegraph | 1,551 | 46% | 34% | 7% | 7% | 4% | 2% | 12% | |
| 16–17 May | Opinium/Observer | 2,003 | 46% | 33% | 5% | 8% | 5% | 2% | 1% | 13% |
| 16–17 May | YouGov/The Times | 1,861 | 45% | 32% | 6% | 8% | 5% | 2% | 1% | 13% |
| 15–17 May | Ipsos MORI/Evening Standard | 1,053 | 49% | 34% | 2% | 7% | 6% | 3% | * | 15% |
| 12–15 May | Panelbase | 1,026 | 47% | 33% | 5% | 7% | 5% | 3% | * | 14% |
| 11–15 May | Kantar Public | 1,201 | 47% | 29% | 6% | 8% | 4% | 4% | 2% | 18% |
| 12–14 May | ICM/The Guardian | 2,030 | 48% | 28% | 6% | 10% | 4% | 3% | 1% | 20% |
| 3–14 May | GfK/Business Insider | 1,952 | 48% | 28% | 5% | 7% | 6% | 3% | 2% | 20% |
| 12–13 May | Survation/Good Morning Britain | 1,016 | 48% | 30% | 4% | 8% | 4% | 2% | 4% | 18% |
| 11–12 May | YouGov/Sunday Times | 1,630 | 49% | 31% | 3% | 9% | 5%[lower-alpha 1] | 2% | 1% | 18% |
| 10–12 May | ComRes/Sunday Mirror, Independent on Sunday | 2,007 | 48% | 30% | 5% | 10% | 4% | 3% | 1% | 18% |
| 9–12 May | Opinium/Observer | 2,003 | 47% | 32% | 5% | 8% | 5% | 2% | 1% | 15% |
| 10–11 May | ORB/Sunday Telegraph | 1,508 | 46% | 32% | 6% | 8% | 5% | 4% | 14% | |
| 9–10 May | YouGov/The Times | 1,651 | 46% | 30% | 5% | 11% | 6%[lower-alpha 1] | 2% | 1% | 16% |
| 5–9 May | Panelbase | 1,027 | 48% | 31% | 5% | 8% | 4% | 2% | 2% | 17% |
| 4–8 May | Kantar Public | 1,201 | 44% | 28% | 8% | 11% | 4% | 5% | 1% | 16% |
| 5–7 May | ICM/The Guardian | 2,038 | 49% | 27% | 6% | 9% | 4% | 3% | 1% | 22% |
| 5–6 May | Survation/Good Morning Britain | 1,005 | 47% | 30% | 4% | 7% | 5% | 3% | 3% | 17% |
| 4–5 May | YouGov/Sunday Times | 1,644 | 47% | 28% | 6% | 11% | 5%[lower-alpha 1] | 2% | 1% | 19% |
| 3–5 May | ICM/Sun on Sunday | 2,020 | 46% | 28% | 8% | 10% | 4% | 4% | * | 18% |
| 4 May | United Kingdom local and mayoral elections | |||||||||
| 3–4 May | ORB/Sunday Telegraph | 1,550 | 46% | 31% | 8% | 9% | 3% | 3% | 15% | |
| 2–3 May | Opinium/Observer | 2,005 | 46% | 30% | 7% | 9% | 4% | 2% | 1% | 16% |
| 2–3 May | YouGov/The Times | 2,066 | 48% | 29% | 5% | 10% | 5%[lower-alpha 1] | 2% | 1% | 19% |
| 28 Apr–2 May | Panelbase | 1,034 | 47% | 30% | 5% | 10% | 5% | 2% | 1% | 17% |
| 28 Apr–2 May | ICM/The Guardian | 1,970 | 47% | 28% | 8% | 8% | 3% | 4% | 1% | 19% |
| 28 Apr–1 May | Qriously | 1,240 | 44% | 28% | 8% | 9% | 3% | 4% | 4% | 15% |
| 27 Apr–2 May | Kantar Public | 1,205 | 48% | 24% | 7% | 11% | 4% | 4% | 2% | 24% |
| 27–28 Apr | YouGov/Sunday Times | 1,612 | 44% | 31% | 6% | 11% | 4%[lower-alpha 1] | 2% | 2% | 13% |
| 26–28 Apr | ICM/Sun on Sunday | 2,012 | 47% | 28% | 8% | 9% | 4% | 4% | * | 19% |
| 25–28 Apr | Opinium/Observer | 2,007 | 47% | 30% | 7% | 8% | 5% | 3% | 1% | 17% |
| 26–27 Apr | ORB/Sunday Telegraph | 2,093 | 42% | 31% | 8% | 10% | 4% | 4% | 11% | |
| 25–26 Apr | YouGov/The Times | 1,590 | 45% | 29% | 7% | 10% | 5%[lower-alpha 1] | 3% | 1% | 16% |
| 21–25 Apr | Ipsos MORI/Evening Standard | 1,004 | 49% | 26% | 4% | 13% | 4% | 1% | 4% | 23% |
| 21–24 Apr | ICM/The Guardian | 2,024 | 48% | 27% | 7% | 10% | 4% | 3% | 1% | 21% |
| 20–24 Apr | Panelbase | 1,026 | 49% | 27% | 5% | 10% | 5% | 3% | 1% | 22% |
| 20–24 Apr | Kantar Public | 1,196 | 46% | 24% | 8% | 11% | 5% | 4% | 1% | 22% |
| Pre-23 Apr | Norstat/Sunday Express | 1,036 | 42% | 26% | 8% | 10% | * | 6% | 8% | 16% |
| 21–22 Apr | Survation/Mail on Sunday | 2,072 | 40% | 29% | 11% | 11% | 4% | 2% | 3% | 11% |
| 20–21 Apr | YouGov/Sunday Times | 1,590 | 48% | 25% | 5% | 12% | 6%[lower-alpha 1] | 3% | 1% | 23% |
| 19–21 Apr | ICM/ITV | 2,027 | 48% | 26% | 8% | 10% | 4% | 3% | 2% | 22% |
| 19–20 Apr | ORB/Daily Telegraph | 1,860 | 44% | 29% | 10% | 8% | 5% | 4% | 15% | |
| 19–20 Apr | ComRes/Sunday Mirror | 2,074 | 50% | 25% | 7% | 11% | 4% | 3% | 1% | 25% |
| 19–20 Apr | Opinium/Observer | 2,003 | 45% | 26% | 9% | 11% | 4% | 3% | 1% | 19% |
| 2–20 Apr | YouGov | 12,746 | 44% | 25% | 9% | 12% | 6%[lower-alpha 1] | 3% | 1% | 19% |
| 18–19 Apr | YouGov/The Times | 1,727 | 48% | 24% | 7% | 12% | 6%[lower-alpha 1] | 2% | 1% | 24% |
| 18 Apr | ICM/The Guardian | 1,000 | 46% | 25% | 8% | 11% | 4% | 4% | 1% | 21% |
| 18 Apr | Prime Minister Theresa May announces her intention to seek a general election to be held on 8 June 2017 | |||||||||
| 14–17 Apr | ICM/The Guardian | 2,052 | 44% | 26% | 11% | 10% | 4% | 4% | 1% | 18% |
| 12–13 Apr | YouGov/The Times | 2,069 | 44% | 23% | 10% | 12% | 6%[lower-alpha 1] | 4% | 1% | 21% |
| 11–13 Apr | ComRes/Sunday Mirror, Independent on Sunday | 2,026 | 46% | 25% | 9% | 11% | 4% | 4% | 2% | 21% |
| 11–13 Apr | Opinium/Observer | 2,002 | 38% | 29% | 14% | 7% | 5% | 5% | 1% | 9% |
| 5–6 Apr | YouGov/The Times | 1,651 | 42% | 25% | 11% | 11% | 8%[lower-alpha 1] | 3% | 1% | 17% |
| 31 Mar–2 Apr | ICM/The Guardian | 2,005 | 43% | 25% | 11% | 11% | 5% | 4% | 2% | 18% |
| 26–27 Mar | YouGov/The Times | 1,957 | 43% | 25% | 10% | 11% | 6%[lower-alpha 1] | 3% | 1% | 18% |
| 20–21 Mar | YouGov/The Times | 1,627 | 41% | 25% | 12% | 11% | 6%[lower-alpha 1] | 3% | 2% | 16% |
| 17–19 Mar | ICM/The Guardian | 2,012 | 45% | 26% | 10% | 9% | 4% | 4% | 1% | 19% |
| 15–17 Mar | ComRes/Sunday Mirror, Independent on Sunday | 2,026 | 42% | 25% | 10% | 12% | 5% | 4% | 2% | 17% |
| 14–17 Mar | Opinium/Observer | 2,007 | 41% | 28% | 13% | 8% | 6% | 3% | 1% | 13% |
| 1–15 Mar | GfK | 1,938 | 41% | 28% | 12% | 7% | 5% | 6% | 1% | 13% |
| 13–14 Mar | YouGov/The Times | 1,631 | 44% | 27% | 9% | 10% | 5%[lower-alpha 1] | 4% | 0% | 17% |
| 10–14 Mar | Ipsos MORI | 1,032 | 43% | 30% | 6% | 13% | 4% | 4% | * | 13% |
| 8–9 Mar | YouGov/The Times | 1,598 | 44% | 25% | 11% | 10% | 6%[lower-alpha 1] | 3% | 1% | 19% |
| 3–5 Mar | ICM/The Guardian | 1,787 | 44% | 28% | 11% | 8% | 4% | 5% | 1% | 16% |
| 27–28 Feb | YouGov/The Times | 1,666 | 42% | 25% | 12% | 11% | 6%[lower-alpha 1] | 4% | 1% | 17% |
| 23 Feb | By-elections in Stoke-on-Trent Central and Copeland | |||||||||
| 21–22 Feb | YouGov/The Times | 2,060 | 41% | 25% | 13% | 11% | 6%[lower-alpha 1] | 3% | 1% | 16% |
| 17–19 Feb | ICM/The Guardian | 2,028 | 44% | 26% | 13% | 8% | 4% | 4% | 1% | 18% |
| 14–16 Feb | Opinium/Observer | 2,004 | 40% | 27% | 14% | 8% | 5% | 4% | 2% | 13% |
| 10–14 Feb | Ipsos MORI/Evening Standard | 1,014 | 40% | 29% | 9% | 13% | 5% | 4% | 0% | 11% |
| 12–13 Feb | YouGov/The Times | 2,052 | 40% | 24% | 15% | 11% | 6%[lower-alpha 1] | 4% | 2% | 16% |
| 8–10 Feb | ComRes/Sunday Mirror, Independent on Sunday | 1,218 | 41% | 26% | 11% | 11% | 5% | 4% | 2% | 15% |
| 5–6 Feb | YouGov/The Times | 1,984 | 40% | 24% | 14% | 11% | 6%[lower-alpha 1] | 4% | 1% | 16% |
| 3–5 Feb | ICM/The Guardian | 1,984 | 42% | 27% | 12% | 10% | 5% | 4% | 1% | 15% |
| 31 Jan–1 Feb | Opinium/Observer | 2,005 | 37% | 30% | 14% | 8% | 5% | 5% | 2% | 7% |
| 30–31 Jan | YouGov/The Times | 1,705 | 40% | 26% | 12% | 11% | 6%[lower-alpha 1] | 4% | 1% | 14% |
| 23–24 Jan | YouGov/The Times | 1,643 | 40% | 24% | 14% | 10% | 6%[lower-alpha 1] | 3% | 0% | 16% |
| 20–22 Jan | ICM/The Guardian | 2,052 | 42% | 26% | 13% | 10% | 4% | 5% | 1% | 16% |
| 17–18 Jan | YouGov/The Times | 1,654 | 42% | 25% | 12% | 11% | 6%[lower-alpha 1] | 3% | 0% | 17% |
| 13–16 Jan | Ipsos MORI | 1,132 | 43% | 31% | 6% | 11% | 4% | 4% | * | 12% |
| 13 Jan | Survation/Mail on Sunday | 1,177 | 38% | 29% | 13% | 10% | 4% | 2% | 4% | 9% |
| 10–12 Jan | Opinium/Observer | 2,007 | 38% | 30% | 14% | 7% | 5% | 4% | 2% | 8% |
| 9–10 Jan | YouGov/The Times | 1,660 | 39% | 28% | 13% | 11% | 6%[lower-alpha 1] | 3% | 1% | 11% |
| 6–8 Jan | ICM/The Guardian | 2,000 | 42% | 28% | 12% | 9% | 4% | 4% | * | 14% |
| 3–4 Jan | YouGov/The Times | 1,740 | 39% | 26% | 14% | 10% | 6%[lower-alpha 1] | 4% | 1% | 13% |
2016
| Date(s) conducted |
Polling organisation/client | Sample size | Con | Lab | UKIP | Lib Dem | SNP | Green | Others | Lead |
|---|---|---|---|---|---|---|---|---|---|---|
| 18–19 Dec | YouGov/The Times | 1,595 | 39% | 24% | 14% | 12% | 6%[lower-alpha 1] | 4% | 1% | 15% |
| 13–16 Dec | Opinium/Observer | 2,000 | 38% | 31% | 13% | 6% | 6% | 4% | 1% | 7% |
| 9–12 Dec | Ipsos MORI | 1,003 | 40% | 29% | 9% | 14% | 4% | 3% | 1% | 11% |
| 9–11 Dec | ICM/The Guardian | 2,049 | 41% | 27% | 14% | 9% | 4% | 3% | 1% | 14% |
| 8 Dec | Sleaford and North Hykeham by-election | |||||||||
| 4–5 Dec | YouGov/The Times | 1,667 | 42% | 25% | 12% | 11% | 6%[lower-alpha 1] | 4% | 1% | 17% |
| 1 Dec | Richmond Park by-election | |||||||||
| 28–29 Nov | YouGov/The Times | 1,624 | 39% | 27% | 14% | 9% | 6%[lower-alpha 1] | 4% | 1% | 12% |
| 28 Nov | Paul Nuttall is elected as the leader of UKIP | |||||||||
| 25–27 Nov | ICM/The Guardian | 2,009 | 44% | 28% | 12% | 7% | 4% | 4% | 2% | 16% |
| 21–22 Nov | YouGov/The Times | 1,693 | 41% | 28% | 12% | 9% | 6%[lower-alpha 1] | 4% | 0% | 13% |
| 18–20 Nov | ICM/The Guardian | 2,031 | 42% | 28% | 11% | 9% | 4% | 3% | 2% | 14% |
| 15–18 Nov | Opinium | 2,005 | 41% | 29% | 12% | 7% | 6% | 3% | 1% | 12% |
| 14–15 Nov | YouGov/The Times | 1,717 | 42% | 28% | 11% | 8% | 7%[lower-alpha 1] | 4% | 1% | 14% |
| 11–14 Nov | Ipsos MORI | 1,013 | 42% | 33% | 7% | 10% | 5%[lower-alpha 1] | 3% | 1% | 9% |
| 1–4 Nov | Opinium | 2,001 | 40% | 32% | 13% | 6% | 6% | 4% | – | 8% |
| 31 Oct–1 Nov | YouGov/The Times | 1,608 | 41% | 27% | 11% | 10% | 6%[lower-alpha 1] | 4% | 1% | 14% |
| 28–30 Oct | ICM/The Guardian | 2,040 | 43% | 27% | 12% | 8% | 4% | 5% | 1% | 16% |
| 24–25 Oct | YouGov/The Times | 1,655 | 40% | 27% | 11% | 11% | 7%[lower-alpha 1] | 3% | 1% | 13% |
| 19–24 Oct | BMG | 1,546 | 42% | 28% | 12% | 8% | 5% | 4% | 1% | 14% |
| 20 Oct | By-elections in Witney and Batley & Spen | |||||||||
| 19–20 Oct | YouGov/Election Data | 1,608 | 42% | 26% | 12% | 8% | 6%[lower-alpha 1] | 5% | 1% | 16% |
| 14–17 Oct | Ipsos MORI | 1,016 | 47% | 29% | 6% | 7% | 6%[lower-alpha 1] | 4% | 1% | 18% |
| 11–12 Oct | YouGov/The Times | 1,669 | 42% | 28% | 11% | 9% | 6%[lower-alpha 1] | 3% | 0% | 14% |
| 7–9 Oct | ICM/The Guardian | 2,017 | 43% | 26% | 11% | 8% | 4% | 6% | 2% | 17% |
| 28–29 Sep | YouGov/The Times | 1,658 | 39% | 30% | 13% | 8% | 6%[lower-alpha 1] | 3% | 0% | 9% |
| 24 Sep | Jeremy Corbyn is re-elected as the Leader of the Labour Party and Leader of the Opposition | |||||||||
| 21–23 Sep | ICM/Sun on Sunday | 2,015 | 41% | 26% | 14% | 8% | 5% | 4% | 2% | 15% |
| 20–23 Sep | BMG | 2,026 | 39% | 28% | 13% | 8% | 5% | 5% | 2% | 11% |
| 19–21 Sep | YouGov/The Times | 3,285 | 39% | 30% | 13% | 8% | 6%[lower-alpha 1] | 3% | 1% | 9% |
| 16 Sep | Diane James is elected the leader of UKIP | |||||||||
| 13–14 Sep | YouGov/The Times | 1,732 | 38% | 31% | 13% | 7% | 6% | 4% | – | 7% |
| 10–14 Sep | Ipsos MORI/Evening Standard | 1,000 | 40% | 34% | 9% | 6% | 4%[lower-alpha 1] | 5% | 1% | 6% |
| 9–11 Sep | ICM/The Guardian | 2,013 | 41% | 27% | 14% | 8% | 5% | 4% | 2% | 14% |
| 4–5 Sep | YouGov/The Times | 1,616 | 40% | 29% | 13% | 7% | 7%[lower-alpha 1] | 3% | – | 11% |
| 2 Sep | Caroline Lucas and Jonathan Bartley are elected joint leaders of the Green Party | |||||||||
| 30–31 Aug | YouGov/The Times | 1,687 | 38% | 30% | 14% | 7% | 6%[lower-alpha 1] | 4% | – | 8% |
| 26–28 Aug | ICM/The Guardian | 2,040 | 41% | 27% | 13% | 9% | 4% | 4% | 2% | 14% |
| 22–23 Aug | YouGov/The Times | 1,660 | 40% | 29% | 13% | 8% | 6%[lower-alpha 1] | 3% | 1% | 11% |
| 11–22 Aug | Lord Ashcroft Polls | 8,011 | 40% | 31% | 13% | 7% | 5% | 3% | 1% | 9% |
| 16–17 Aug | YouGov/The Times | 1,677 | 38% | 30% | 13% | 9% | 7%[lower-alpha 1] | 4% | – | 8% |
| 13–15 Aug | Ipsos MORI/Evening Standard | 1,017 | 45% | 34% | 6% | 7% | 4% | 4% | 1% | 11% |
| 12–15 Aug | ICM | 2,010 | 40% | 28% | 14% | 8% | 4% | 4% | 2% | 12% |
| 8–9 Aug | YouGov/The Times | 1,692 | 38% | 31% | 13% | 8% | 7%[lower-alpha 1] | 4% | – | 7% |
| 5–8 Aug | TNS | 1,199 | 39% | 26% | 11% | 10% | 4% | 7% | 2% | 13% |
| 1–2 Aug | YouGov/The Times | 1,722 | 42% | 28% | 12% | 8% | 6%[lower-alpha 1] | 3% | 1% | 14% |
| 25–26 Jul | YouGov/The Times | 1,680 | 40% | 28% | 13% | 8% | 7%[lower-alpha 1] | 4% | 1% | 12% |
| 22–24 Jul | ICM | 2,012 | 43% | 27% | 13% | 8% | 4% | 4% | 1% | 16% |
| 19–22 Jul | Opinium/Observer | 2,231 | 37% | 31% | 15% | 6% | 6% | 4% | 1% | 6% |
| 17–18 Jul | YouGov | 1,891 | 40% | 29% | 12% | 9% | 7%[lower-alpha 1] | 3% | 1% | 11% |
| 13–15 Jul | ICM | 2,027 | 39% | 29% | 14% | 9% | 4% | 4% | 2% | 10% |
| 13 Jul | Theresa May becomes the Prime Minister of the United Kingdom | |||||||||
| 9–11 Jul | Ipsos MORI | 1,021 | 36% | 35% | 8% | 11% | 5% | 4% | 1% | 1% |
| 8–10 Jul | ICM | 2,025 | 38% | 30% | 15% | 8% | 5% | 4% | 1% | 8% |
| 4–5 Jul | Survation/Constitutional Research Council | 1,008 | 36% | 32% | 12% | 9% | 6% | – | 7% | 4% |
| 1–3 Jul | ICM | 1,979 | 37% | 30% | 15% | 8% | 5% | 4% | 2% | 7% |
| 28–30 Jun | Opinium | 2,006 | 34% | 29% | 17% | 7% | 5% | 4% | 2% | 5% |
| 24–26 Jun | ICM/The Guardian | 2,001 | 36% | 32% | 15% | 7% | 5% | 5% | 1% | 4% |
| 24–25 Jun | Survation/Mail on Sunday | 1,033 | 32% | 32% | 16% | 9% | 4% | 4% | 2% | Tie |
| 23 Jun | UK European Union membership referendum: 52% of voters vote in favour of leaving EU; David Cameron announces he will resign as Prime Minister | |||||||||
| 20–22 Jun | Opinium | 3,011 | 34% | 30% | 19% | 6% | 6% | 4% | 2% | 4% |
| 14–17 Jun | Opinium/Observer | 2,006 | 34% | 30% | 18% | 6% | 6% | 4% | 1% | 4% |
| 16 Jun | Tooting by-election; killing of MP Jo Cox, leading to a suspension of referendum campaigning until 19 June | |||||||||
| 15–16 Jun | ComRes/Sunday Mirror, Independent on Sunday | 2,046 | 34% | 29% | 19% | 8% | 5% | 4% | 2% | 5% |
| 11–14 Jun | Ipsos MORI/Evening Standard | 1,257 | 35% | 34% | 10% | 9% | 5% | 4% | 3% | 1% |
| 10–13 Jun | ICM/The Guardian | 2,001 | 34% | 30% | 19% | 8% | 4% | 4% | 1% | 4% |
| 10–13 Jun | ICM/The Guardian | 1,000 | 34% | 33% | 14% | 9% | 4% | 5% | 2% | 1% |
| 7–10 Jun | Opinium/Observer | 2,009 | 35% | 32% | 18% | 4% | 5% | 4% | 1% | 3% |
| 31 May–3 Jun | Opinium/Observer | 2,007 | 34% | 30% | 18% | 6% | 6% | 4% | 2% | 4% |
| 27–29 May | ICM/The Guardian | 2,052 | 36% | 31% | 17% | 7% | 4% | 4% | 2% | 5% |
| 27–29 May | ICM/The Guardian | 1,004 | 36% | 32% | 15% | 7% | 4% | 3% | 2% | 4% |
| 17–19 May | Opinium/Observer | 2,008 | 35% | 30% | 18% | 5% | 6% | 5% | 2% | 5% |
| 14–16 May | Ipsos MORI/Evening Standard | 1,002 | 36% | 34% | 10% | 8% | 5% | 5% | 2% | 2% |
| 13–15 May | ICM/The Guardian | 1,002 | 36% | 34% | 13% | 7% | 4% | 4% | 2% | 2% |
| 13–15 May | ICM/The Guardian | 2,048 | 34% | 32% | 17% | 7% | 5% | 4% | 1% | 2% |
| 11–12 May | ComRes/Sunday Mirror, Independent on Sunday | 2,043 | 36% | 30% | 17% | 8% | 5% | 4% | – | 6% |
| 5 May | United Kingdom local elections, 2016 including the Ogmore and Sheffield Brightside and Hillsborough by-elections | |||||||||
| 26–29 Apr | Opinium/Observer | 2,005 | 38% | 30% | 15% | 5% | 5% | 5% | 2% | 8% |
| 25–26 Apr | YouGov/The Times | 1,650 | 30% | 33% | 20% | 6% | 8%[lower-alpha 1] | 3% | – | 3% |
| 22–26 Apr | BMG Research | 1,375 | 33% | 32% | 18% | 6% | 5% | 4% | 2% | 1% |
| 16–18 Apr | Ipsos MORI/Evening Standard | 1,026 | 38% | 35% | 11% | 6% | 6% | 3% | 1% | 3% |
| 15–17 Apr | ICM/The Guardian | 1,003 | 38% | 33% | 13% | 7% | 5% | 3% | 1% | 5% |
| 15–17 Apr | ICM/The Guardian | 2,008 | 36% | 31% | 16% | 7% | 4% | 4% | 2% | 5% |
| 13–14 Apr | ComRes/Sunday Mirror, Independent on Sunday | 2,036 | 35% | 30% | 16% | 8% | 5% | 4% | 1% | 5% |
| 11–12 Apr | YouGov/The Times | 1,639 | 31% | 34% | 17% | 8% | 7%[lower-alpha 1] | 3% | – | 3% |
| 29 Mar–1 Apr | Opinium/Observer | 1,966 | 33% | 32% | 17% | 5% | 6% | 4% | 2% | 1% |
| 24–29 Mar | BMG Research | 1,298 | 36% | 31% | 16% | 7% | 5% | 5% | 2% | 5% |
| 19–22 Mar | Ipsos MORI | 1,023 | 36% | 34% | 11% | 10% | 5% | 3% | 2% | 2% |
| 18–20 Mar | ComRes/Daily Mail | 1,002 | 37% | 35% | 9% | 7% | 5% | 4% | 2% | 2% |
| 16–17 Mar | YouGov/The Times | 1,691 | 33% | 34% | 16% | 6% | 6%[lower-alpha 1] | 3% | 2% | 1% |
| 11–13 Mar | ICM/The Guardian | 1,001 | 36% | 36% | 11% | 8% | 3% | 3% | 1% | Tie |
| 9–10 Mar | ComRes/Sunday Mirror, Independent on Sunday | 2,059 | 38% | 29% | 16% | 7% | 4% | 4% | 1% | 9% |
| 21–23 Feb | YouGov/The Times | 3,482 | 37% | 30% | 16% | 8% | 6%[lower-alpha 1] | 3% | – | 7% |
| 17–23 Feb | BMG Research | 1,268 | 38% | 30% | 16% | 5% | 5% | 5% | 2% | 8% |
| 19–22 Feb | ComRes/Daily Mail | 1,000 | 38% | 31% | 12% | 8% | 4% | 3% | 3% | 7% |
| 13–16 Feb | Ipsos MORI | 1,001 | 39% | 33% | 12% | 6% | 6% | 3% | 2% | 6% |
| 12–14 Feb | ICM/The Guardian | 1,004 | 39% | 32% | 11% | 7% | 4% | 4% | 3% | 7% |
| 10–12 Feb | ComRes/Sunday Mirror, Independent on Sunday | 2,018 | 41% | 27% | 15% | 9% | 5% | 3% | 1% | 14% |
| 3–4 Feb | YouGov/The Times | 1,675 | 39% | 29% | 18% | 6% | 4%[lower-alpha 1] | 3% | 1% | 10% |
| 27–28 Jan | YouGov | 1,735 | 39% | 30% | 17% | 6% | 4%[lower-alpha 1] | 3% | 1% | 9% |
| 23–25 Jan | Ipsos MORI | 1,027 | 40% | 31% | 11% | 7% | 5% | 4% | 1% | 9% |
| 22–24 Jan | ComRes/Daily Mail | 1,006 | 37% | 32% | 12% | 6% | 4% | 4% | 4% | 5% |
| 15–17 Jan | ICM/The Guardian | 1,001 | 40% | 35% | 10% | 6% | 4% | 3% | 2% | 5% |
| 15–16 Jan | Survation/Mail on Sunday | 1,017 | 37% | 30% | 16% | 7% | 5% | 3% | 3% | 7% |
| 13–15 Jan | ComRes/Sunday Mirror, Independent on Sunday | 2,004 | 40% | 29% | 16% | 7% | 4% | 3% | 1% | 11% |
| 8–14 Jan | Panelbase/Sunday Times | 2,087 | 39% | 31% | 14% | 6% | 5% | 5% | – | 8% |
2015
| Date(s) conducted |
Polling organisation/client | Sample size | Con | Lab | UKIP | Lib Dem | SNP | Green | Others | Lead |
|---|---|---|---|---|---|---|---|---|---|---|
| 18–20 Dec | ICM/The Guardian | 1,003 | 39% | 34% | 10% | 7% | 4% | 3% | 3% | 5% |
| 17–18 Dec | YouGov/The Times | 1,598 | 39% | 29% | 17% | 6% | 5%[lower-alpha 1] | 3% | 1% | 10% |
| 15–18 Dec | Opinium/Observer | 1,936 | 38% | 30% | 16% | 5% | 6% | 5% | 2% | 8% |
| 12–14 Dec | Ipsos MORI/Evening Standard | 1,040 | 38% | 31% | 9% | 9% | 5% | 6% | 2% | 7% |
| 11–13 Dec | ComRes/Daily Mail | 1,001 | 37% | 33% | 11% | 7% | 4% | 5% | 2% | 4% |
| 9–11 Dec | ComRes/Independent on Sunday, Sunday Mirror | 2,049 | 40% | 29% | 16% | 7% | 4% | 3% | 1% | 11% |
| 3 Dec | Oldham West and Royton by-election | |||||||||
| 30 Nov–1 Dec | YouGov/The Times | 1,657 | 41% | 30% | 16% | 6% | 4%[lower-alpha 1] | 3% | 1% | 11% |
| 20–24 Nov | YouGov | 4,317 | 38% | 29% | 17% | 6% | 5%[lower-alpha 1] | 3% | 1% | 9% |
| 20–22 Nov | ComRes/Daily Mail | 1,000 | 40% | 29% | 11% | 8% | 4% | 3% | 4% | 11% |
| 18–20 Nov | ComRes/Independent on Sunday, Sunday Mirror | 2,067 | 42% | 27% | 15% | 7% | 5% | 3% | 1% | 15% |
| 16–17 Nov | Survation/Leave.EU[lower-alpha 3] | 1,546 | 37% | 30% | 16% | 6% | 5% | 3% | 3% | 7% |
| 14–17 Nov | Ipsos MORI/Evening Standard | 1,021 | 41% | 34% | 7% | 7% | 6% | 4% | - | 7% |
| 11–17 Nov | BMG Research | 1,334 | 37% | 30% | 15% | 7% | 4% | 4% | 2% | 7% |
| 13–15 Nov | ICM/The Guardian | 1,006 | 39% | 33% | 12% | 7% | 5% | 3% | 1% | 6% |
| 9–11 Nov | Survation/Leave.EU[lower-alpha 3] | 2,007 | 36% | 30% | 15% | 7% | 5% | 3% | 3% | 6% |
| 22–27 Oct | BMG Research | 1,467 | 37% | 31% | 15% | 6% | 4% | 5% | 2% | 6% |
| 23–25 Oct | ComRes/Daily Mail | 1,002 | 38% | 33% | 10% | 8% | 3% | 3% | 4% | 5% |
| 17–19 Oct | Ipsos MORI/Evening Standard | 1,021 | 36% | 32% | 12% | 10% | 5% | 3% | 2% | 4% |
| 13–16 Oct | Opinium | 1,934 | 37% | 32% | 15% | 5% | 6% | 4% | 2% | 5% |
| 14–15 Oct | ComRes/Independent on Sunday, Sunday Mirror | 2,051 | 42% | 29% | 13% | 7% | 5% | 3% | 1% | 13% |
| 9–11 Oct | ICM/The Guardian | 1,002 | 38% | 34% | 11% | 7% | 5% | 3% | 3% | 4% |
| 29–30 Sep | YouGov/The Sun | 2,064 | 37% | 31% | 17% | 7% | 5%[lower-alpha 1] | 2% | 1% | 6% |
| 26–28 Sep | ComRes/Daily Mail | 1,009 | 39% | 30% | 12% | 9% | 4% | 4% | 3% | 9% |
| 21–22 Sep | Survation/Huffington Post | 1,008 | 37% | 32% | 13% | 9% | 5% | 3% | 1% | 5% |
| 19–22 Sep | Ipsos MORI/Evening Standard | 1,255 | 39% | 34% | 7% | 9% | 5% | 4% | 1% | 5% |
| 17–18 Sep | YouGov/Sunday Times | 1,601 | 39% | 31% | 16% | 6% | 5%[lower-alpha 1] | 3% | 1% | 8% |
| 15–18 Sep | Opinium | 1,942 | 37% | 32% | 14% | 6% | 5% | 4% | 1% | 5% |
| 16–17 Sep | ComRes/Independent on Sunday, Sunday Mirror | 2,015 | 42% | 30% | 13% | 7% | 5% | 3% | 1% | 12% |
| 11–13 Sep | ICM/The Guardian | 1,006 | 38% | 32% | 13% | 8% | 5% | 3% | 2% | 6% |
| 12 Sep | Jeremy Corbyn is elected leader of the Labour Party and appointed Leader of the Opposition | |||||||||
| 3–4 Sep | Survation/Mail on Sunday | 1,004 | 38% | 32% | 13% | 6% | 5% | 4% | 2% | 6% |
| 21–23 Aug | ComRes/Daily Mail | 1,001 | 42% | 28% | 9% | 8% | 5% | 6% | 3% | 14% |
| 12–13 Aug | ComRes/Independent on Sunday, Sunday Mirror | 2,035 | 40% | 29% | 13% | 8% | 5% | 4% | 1% | 11% |
| 12–13 Aug | Survation/TSSA | 1,007 | 38% | 33% | 15% | 6% | 5% | 3% | 1% | 5% |
| 7–9 Aug | ICM/The Guardian | 1,000 | 40% | 31% | 10% | 7% | 5% | 4% | 2% | 9% |
| 24–26 Jul | ComRes/Daily Mail | 1,001 | 40% | 28% | 10% | 7% | 5% | 5% | 4% | 12% |
| 18–20 Jul | Ipsos MORI/Evening Standard | 1,026 | 37% | 31% | 9% | 10% | 5% | 8% | 1% | 6% |
| 16 Jul | Tim Farron is elected leader of the Liberal Democrats | |||||||||
| 10–12 Jul | ICM/The Guardian | 1,005 | 38% | 34% | 13% | 6% | 4% | 4% | 1% | 4% |
| 26–28 Jun | ComRes/Daily Mail | 1,002 | 39% | 27% | 11% | 9% | 5% | 6% | 3% | 12% |
| 14–16 Jun | Ipsos MORI/Evening Standard | 1,005 | 39% | 30% | 8% | 9% | 5% | 6% | 2% | 9% |
| 12–14 Jun | ICM/The Guardian | 1,004 | 37% | 31% | 13% | 8% | 5% | 5% | 1% | 6% |
| 29–31 May | ComRes/Daily Mail | 1,000 | 41% | 29% | 10% | 8% | 5% | 5% | 3% | 12% |
| 25–26 May | YouGov/The Sun | 1,709 | 41% | 30% | 13% | 7% | 4%[lower-alpha 1] | 4% | 1% | 11% |
| 8–9 May | Survation/Mail on Sunday | 1,027 | 40% | 31% | 12% | 6% | 5% | 3% | 2% | 9% |
| 7 May | General Election results (GB only)[4][5] | – | 37.8% | 31.2% | 12.9% | 8.1% | 4.9% | 3.8% | 1.4% | 6.6% |
YouGov model
During the election campaign, YouGov created a Multi-level Regression and Post-stratification (MRP) model based on poll data. As set out by YouGov, the model "works by modelling every constituency and key voter types in Britain based on analysis of key demographics as well as past voting behaviour", with new interviews to registered voters conducted every day.[6]
| Date(s) conducted |
Polling organisation/client | Sample size | Con | Lab | UKIP | Lib Dem | SNP | Green | Others | Lead |
|---|---|---|---|---|---|---|---|---|---|---|
| 8 June | General Election results (GB only) [7] | – | 43.5% | 41.0% | 1.9% | 7.6% | 3.1% | 1.7% | 1.2% | 2.5% |
| 31 May–6 Jun | YouGov | 55,707 | 42% | 38% | 3% | 9% | 4% | 2% | 1% | 4% |
| 30 May–5 Jun | YouGov | 53,241 | 42% | 38% | 4% | 9% | 4% | 2% | 1% | 4% |
| 29 May–4 Jun | YouGov | 53,609 | 42% | 38% | 3% | 9% | 4% | 2% | 2% | 4% |
| 27 May–2 Jun | YouGov | 51,945 | 42% | 38% | 3% | 9% | 4% | 2% | 2% | 4% |
| 26 May–1 Jun | YouGov | 53,000 | 42% | 38% | 3% | 9% | 4% | 2% | 1% | 4% |
| 25–31 May | YouGov | 53,611 | 42% | 38% | 3% | 9% | 4% | 2% | 2% | 4% |
| 24–30 May | YouGov | 53,464 | 41% | 38% | 4% | 9% | 4% | 2% | 2% | 3% |
| 23–29 May | YouGov | ~50,000 | 42% | 38% | 4% | 9% | 7% | 4% | ||
UK-wide seat projections
The UK's first-past-the-post electoral system means that national shares of the vote do not give an exact indicator of how the various parties will be represented in Parliament. Different commentators and pollsters provided a number of predictions, based on polls and other data, as to how the parties would be represented in Parliament:
| Parties | 2015 election result |
Election Forecast[8] as of 7 June 2017 |
Electoral Calculus[9] as of 7 June 2017 |
Lord Ashcroft[10] as of 6 June 2017[11] |
Elections Etc.[12] as of 2 June 2017 |
New Statesman[13] as of 6 June 2017 |
YouGov[14] as of 7 June 2017 |
Britain Elects[15] as of 7 June 2017 |
Scenari Politici.com[16] as of 7 June 2017 |
Forecast UK[17]
as of 8 June 2017 |
BBC/ITV/Sky exit poll 8 June 2017 |
2017 election result | |
|---|---|---|---|---|---|---|---|---|---|---|---|---|---|
| Conservatives | 330 | 371 | 361 | 357 | 360 | 339 | 302 | 353 | 365 | 344-351 | 314 | 318 | |
| Labour Party | 232 | 199 | 215 | 222 | 210 | 224 | 269 | 219 | 208 | 221-230 | 266 | 262 | |
| SNP | 56 | 50 | 48 | 45 | 48 | 57 | 44 | 46 | 49 | 44-52 | 34 | 35 | |
| Liberal Democrats | 8 | 7 | 4 | 4 | 9 | 8 | 12 | 9 | 6 | 5-7 | 14 | 12 | |
| Plaid Cymru | 3 | 2 | 3 | 1 | 3 | — | 2 | 3 | 3 | 2-4 | 3 | 4 | |
| Green Party | 1 | 1 | 1 | 0 | 1 | — | 1 | 1 | 1 | 0-2 | 1 | 1 | |
| UKIP | 1 | 1 | 0 | 0 | 0 | — | 0 | 0 | 0 | 0 | 0 | 0 | |
| Others | 19 | 1[lower-alpha 4] | 18[lower-alpha 5] | 19 | — | — | 20 | 19 | 18 | 19 | 18 | 18 | |
| Overall result | Conservative majority of 10 |
Conservative majority of 92 |
Conservative majority of 72 |
Conservative majority of 64 |
Conservative majority of 70 |
Conservative majority of 28 |
Hung Parliament (Con 24 seats short) |
Conservative majority of 56 |
Conservative majority of 84 |
Conservative majority of 46 |
Hung Parliament (Con 12 seats short) |
Hung Parliament (Con 8 seats short) | |
Lord Ashcroft Polls announced an estimate for the election result. He updated it at intervals on his website.[18][19]
Electoral Calculus maintained a running projection of seats according to latest polls on its website based on universal changes from the previous general election results according to opinion poll averages. It also maintained a seat-by-seat projection for Scotland.[9]
Election Forecast also maintained a projection of seats based on current opinion poll averages on their website.[8]
Elections Etc. issued regular forecasts based on current opinion poll averages, betting markets, expert predictions and other sources on their website.[12]
YouGov issued daily seat estimates using their aggregated statistical election model.[14]
Britain Elects maintained a 'nowcast' of seats based on historical data as well as national and regional polling.[15]
ScenariPolitici.com maintained a projection of seats based on current opinion poll averages on their website.[20]
Sub-national polling
Scotland
.png)
| Date(s) conducted |
Polling organisation/client | Sample size | SNP | Lab | Con | Lib Dem | UKIP | Green | Others | Lead |
|---|---|---|---|---|---|---|---|---|---|---|
| 8 June | General Election results[21] | 2,649,695 | 36.9% | 27.1% | 28.6% | 6.8% | 0.2% | 0.2% | 0.2% | 8.3% |
| 7 Jun 2017 | Survation/The Daily Record | 1,001 | 39% | 29% | 26% | 6% | * | 10% | ||
| 2–7 Jun 2017 | Panelbase | 1,106 | 41% | 22% | 30% | 5% | <1% | 2% | <1% | 11% |
| 31 May–2 Jun 2017 | Survation/The Sunday Post | 1,024 | 40% | 25% | 27% | 6% | 2% | 13% | ||
| 1–5 Jun 2017 | YouGov/The Times | 1,093 | 41% | 25% | 26% | 6% | * | 1% | 2% | 15% |
| 31 May–2 Jun 2017 | Survation/The Sunday Post | 1,024 | 40% | 25% | 27% | 6% | 2% | 13% | ||
| 26–31 May 2017 | Panelbase/The Sunday Times | 1,021 | 42% | 20% | 30% | 5% | 2% | 1% | – | 12% |
| 22–27 May 2017 | Ipsos-Mori/STV | 1,016 | 43% | 25% | 25% | 5% | 2% | 18% | ||
| 19–25 May 2017 | SurveyMonkey/The Scottish Sun | 1,970 | 39% | 25% | 29% | 4% | 1% | 2% | 10% | |
| 15–18 May 2017 | YouGov/The Times | 1,032 | 42% | 19% | 29% | 6% | 1% | 2% | 1% | 13% |
| 12–18 May 2017 | BMG/The Herald | over 1,000 | 43% | 18% | 30% | 5% | 4% | 13% | ||
| 4 May 2017 | Scottish local elections, 2017 | |||||||||
| 24–27 Apr 2017 | YouGov/The Times | 1,017 | 41% | 18% | 28% | 7% | 2% | 3% | 1% | 13% |
| 18–21 Apr 2017 | Panelbase/Sunday Times | 1,029 | 44% | 13% | 33% | 5% | 2% | 2% | 1% | 11% |
| 18–21 Apr 2017 | Survation/Sunday Post | 1,018 | 43% | 18% | 28% | 9% | 3% | 15% | ||
| 18 Apr 2017 | Prime Minister Theresa May announces her intention to seek a general election to be held on 8 June 2017 | |||||||||
| 17 Mar 2017 | Panelbase/Sunday Times | 1,008 | 47% | 14% | 28% | 4% | 3% | 3% | <1% | 19% |
| 20–26 Jan 2017 | Panelbase/Sunday Times | 1,020 | 47% | 15% | 27% | 4% | 3% | 3% | <1% | 20% |
| 28 Sep–4 Oct 2016 | BMG | 1,010 | 49% | 17% | 20% | 8% | 2% | 3% | - | 29% |
| 9–15 Sep 2016 | Panelbase/Sunday Times | 1,024 | 47% | 16% | 24% | 5% | 4% | 3% | - | 23% |
| 13 Jul 2016 | Theresa May becomes the Prime Minister of the United Kingdom | |||||||||
| 5 May 2016 | Scottish Parliament election | |||||||||
| 7–10 Sep 2015 | Survation/Scottish Daily Mail | 1,010 | 52% | 21% | 16% | 6% | 2% | 3% | - | 31% |
| 15 Aug 2015 | Kezia Dugdale is elected leader of the Scottish Labour Party | |||||||||
| 3–7 Jul 2015 | Survation/Scottish Daily Mail | 1,084 | 51% | 21% | 17% | 7% | 2% | 2% | - | 30% |
| 7 May 2015 | General Election results | 2,910,465 | 50.0% | 24.3% | 14.9% | 7.5% | 1.6% | 1.3% | 0.3% | 25.7% |
Wales
| Date(s) conducted |
Polling organisation/client | Sample size | Lab | Con | UKIP | Plaid | Lib Dem | Green | Others | Lead |
|---|---|---|---|---|---|---|---|---|---|---|
| 8 June | General Election results[22] | – | 48.9% | 33.6% | 2.0% | 10.4% | 4.5% | 0.3% | 0.2% | 15.3% |
| 5–7 June 2017 | YouGov/ITV | 1,074 | 46% | 34% | 5% | 9% | 5% | 1% | 12% | |
| 29–31 May 2017 | YouGov/ITV | 1,014 | 46% | 35% | 5% | 8% | 5% | 0% | 0% | 11% |
| 18–21 May 2017 | YouGov/ITV | 1,025 | 44% | 34% | 5% | 9% | 6% | 1% | 1% | 10% |
| 5–7 May 2017 | YouGov/ITV | 1,018 | 35% | 41% | 4% | 11% | 7% | 1% | 1% | 6% |
| 4 May 2017 | Welsh local elections, 2017 | |||||||||
| 19–21 April 2017 | YouGov/Welsh Political Barometer | 1,029 | 30% | 40% | 6% | 13% | 8% | 2% | 1% | 10% |
| 18 Apr | Prime Minister Theresa May announces her intention to seek a general election to be held on 8 June 2017 | |||||||||
| 3–6 Jan 2017 | YouGov/Welsh Political Barometer | 1,034 | 33% | 28% | 13% | 13% | 9% | 2% | 0 | 5% |
| 18–21 Sep 2016 | YouGov/Welsh Political Barometer | 1,001 | 35% | 29% | 14% | 13% | 7% | 2% | 0 | 6% |
| 13 Jul 2016 | Theresa May becomes the Prime Minister of the United Kingdom | |||||||||
| 30 Jun–4 Jul 2016 | YouGov/Welsh Political Barometer | 1,010 | 34% | 23% | 16% | 16% | 8% | 1% | 2% | 11% |
| 5 May 2016 | Welsh Assembly election and Ogmore by-election | |||||||||
| 19–22 Apr 2016 | YouGov/Welsh Political Barometer | 1,001 | 37% | 23% | 17% | 13% | 7% | 2% | 1% | 14% |
| 7–11 Apr 2016 | YouGov/ITV Wales | 1,011 | 38% | 22% | 18% | 13% | 6% | 2% | 1% | 16% |
| 7–18 Mar 2016 | Welsh Election Study | 3,272 | 36% | 25% | 16% | 14% | 6% | N/A | 3%[23] | 11% |
| 9–11 Feb 2016 | YouGov/Welsh Political Barometer | 1,024 | 37% | 27% | 18% | 13% | 4% | 1% | - | 10% |
| 30 Nov–4 Dec 2015 | YouGov/Welsh Political Barometer | 1,005 | 37% | 27% | 17% | 12% | 4% | 2% | - | 10% |
| 21–24 Sep 2015 | YouGov/Welsh Political Barometer | 1,151 | 42% | 26% | 16% | 10% | 5% | 2% | - | 16% |
| 24–26 Jun 2015 | YouGov/Welsh Political Barometer | 1,151 | 37% | 28% | 15% | 12% | 4% | 3% | 1% | 9% |
| 7 May 2015 | General Election results | – | 36.9% | 27.2% | 13.6% | 12.1% | 6.5% | 2.6% | 1.0% | 9.7% |
Northern Ireland
| Date(s) conducted |
Polling organisation/client | Sample size | DUP | SF | UUP | SDLP | Alliance | TUV | Green | Others | Lead |
|---|---|---|---|---|---|---|---|---|---|---|---|
| 8 June | General Election results[24] | – | 36.0% | 29.4% | 10.3% | 11.7% | 7.9% | 0.4% | 0.9% | 3.3% | 6.6% |
| 1–3 June 2017 | Lucid Talk | 3,419 | 28.9% | 28.1% | 15.4% | 13.8% | 9.9% | 0.1% | 0.6% | 3.2% | 0.8% |
| 17–18 May 2017 | Lucid Talk | 3,341 | 28.8% | 27.9% | 15.7% | 13.7% | 9.8% | 0.1% | 0.7% | 3.3% | 0.9% |
| 27–29 April 2017 | Lucid Talk | 3,187 | 29.4% | 27.7% | 14.8% | 12.4% | 10.2% | 0.6% | 1.8% | 3.1% | 1.7% |
| 18 Apr 2017 | Prime Minister Theresa May announces her intention to seek a general election to be held on 8 June 2017 | ||||||||||
| 2 Mar 2017 | Northern Ireland Assembly election, 2017 | ||||||||||
| 5 May 2016 | Northern Ireland Assembly election, 2016 | ||||||||||
| 7 May 2015 | General Election Results | – | 25.7% | 24.5% | 16.0% | 13.9% | 8.6% | 2.3% | 1.0% | 8.2% | 1.2% |
Regional polling in England
North East England
| Date(s) conducted |
Polling organisation/client | Sample size | Lab | Con | UKIP | Lib Dem | Green | Others | Lead |
|---|---|---|---|---|---|---|---|---|---|
| 8 June 2017 | 2017 Election | – | 55.5% | 34.4% | 3.9% | 4.6% | 1.3% | 0.5% | 21.1% |
| 24 Apr–5 May 2017 | YouGov | 639 | 42% | 40% | 8% | 6% | 2% | 0% | 2% |
| 7 May 2015 | 2015 Election | – | 46.9% | 25.3% | 16.7% | 6.5% | 3.6% | 0.9% | 21.6% |
North West England
| Date(s) conducted |
Polling organisation/client | Sample size | Lab | Con | UKIP | Lib Dem | Green | Others | Lead | |
|---|---|---|---|---|---|---|---|---|---|---|
| 8 June 2017 | 2017 Election | – | 54.9% | 36.2% | 1.9% | 5.4% | 1.1% | 0.5% | 18.7% | |
| 24 Apr–5 May 2017 | YouGov | 1,537 | 42% | 42% | 6% | 8% | 2% | 0% | Tie | |
| 23 Feb 2017 | Copeland by-election | |||||||||
| 3 Dec 2015 | Oldham West and Royton by-election | |||||||||
| 7 May 2015 | 2015 Election | – | 44.6% | 31.2% | 13.6% | 6.5% | 3.2% | 0.7% | 13.4% | |
Yorkshire and the Humber
| Date(s) conducted |
Polling organisation/client | Sample size | Lab | Con | UKIP | Lib Dem | Green | Others | Lead | |
|---|---|---|---|---|---|---|---|---|---|---|
| 8 June 2017 | 2017 Election | – | 49.0% | 40.5% | 2.6% | 5.0% | 1.3% | 1.7% | 8.5% | |
| 24 Apr–5 May 2017 | YouGov | 1,293 | 38% | 43% | 7% | 9% | 2% | 0% | 5% | |
| 20 Oct 2016 | Batley and Spen by-election | |||||||||
| 5 May 2016 | Sheffield Brightside and Hillsborough by-election | |||||||||
| 7 May 2015 | 2015 Election | – | 39.1% | 32.6% | 16.0% | 7.1% | 3.5% | 1.6% | 6.5% | |
East Midlands
| Date(s) conducted |
Polling organisation/client | Sample size | Con | Lab | UKIP | Lib Dem | Green | Others | Lead | |
|---|---|---|---|---|---|---|---|---|---|---|
| 8 June 2017 | 2017 Election | – | 50.7% | 40.5% | 2.4% | 4.3% | 1.4% | 0.6% | 10.2% | |
| 24 Apr–5 May 2017 | YouGov | 1,164 | 54% | 28% | 7% | 8% | 2% | 0% | 26% | |
| 8 Dec 2016 | Sleaford and North Hykeham by-election | |||||||||
| 7 May 2015 | 2015 Election | – | 43.5% | 31.6% | 15.8% | 5.6% | 3.0% | 0.6% | 11.9% | |
West Midlands
| Date(s) conducted |
Polling organisation/client | Sample size | Con | Lab | UKIP | Lib Dem | Green | Others | Lead | |
|---|---|---|---|---|---|---|---|---|---|---|
| 8 June 2017 | 2017 Election | – | 49.0% | 42.5% | 1.8% | 4.4% | 1.7% | 0.6% | 6.5% | |
| 24 Apr–5 May 2017 | YouGov | 1,211 | 51% | 28% | 9% | 9% | 2% | 0% | 23% | |
| 23 Feb 2017 | Stoke-on-Trent Central by-election | |||||||||
| 7 May 2015 | 2015 Election | – | 41.8% | 32.9% | 15.7% | 5.5% | 3.3% | 0.8% | 8.9% | |
East of England
| Date(s) conducted |
Polling organisation/client | Sample size | Con | Lab | UKIP | Lib Dem | Green | Others | Lead |
|---|---|---|---|---|---|---|---|---|---|
| 8 June 2017 | 2017 Election | – | 54.6% | 32.7% | 2.5% | 7.9% | 1.9% | 0.3% | 21.9% |
| 24 Apr–5 May 2017 | YouGov | 1,339 | 56% | 19% | 9% | 12% | 2% | 1% | 37% |
| 7 May 2015 | 2015 Election | – | 49.0% | 22.0% | 16.2% | 8.2% | 3.9% | 0.5% | 27.0% |
London
| Date(s) conducted |
Polling organisation/client | Sample size | Lab | Con | UKIP | Lib Dem | Green | Others | Lead | |
|---|---|---|---|---|---|---|---|---|---|---|
| 8 June 2017 | 2017 Election | – | 54.5% | 33.2% | 1.3% | 8.8% | 1.8% | 0.5% | 21.3% | |
| 26–31 May 2017 | YouGov | 1,000 | 50% | 33% | 3% | 11% | 2% | 1% | 17% | |
| 19–23 May 2017 | YouGov | 1,006 | 50% | 34% | 2% | 11% | 2% | 1% | 16% | |
| 22 Apr–3 May 2017 | YouGov | 1,040 | 41% | 36% | 6% | 14% | 3% | 1% | 5% | |
| 18 Apr 2017 | Prime Minister Theresa May announces her intention to seek a general election to be held on 8 June 2017 | |||||||||
| 24–28 Mar 2017 | YouGov | 1,042 | 37% | 34% | 9% | 14% | 5% | 1% | 3% | |
| 1 Dec 2016 | Richmond Park by-election | |||||||||
| 16 Jun 2016 | Tooting by-election | |||||||||
| 15–19 Apr 2016 | YouGov/LBC | 1,017 | 46% | 30% | 13% | 7% | 4% | 1% | 16% | |
| 4–6 Jan 2016 | YouGov/LBC | 1,156 | 44% | 37% | 11% | 4% | 2% | 2% | 7% | |
| 8 Jun–12 Aug 2015 | YouGov/LBC | 3,436 | 42% | 38% | 9% | 5% | 4% | 1% | 4% | |
| 7 May 2015 | 2015 Election | – | 43.7% | 34.9% | 8.1% | 7.7% | 4.9% | 0.8% | 8.8% | |
South East
| Date(s) conducted |
Polling organisation/client | Sample size | Con | Lab | UKIP | Lib Dem | Green | Others | Lead | |
|---|---|---|---|---|---|---|---|---|---|---|
| 8 June 2017 | 2017 Election | 4,635,741 | 54.6% | 28.6% | 2.3% | 10.5% | 3.1% | 1.0% | 26.0% | |
| 24 Apr–5 May 2017 | YouGov | 2,062 | 56% | 19% | 6% | 15% | 3% | 1% | 37% | |
| 20 Oct 2016 | Witney by-election | |||||||||
| 7 May 2015 | 2015 Election | 4,394,360 | 50.8% | 18.3% | 14.7% | 9.4% | 5.2% | 1.5% | 32.5% | |
South West
| Date(s) conducted |
Polling organisation/client | Sample size | Con | Lab | Lib Dem | UKIP | Green | Others | Lead |
|---|---|---|---|---|---|---|---|---|---|
| 8 June 2017 | 2017 Election | – | 51.4% | 29.1% | 15.0% | 1.1% | 2.3% | 1.2% | 22.3% |
| 24 Apr–5 May 2017 | YouGov | 1,378 | 52% | 22% | 16% | 6% | 3% | 1% | 30% |
| 7 May 2015 | 2015 Election | – | 46.5% | 17.7% | 15.1% | 13.6% | 5.9% | 1.2% | 28.8% |
Polls of individual constituencies
Battersea
Polling was conducted in Battersea with and without a hypothetical 'Independent Stop Brexit' candidate. Chris Coghlan is standing in Battersea as an independent anti-Brexit candidate, but as his ballot description is 'independent' and not 'Stop Brexit', and he was not named in the poll, this is technically a hypothetical poll.
| Date(s) conducted |
Polling organisation/client | Sample size | Con | Lab | Lib Dem | Others | Lead |
|---|---|---|---|---|---|---|---|
| 8 Jun 2017 | 2017 Election Result | N/A | 41.5% | 45.9% | 8.0% | 4.6% | 4.4% |
| 9–10 May 2017 | Survation/Chris Coghlan | 503 | 46% | 38% | 13% | 5% | 8% |
| 7 May 2015 | 2015 Election Result | N/A | 52.4% | 36.8% | 4.4% | 6.4% | 15.6% |
Brighton Pavilion
| Date(s) conducted |
Polling organisation/client | Sample size | Green | Lab | Con | UKIP | Lib Dem† | Others | Lead |
|---|---|---|---|---|---|---|---|---|---|
| 8 Jun 2017 | 2017 Election Result | N/A | 52.3% | 26.8% | 19.2% | 1.1% | — | 0.7% | 25.5% |
| 27 Apr-1 May 2017 | ICM Unlimited | 1,001 | 47% | 23% | 25% | 3% | 2% | 0% | 22% |
| 7 May 2015 | 2015 Election Result | – | 41.8% | 27.3% | 22.8% | 5.0% | 2.8% | 0.4% | 14.6% |
†The Liberal Democrats are not fielding a candidate in Brighton Pavilion.
Edinburgh South
| Date(s) conducted |
Polling organisation/client | Sample size | Lab | SNP | Con | Green† | Lib Dem | Others† | Lead |
|---|---|---|---|---|---|---|---|---|---|
| 8 Jun 2017 | 2017 Election Result | N/A | 54.9% | 22.5% | 19.7% | — | 2.9% | — | 32.4% |
| 3–4 April 2017 | Survation/Stop Brexit Alliance | 530 | 40% | 30% | 20% | 7% | 3% | 1% | 10% |
| 7 May 2015 | 2015 Election Result | – | 39.1% | 33.8% | 17.5% | 4.2% | 3.7% | 1.6% | 5.3% |
†The Scottish Greens and other political parties are not fielding candidates in Edinburgh South.
Kensington
| Date(s) conducted |
Polling organisation/client | Sample size | Con | Lab | Lib Dem | Green | UKIP | Others | Lead |
|---|---|---|---|---|---|---|---|---|---|
| 8 Jun 2017 | 2017 Election Result | N/A | 42.2% | 42.2% | 12.2% | 2.0% | — | 1.4% | 0.0% |
| 25–27 Apr 2017 | Survation/Stop Brexit Alliance | 522 | 46% | 29% | 17% | 7% | 1% | 0% | 17% |
| 7 May 2015 | 2015 Election Result | – | 52.3% | 31.1% | 5.6% | 5.1% | 4.5% | 1.5% | 21.2% |
Tatton
| Date(s) conducted |
Polling organisation/client | Sample size | Con | Lab | UKIP† | Lib Dem | Others | Lead |
|---|---|---|---|---|---|---|---|---|
| 8 Jun 2017 | 2017 Election Result | N/A | 58.6% | 28.5% | — | 9.0% | 4.0% | 30.1% |
| 22 Mar 2017 | Survation/38 Degrees | 507 | 58% | 17% | 9% | 12% | 4% | 41% |
| 7 May 2015 | 2015 Election Result | – | 58.6% | 18.3% | 10.8% | 8.5% | 3.8% | 40.3% |
†UKIP are not fielding a candidate in Tatton.
Preferred Prime Minister polling
Some opinion pollsters have asked voters which party leader they would prefer as Prime Minister – Theresa May (Conservative Party) or Jeremy Corbyn (Labour Party). The questions differ slightly from pollster to pollster:
- Opinium, Lord Ashcroft and YouGov: "Which of the following do you think would make the best Prime Minister?"
- Kantar Public: "If you had to choose between Theresa May and Jeremy Corbyn, who do you think would make the best leader for Britain?"
- Ipsos MORI: "Who do you think would make the most capable Prime Minister, the Conservative’s [sic] Theresa May, or Labour’s Jeremy Corbyn?"
- Survation: "Which of the following party leaders do you think would make the best Prime Minister?"
- ComRes: "For each of these pairs of statements, which one comes closest to your view? - Jeremy Corbyn would make a better Prime Minister than Theresa May/Theresa May would make a better Prime Minister than Jeremy Corbyn"
- ICM: "Putting aside which party you support, and only thinking about your impression of them as leaders, which one of the following do you think would make the best Prime Minister for Britain?"
May vs Corbyn
2017
| Date(s) conducted |
Polling organisation/client | Sample size | Theresa May | Jeremy Corbyn | None of these | Not sure | Lead | |||
|---|---|---|---|---|---|---|---|---|---|---|
| 5-7 Jun | ComRes | 2,051 | 48% | 39% | N/A | 14% | 9% | |||
| 6 Jun | Survey Monkey/The Sun | 11,000 | 55% | 45% | - | - | 10% | |||
| 4–6 Jun | Opinium | 3,002 | 42% | 29% | 19% | 10% | 13% | |||
| 2–3 Jun | Survation | 1,103 | 50% | 36% | N/A | 15% | 14% | |||
| 31 May–2 Jun | ComRes | 2,038 | 49% | 34% | N/A | 17% | 15% | |||
| 30 May–1 Jun | Ipsos MORI | 1,046 | 50% | 35% | 6% | 8% | 15% | |||
| Pre-31 May | SurveyMonkey/The Sun | 19,000 | 58% | 39% | ? | ? | 19% | |||
| 30–31 May | Opinium | 2,006 | 42% | 26% | 21% | 12% | 16% | |||
| 30–31 May | YouGov/The Times | 1,875 | 43% | 30% | N/A | 27% | 13% | |||
| 25–30 May | Kantar Public | 1,199 | 38% | 23% | 23% | 15% | 15% | |||
| 26–27 May | Survation/Good Morning Britain | 1,009 | 53% | 30% | N/A | 17% | 23% | |||
| 24–26 May | ICM/The Sun on Sunday | 2,044 | 48% | 27% | N/A | 25% | 21% | |||
| 24–26 May | ComRes | 2,024 | 51% | 30% | N/A | 19% | 21% | |||
| 24–25 May | SurveyMonkey/The Sun | ~6,000 | 59% | 37% | ? | ? | 22% | |||
| 24–25 May | YouGov/The Times | 2,052 | 45% | 28% | N/A | 27% | 17% | |||
| 23–24 May | Opinium | 2,002 | 43% | 26% | 21% | 11% | 17% | |||
| 18–22 May | Kantar Public | 1,200 | 38% | 24% | 23% | 14% | 14% | |||
| 16–17 May | YouGov/The Times | 1,861 | 46% | 23% | N/A | 31% | 23% | |||
| 16–17 May | Opinium | 2,003 | 45% | 22% | 21% | 12% | 23% | |||
| 15–17 May | Ipsos MORI | 1,053 | 56% | 29% | 8% | 6% | 27% | |||
| 11–15 May | Kantar Public | 1,201 | 41% | 18% | 22% | 19% | 23% | |||
| 12–13 May | Survation | 1,016 | 58% | 24% | N/A | 19% | 34% | |||
| 9–12 May | Opinium | 2,003 | 45% | 19% | 24% | 12% | 26% | |||
| 9-10 May | YouGov/The Times | 1,651 | 49% | 21% | N/A | 30% | 28% | |||
| 4–8 May | Kantar Public | 1,201 | 40% | 17% | 24% | 19% | 23% | |||
| 5–6 May | Survation | 1,005 | 60% | 21% | N/A | 19% | 39% | |||
| 2-3 May | Opinium | 2,005 | 46% | 18% | 25% | 11% | 28% | |||
| 2-3 May | YouGov/The Times | 2,066 | 49% | 21% | N/A | 29% | 28% | |||
| 20–24 Apr | Kantar Public | 2,003 | 43% | 17% | 20% | 20% | 26% | |||
| 25–28 Apr | Opinium/The Observer | 2,007 | 44% | 19% | 25% | 12% | 25% | |||
| 25–26 Apr | YouGov/The Times | 1,590 | 48% | 18% | N/A | 33% | 30% | |||
| 21–25 Apr | Ipsos MORI[25] | 1,004 | 61% | 23% | 6% | 7%[26] | 38% | |||
| 20–24 Apr | Kantar Public[27] | 2,003 | 44% | 18% | 23% | 16% | 26% | |||
| 19–20 Apr | Opinium/Observer | 2,003 | 49% | 14% | 26% | 11% | 35% | |||
| 18–19 Apr | YouGov/The Times | 1,727 | 54% | 15% | N/A | 31% | 39% | |||
| 18 Apr | Prime Minister Theresa May announces her intention to seek a general election | |||||||||
| 12–13 Apr | YouGov/The Times | 2,069 | 50% | 14% | N/A | 36% | 36% | |||
| 11–13 Apr | Opinium/Observer | 1,651 | 47% | 14% | 28% | 11% | 33% | |||
| 5–6 Apr | YouGov/The Times | 1,651 | 49% | 16% | N/A | 35% | 33% | |||
| 21–28 Mar | Lord Ashcroft Polls | 10,153 | 55% | 18% | N/A | 27% | 37% | |||
| 26–27 Mar | YouGov/The Times | 1,957 | 51% | 13% | N/A | 36% | 38% | |||
| 20–21 Mar | YouGov/The Times | 1,627 | 47% | 14% | N/A | 39% | 33% | |||
| 14–17 Mar | Opinium/Observer | 2,007 | 45% | 14% | 29% | 12% | 31% | |||
| 13–14 Mar | YouGov/The Times | 1,631 | 48% | 14% | N/A | 38% | 34% | |||
| 27–28 Feb | YouGov/The Times | 1,666 | 49% | 15% | N/A | 36% | 34% | |||
| 21–22 Feb | YouGov/The Times | 2,060 | 49% | 15% | N/A | 36% | 34% | |||
| 14–16 Feb | Opinium/Observer | 2,004 | 46% | 13% | 29% | 12% | 33% | |||
| 12–13 Feb | YouGov/The Times | 2,052 | 49% | 15% | N/A | 36% | 34% | |||
| 31 Jan–1 Feb | Opinium/Observer | 2,005 | 43% | 14% | 29% | 14% | 29% | |||
| 30–31 Jan | YouGov/The Times | 1,705 | 48% | 16% | N/A | 36% | 32% | |||
| 23–24 Jan | YouGov/The Times | 1,643 | 47% | 15% | N/A | 38% | 32% | |||
| 10–12 Jan | Opinium/Observer | 2,007 | 40% | 16% | 28% | 15% | 24% | |||
| 9–10 Jan | YouGov/The Times | 1,660 | 45% | 17% | N/A | 38% | 28% | |||
| 3–4 Jan | YouGov/The Times | 1,740 | 47% | 14% | N/A | 39% | 33% | |||
2016
| Date(s) conducted |
Polling organisation/client | Sample size | Theresa May | Jeremy Corbyn | None of these | Not sure | Lead | |||
|---|---|---|---|---|---|---|---|---|---|---|
| 18–19 Dec | YouGov/The Times | 1,595 | 44% | 16% | N/A | 41% | 28% | |||
| 13–16 Dec | Opinium/The Observer | 2,000 | 42% | 16% | 28% | 13% | 26% | |||
| 4–5 Dec | YouGov/The Times | 1,667 | 49% | 16% | N/A | 35% | 33% | |||
| 28–29 Nov | YouGov/The Times | 1,624 | 45% | 18% | N/A | 37% | 27% | |||
| 15–18 Nov | Opinium/The Observer | 2,005 | 45% | 17% | 25% | 13% | 28% | |||
| 14–15 Nov | YouGov/The Times | 1,717 | 48% | 18% | N/A | 34% | 30% | |||
| 1–4 Nov | Opinium/The Observer | 2,001 | 45% | 16% | 25% | 13% | 29% | |||
| 31 Oct-1 Nov | YouGov/The Times | 1,655 | 47% | 17% | N/A | 36% | 30% | |||
| 24–25 Oct | YouGov/The Times | 1,655 | 48% | 16% | N/A | 36% | 32% | |||
| 11–12 Oct | YouGov/The Times | 1,669 | 51% | 18% | N/A | 31% | 33% | |||
| 13–14 Sep | YouGov/The Times | 1,732 | 50% | 18% | N/A | 33% | 32% | |||
| 30–31 Aug | YouGov/The Times | 1,687 | 52% | 21% | N/A | 27% | 31% | |||
| 22–23 Aug | YouGov/The Times | 1,660 | 50% | 19% | N/A | 30% | 31% | |||
| 16–17 Aug | YouGov/The Times | 1,677 | 51% | 19% | N/A | 30% | 32% | |||
| 8–9 Aug | YouGov/The Times | 1,692 | 52% | 18% | N/A | 29% | 34% | |||
| 1–2 Aug | YouGov/The Times | 1,722 | 52% | 18% | N/A | 30% | 34% | |||
| 25–26 Jul | YouGov/The Times | 1,680 | 52% | 18% | N/A | 30% | 34% | |||
| 13 Jul | Theresa May becomes the Prime Minister of the United Kingdom | |||||||||
| 23 Jun | The UK votes to leave the EU; David Cameron announces he will resign as Prime Minister | |||||||||
| 5 May | UK elections, 2016 including the Ogmore and Sheffield Brightside & Hillsborough by-elections | |||||||||
| 11–12 Apr | YouGov/The Times | 1,693 | 23% | 30% | N/A | 46% | 7% | |||
Cameron vs Corbyn
2016
| Date(s) conducted |
Polling organisation/client | Sample size | David Cameron | Jeremy Corbyn | None of these | Not sure | Lead |
|---|---|---|---|---|---|---|---|
| 11–12 Apr | YouGov/The Times | 1,693 | 32% | 25% | N/A | 42% | 7% |
2015
| Date(s) conducted |
Polling organisation/client | Sample size | David Cameron | Jeremy Corbyn | None of these | Not sure | Lead |
|---|---|---|---|---|---|---|---|
| 18–19 Dec | YouGov/The Times | 1,595 | 49% | 23% | N/A | 29% | 28% |
| 13–16 Dec | Opinium/The Observer | 2,000 | 42% | 16% | 28% | 13% | 26% |
| 25–28 Sep | ComRes | 2,024 | 54% | 30% | N/A | 16% | 24% |
Multiple party leaders
Some polls ask voters to choose between multiple party leaders. The questions vary by pollster:
- Lord Ashcroft: "Which of the following do you think would make the best Prime Minister?"
- ComRes: "Who of the following would make the best Prime Minister after the upcoming General Election?"
- YouGov: "Which of the following do you think would make the best Prime Minister?"
2017
| Date(s) conducted |
Polling organisation/client | Sample size | Theresa May | Jeremy Corbyn | Tim Farron | Paul Nuttall | Don't Know | Lead |
|---|---|---|---|---|---|---|---|---|
| 27 April–1 May | Lord Ashcroft Polls | 40,329 | 64% | 25% | 11% | N/A | N/A | 39% |
| 27–28 Apr | YouGov/Sunday Times | 1,612 | 45% | 16% | 6% | 2% | 32% | 29% |
| 20–21 Apr | YouGov/Sunday Times | 1,590 | 46% | 12% | 6% | 1% | 35% | 34% |
| 19–20 Apr | ComRes/Sunday Mirror | 2,074 | 62% | 25% | 10% | 4% | N/A | 37% |
2016
| Date(s) conducted |
Polling organisation/client | Sample size | Theresa May | Jeremy Corbyn | Tim Farron | Lead |
|---|---|---|---|---|---|---|
| 11–22 Aug | Lord Ashcroft Polls | 8,001 | 67% | 25% | 8% | 42% |
Hypothetical polling
|
Hypothetical polling | ||||||||||||||||||||||||||||||||||||||||||||||
|---|---|---|---|---|---|---|---|---|---|---|---|---|---|---|---|---|---|---|---|---|---|---|---|---|---|---|---|---|---|---|---|---|---|---|---|---|---|---|---|---|---|---|---|---|---|---|
|
See also
Notes
- 1 2 3 4 5 6 7 8 9 10 11 12 13 14 15 16 17 18 19 20 21 22 23 24 25 26 27 28 29 30 31 32 33 34 35 36 37 38 39 40 41 42 43 44 45 46 47 48 49 50 51 52 53 54 55 56 57 58 59 60 61 62 63 64 65 Includes those expressing a voting intention for Plaid Cymru.
- 1 2 3 4 Telephone.
- 1 2 This survey included respondents from Northern Ireland.
- ↑ GB forecast only
- ↑ Electoral Calculus counts Speaker John Bercow in the Conservative total
References
- ↑ "Westminster Voting Intention". OpinionBee.uk. Retrieved 16 October 2016.
- ↑ "Results of the 2017 General Election". BBC News. BBC. Retrieved 10 June 2017.
- ↑ "Election campaigning suspended after London Bridge attack". 4 June 2017.
- ↑ "Election 2015: Results – National". BBC. Retrieved 9 May 2015.
- ↑ "Election 2015: Results – Northern Ireland". BBC. Retrieved 9 May 2015.
- ↑ Revell, Timothy (9 June 2017). "How YouGov's experimental poll correctly called the UK election". New Scientist. Retrieved 9 June 2017.
- ↑ "Results of the 2017 General Election". BBC News. BBC. Retrieved 10 June 2017.
- 1 2 Hanretty, Chris. "2017 UK Parliamentary Election Forecast". electionforecast.co.uk. Retrieved 31 May 2017.
- 1 2 "General Election Prediction". electoralcalculus.co.uk. Retrieved 31 May 2017.
- ↑ "Ashcroft Model update: absent UKIP, and Labour's enthusiasm question". lordashcroftpolls.com.
- ↑ Combined probabilistic estimate
- 1 2 "COMBINED FORECAST FOR GE2017: SECOND UPDATE". 2 June 2017.
- ↑ "CONSTITUENCY FORECASTS, June 2017, New Statesman". 31 May 2017.
- 1 2 "Voting intention and seat estimates". Retrieved 6 June 2017.
- 1 2 "The Britain Elects Nowcast". Retrieved 7 June 2017.
- ↑ "#GE17 UK General Election 2017 – 6 June projection". Scenaripolitici.com (in Italian). 2017-06-06. Retrieved 2017-06-07.
- ↑ "Forecast #GE2017 – 8th June 2017". Forecast UK. 8 June 2017.
- ↑ "Election 2017: The Ashcroft Model". Lord Ashcroft Polls. 12 May 2017. Retrieved 17 May 2017.
- ↑ "Dapresy". dashboards.lordashcroftpolls.com.
- ↑ "#GE17 UK General Election 2017 – 6 June projection". Scenaripolitici.com (in Italian). 2017-06-06. Retrieved 2017-06-07.
- ↑ "Results of the 2017 General Election". BBC. Retrieved 10 June 2017.
- ↑ "Results of the 2017 General Election". BBC. Retrieved 10 June 2017.
- ↑ including Green
- ↑ "Results of the 2017 General Election". BBC. Retrieved 10 June 2017.
- ↑ Ipsos MORI's figures for 'don't know' are significantly lower than other pollsters on this question as they only prompt for May and Corbyn, with don't know/other/none included if respondents offer it unprompted
- ↑ 1% of respondents chose 'Other' and a further 1% said 'no difference'.
- ↑ The question used by Kantar Public differs slightly in its wording from other pollsters. They ask: "If you had to choose between Theresa May and Jeremy Corbyn, who do you think would make the best leader for Britain?"