United Kingdom general election, 2017 (Wales)
|
| |||||||||||||||||||||||||||||||||||||||||
| |||||||||||||||||||||||||||||||||||||||||
All 40 Welsh seats to the House of Commons | |||||||||||||||||||||||||||||||||||||||||
|---|---|---|---|---|---|---|---|---|---|---|---|---|---|---|---|---|---|---|---|---|---|---|---|---|---|---|---|---|---|---|---|---|---|---|---|---|---|---|---|---|---|
| Turnout |
68.6% | ||||||||||||||||||||||||||||||||||||||||
| |||||||||||||||||||||||||||||||||||||||||
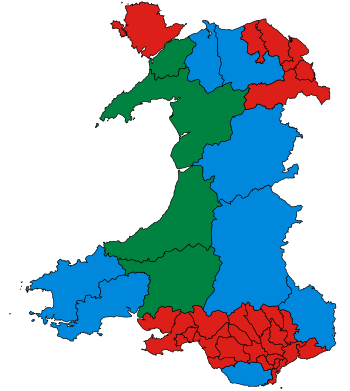 Results by constituency | |||||||||||||||||||||||||||||||||||||||||
.tif.jpg)
The 2017 United Kingdom general election in Wales was held on 8 June 2017 and all 40 seats in Wales were contested.[1] The election for each seat was conducted on the basis of first-past-the-post.
Results summary
| Party | Seats | Votes | |||||||
|---|---|---|---|---|---|---|---|---|---|
| Total | Gains | Losses | Net +/- | % seats | Total | % | Change | ||
| Labour | 28 | 3 | 0 | 70.0 | 771,354 | 48.9 | |||
| Conservative | 8 | 0 | 3 | 20.0 | 528,839 | 33.6 | |||
| Plaid Cymru | 4 | 1 | 0 | 10.0 | 164,466 | 10.4 | |||
| Liberal Democrats | 0 | 0 | 1 | — | 71,039 | 4.5 | |||
| UKIP | 0 | 0 | 0 | 0 | — | 31,376 | 2.0 | ||
| Green | 0 | 0 | 0 | 0 | — | 5,128 | 0.3 | ||
| Others | 0 | 0 | 0 | 0 | — | 3,612 | 0.2 | ||
| Total | 40 | 1,575,814 | Turnout | 68.6 | |||||
Analysis
The Labour Party remained the largest party in Wales and won an even larger majority of seats after gaining three seats from the Conservatives.
The Conservative Party, who entered the campaign with high hopes of making gains, saw their representation reduced back to the levels it won in the 2010 general election.
Plaid Cymru won back Ceredigion after 12 years in Lib Dem hands and brought its tally up to 4 seats, which was it's best result showing since 2001 and one of its joint best in history.
Plaid Cymru's gain in Ceredigion and the Liberal Democrats' failure to make gains elsewhere meant that this was the first time in Welsh electoral history where there were no Liberal or Liberal Democrat MPs elected to represent a constituency in a Westminster Parliamentary election.
Target seats
Labour
- Gower, Conservative, 0.1% (Labour Gain)
- Vale of Clwyd, Conservative, 0.7% (Labour Gain)
- Cardiff North, Conservative, 4.2% (Labour Gain)
Conservative
- Bridgend, Labour, 4.9% (Labour Hold)
- Wrexham, Labour, 5.6% (Labour Hold)
- Clwyd South, Labour, 6.9% (Labour Hold)
- Delyn, Labour, 7.8% (Labour Hold)
- Alyn and Deeside, Labour, 8.1% (Labour Hold)
- Newport West, Labour, 8.7% (Labour Hold)
Plaid Cymru
- Ynys Môn, Labour, 0.7% (Labour Hold)
- Ceredigion, Liberal Democrats, 8.2% (Plaid Gain)
Opinion polling
| Date(s) conducted |
Polling organisation/client | Sample size | Lab | Con | UKIP | Plaid | Lib Dem | Green | Others | Lead |
|---|---|---|---|---|---|---|---|---|---|---|
| 8 June | General Election results | 1,575,814 | 48.9% | 33.6% | 2.0% | 10.4% | 4.5% | 0.3% | 0.2% | 15.3% |
| 5–7 June 2017 | YouGov/ITV | 1,074 | 46% | 34% | 5% | 9% | 5% | 1% | 12% | |
| 29–31 May 2017 | YouGov/ITV | 1,014 | 46% | 35% | 5% | 8% | 5% | 0% | 0% | 11% |
| 18–21 May 2017 | YouGov/ITV | 1,025 | 44% | 34% | 5% | 9% | 6% | 1% | 1% | 10% |
| 5–7 May 2017 | YouGov/ITV | 1,018 | 35% | 41% | 4% | 11% | 7% | 1% | 1% | 6% |
| 4 May 2017 | Welsh local elections, 2017 | |||||||||
| 19–21 April 2017 | YouGov/Welsh Political Barometer | 1,029 | 30% | 40% | 6% | 13% | 8% | 2% | 1% | 10% |
| 18 Apr | Prime Minister Theresa May announces her intention to seek a general election to be held on 8 June 2017 | |||||||||
| 3–6 Jan 2017 | YouGov/Welsh Political Barometer | 1,034 | 33% | 28% | 13% | 13% | 9% | 2% | 0 | 5% |
| 18–21 Sep 2016 | YouGov/Welsh Political Barometer | 1,001 | 35% | 29% | 14% | 13% | 7% | 2% | 0 | 6% |
| 13 Jul 2016 | Theresa May becomes the Prime Minister of the United Kingdom | |||||||||
| 30 Jun–4 Jul 2016 | YouGov/Welsh Political Barometer | 1,010 | 34% | 23% | 16% | 16% | 8% | 1% | 2% | 11% |
| 5 May 2016 | Welsh Assembly election and Ogmore by-election | |||||||||
| 19–22 Apr 2016 | YouGov/Welsh Political Barometer | 1,001 | 37% | 23% | 17% | 13% | 7% | 2% | 1% | 14% |
| 7–11 Apr 2016 | YouGov/ITV Wales | 1,011 | 38% | 22% | 18% | 13% | 6% | 2% | 1% | 16% |
| 7–18 Mar 2016 | Welsh Election Study | 3,272 | 36% | 25% | 16% | 14% | 6% | N/A | 3%[lower-alpha 1] | 11% |
| 9–11 Feb 2016 | YouGov/Welsh Political Barometer | 1,024 | 37% | 27% | 18% | 13% | 4% | 1% | - | 10% |
| 30 Nov–4 Dec 2015 | YouGov/Welsh Political Barometer | 1,005 | 37% | 27% | 17% | 12% | 4% | 2% | - | 10% |
| 21–24 Sep 2015 | YouGov/Welsh Political Barometer | 1,151 | 42% | 26% | 16% | 10% | 5% | 2% | - | 16% |
| 24–26 Jun 2015 | YouGov/Welsh Political Barometer | 1,151 | 37% | 28% | 15% | 12% | 4% | 3% | 1% | 9% |
| 7 May 2015 | General Election results | 1,498,433 | 36.9% | 27.2% | 13.6% | 12.1% | 6.5% | 2.6% | 1.0% | 9.7% |
Notes
- ↑ Including the Green Party.
References
- ↑ "Election 2015 – Wales". BBC News. Retrieved 9 June 2017.
| National Assembly elections | |
|---|---|
| UK elections |
|
| Local elections | |
| Referendums | |