Map projection

A map projection is a systematic transformation of the latitudes and longitudes of locations from the surface of a sphere or an ellipsoid into locations on a plane.[1] Maps cannot be created without map projections. All map projections necessarily distort the surface in some fashion. Depending on the purpose of the map, some distortions are acceptable and others are not; therefore, different map projections exist in order to preserve some properties of the sphere-like body at the expense of other properties. There is no limit to the number of possible map projections.[2]:1
More generally, the surfaces of planetary bodies can be mapped even if they are too irregular to be modeled well with a sphere or ellipsoid; see below. Even more generally, projections are a subject of several pure mathematical fields, including differential geometry, projective geometry, and manifolds. However, "map projection" refers specifically to a cartographic projection.
Background
Maps can be more useful than globes in many situations: they are more compact and easier to store; they readily accommodate an enormous range of scales; they are viewed easily on computer displays; they can facilitate measuring properties of the region being mapped; they can show larger portions of the Earth's surface at once; and they are cheaper to produce and transport. These useful traits of maps motivate the development of map projections.
However, Carl Friedrich Gauss's Theorema Egregium proved that a sphere's surface cannot be represented on a plane without distortion. The same applies to other reference surfaces used as models for the Earth, such as oblate spheroids, ellipsoids and geoids. Since any map projection is a representation of one of those surfaces on a plane, all map projections distort. Every distinct map projection distorts in a distinct way. The study of map projections is the characterization of these distortions.
Projection is not limited to perspective projections, such as those resulting from casting a shadow on a screen, or the rectilinear image produced by a pinhole camera on a flat film plate. Rather, any mathematical function transforming coordinates from the curved surface to the plane is a projection. Few projections in actual use are perspective.
For simplicity, most of this article assumes that the surface to be mapped is that of a sphere. In reality, the Earth and other large celestial bodies are generally better modeled as oblate spheroids, whereas small objects such as asteroids often have irregular shapes. These other surfaces can be mapped as well. Therefore, more generally, a map projection is any method of "flattening" a continuous curved surface onto a plane.
Metric properties of maps
Many properties can be measured on the Earth's surface independent of its geography. Some of these properties are:
Map projections can be constructed to preserve at least one of these properties, though only in a limited way for most. Each projection preserves, compromises, or approximates basic metric properties in different ways. The purpose of the map determines which projection should form the base for the map. Because many purposes exist for maps, a diversity of projections have been created to suit those purposes.
Another consideration in the configuration of a projection is its compatibility with data sets to be used on the map. Data sets are geographic information; their collection depends on the chosen datum (model) of the Earth. Different datums assign slightly different coordinates to the same location, so in large scale maps, such as those from national mapping systems, it is important to match the datum to the projection. The slight differences in coordinate assignation between different datums is not a concern for world maps or other vast territories, where such differences get shrunk to imperceptibility.
Distortion
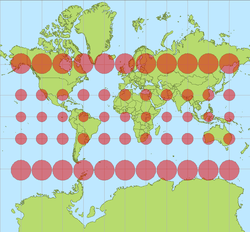
The classical way of showing the distortion inherent in a projection is to use Tissot's indicatrix. For a given point, using the scale factor h along the meridian, the scale factor k along the parallel, and the angle θ′ between them, Nicolas Tissot described how to construct an ellipse that characterizes the amount and orientation of the components of distortion.[2]:147–149[3] By spacing the ellipses regularly along the meridians and parallels, the network of indicatrices shows how distortion varies across the map.
Construction of a map projection
The creation of a map projection involves two steps:
- Selection of a model for the shape of the Earth or planetary body (usually choosing between a sphere or ellipsoid). Because the Earth's actual shape is irregular, information is lost in this step.
- Transformation of geographic coordinates (longitude and latitude) to Cartesian (x,y) or polar plane coordinates. In large-scale maps, Cartesian coordinates normally have a simple relation to eastings and northings defined as a grid superimposed on the projection. In small-scale maps, eastings and northings are not meaningful, and grids are not superimposed.
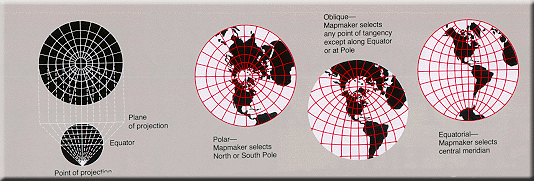
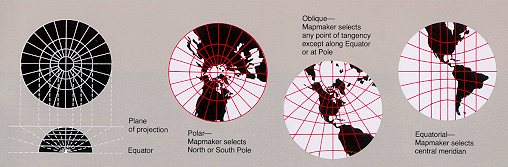
Some of the simplest map projections are literal projections, as obtained by placing a light source at some definite point relative to the globe and projecting its features onto a specified surface. This is not the case for most projections, which are defined only in terms of mathematical formulae that have no direct geometric interpretation. However, picturing the light source-globe model can be helpful in understanding the basic concept of a map projection
Choosing a projection surface
A surface that can be unfolded or unrolled into a plane or sheet without stretching, tearing or shrinking is called a developable surface. The cylinder, cone and the plane are all developable surfaces. The sphere and ellipsoid do not have developable surfaces, so any projection of them onto a plane will have to distort the image. (To compare, one cannot flatten an orange peel without tearing and warping it.)
One way of describing a projection is first to project from the Earth's surface to a developable surface such as a cylinder or cone, and then to unroll the surface into a plane. While the first step inevitably distorts some properties of the globe, the developable surface can then be unfolded without further distortion.
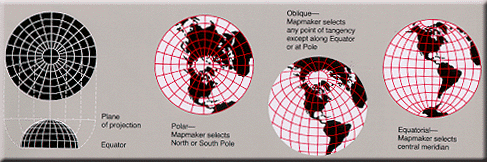
Aspect of the projection
Once a choice is made between projecting onto a cylinder, cone, or plane, the aspect of the shape must be specified. The aspect describes how the developable surface is placed relative to the globe: it may be normal (such that the surface's axis of symmetry coincides with the Earth's axis), transverse (at right angles to the Earth's axis) or oblique (any angle in between).
Notable lines
The developable surface may also be either tangent or secant to the sphere or ellipsoid. Tangent means the surface touches but does not slice through the globe; secant means the surface does slice through the globe. Moving the developable surface away from contact with the globe never preserves or optimizes metric properties, so that possibility is not discussed further here.
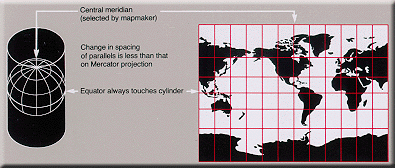
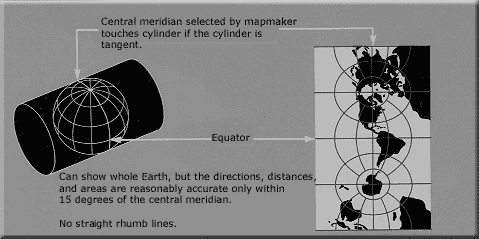
Tangent and secant lines (standard lines) are represented undistorted. If these lines are a parallel of latitude, as in conical projections, it is called a standard parallel. The central meridian is the meridian to which the globe is rotated before projecting. The central meridian (usually written λ0) and a parallel of origin (usually written φ0) are often used to define the origin of the map projection.[4][5]
Scale
A globe is the only way to represent the earth with constant scale throughout the entire map in all directions. A map cannot achieve that property for any area, no matter how small. It can, however, achieve constant scale along specific lines.
Some possible properties are:
- The scale depends on location, but not on direction. This is equivalent to preservation of angles, the defining characteristic of a conformal map.
- Scale is constant along any parallel in the direction of the parallel. This applies for any cylindrical or pseudocylindrical projection in normal aspect.
- Combination of the above: the scale depends on latitude only, not on longitude or direction. This applies for the Mercator projection in normal aspect.
- Scale is constant along all straight lines radiating from a particular geographic location. This is the defining characteristic of an equidistant projection such as the Azimuthal equidistant projection. There are also projections (Maurer's Two-point equidistant projection, Close) where true distances from two points are preserved.[2]:234
Choosing a model for the shape of the body
Projection construction is also affected by how the shape of the Earth or planetary body is approximated. In the following section on projection categories, the earth is taken as a sphere in order to simplify the discussion. However, the Earth's actual shape is closer to an oblate ellipsoid. Whether spherical or ellipsoidal, the principles discussed hold without loss of generality.
Selecting a model for a shape of the Earth involves choosing between the advantages and disadvantages of a sphere versus an ellipsoid. Spherical models are useful for small-scale maps such as world atlases and globes, since the error at that scale is not usually noticeable or important enough to justify using the more complicated ellipsoid. The ellipsoidal model is commonly used to construct topographic maps and for other large- and medium-scale maps that need to accurately depict the land surface. Auxiliary latitudes are often employed in projecting the ellipsoid.
A third model is the geoid, a more complex and accurate representation of Earth's shape coincident with what mean sea level would be if there were no winds, tides, or land. Compared to the best fitting ellipsoid, a geoidal model would change the characterization of important properties such as distance, conformality and equivalence. Therefore, in geoidal projections that preserve such properties, the mapped graticule would deviate from a mapped ellipsoid's graticule. Normally the geoid is not used as an Earth model for projections, however, because Earth's shape is very regular, with the undulation of the geoid amounting to less than 100 m from the ellipsoidal model out of the 6.3 million m Earth radius. For irregular planetary bodies such as asteroids, however, sometimes models analogous to the geoid are used to project maps from.[6][7][8][9][10]
Classification
A fundamental projection classification is based on the type of projection surface onto which the globe is conceptually projected. The projections are described in terms of placing a gigantic surface in contact with the earth, followed by an implied scaling operation. These surfaces are cylindrical (e.g. Mercator), conic (e.g. Albers), and plane (e.g. stereographic). Many mathematical projections, however, do not neatly fit into any of these three conceptual projection methods. Hence other peer categories have been described in the literature, such as pseudoconic, pseudocylindrical, pseudoazimuthal, retroazimuthal, and polyconic.
Another way to classify projections is according to properties of the model they preserve. Some of the more common categories are:
- Preserving direction (azimuthal or zenithal), a trait possible only from one or two points to every other point[11]
- Preserving shape locally (conformal or orthomorphic)
- Preserving area (equal-area or equiareal or equivalent or authalic)
- Preserving distance (equidistant), a trait possible only between one or two points and every other point
- Preserving shortest route, a trait preserved only by the gnomonic projection
Because the sphere is not a developable surface, it is impossible to construct a map projection that is both equal-area and conformal.
Projections by surface
The three developable surfaces (plane, cylinder, cone) provide useful models for understanding, describing, and developing map projections. However, these models are limited in two fundamental ways. For one thing, most world projections in use do not fall into any of those categories. For another thing, even most projections that do fall into those categories are not naturally attainable through physical projection. As L.P. Lee notes,
No reference has been made in the above definitions to cylinders, cones or planes. The projections are termed cylindric or conic because they can be regarded as developed on a cylinder or a cone, as the case may be, but it is as well to dispense with picturing cylinders and cones, since they have given rise to much misunderstanding. Particularly is this so with regard to the conic projections with two standard parallels: they may be regarded as developed on cones, but they are cones which bear no simple relationship to the sphere. In reality, cylinders and cones provide us with convenient descriptive terms, but little else.[12]
Lee's objection refers to the way the terms cylindrical, conic, and planar (azimuthal) have been abstracted in the field of map projections. If maps were projected as in light shining through a globe onto a developable surface, then the spacing of parallels would follow a very limited set of possibilities. Such a cylindrical projection (for example) is one which:
- Is rectangular;
- Has straight vertical meridians, spaced evenly;
- Has straight parallels symmetrically placed about the equator;
- Has parallels constrained to where they fall when light shines through the globe onto the cylinder, with the light source someplace along the line formed by the intersection of the prime meridian with the equator, and the center of the sphere.
(If you rotate the globe before projecting then the parallels and meridians will not necessarily still be straight lines. Rotations are normally ignored for the purpose of classification.)
Where the light source emanates along the line described in this last constraint is what yields the differences between the various "natural" cylindrical projections. But the term cylindrical as used in the field of map projections relaxes the last constraint entirely. Instead the parallels can be placed according to any algorithm the designer has decided suits the needs of the map. The famous Mercator projection is one in which the placement of parallels does not arise by "projection"; instead parallels are placed how they need to be in order to satisfy the property that a course of constant bearing is always plotted as a straight line.
Cylindrical

A "normal cylindrical projection" is any projection in which meridians are mapped to equally spaced vertical lines and circles of latitude (parallels) are mapped to horizontal lines.
The mapping of meridians to vertical lines can be visualized by imagining a cylinder whose axis coincides with the Earth's axis of rotation. This cylinder is wrapped around the Earth, projected onto, and then unrolled.
By the geometry of their construction, cylindrical projections stretch distances east-west. The amount of stretch is the same at any chosen latitude on all cylindrical projections, and is given by the secant of the latitude as a multiple of the equator's scale. The various cylindrical projections are distinguished from each other solely by their north-south stretching (where latitude is given by φ):
- North-south stretching equals east-west stretching (sec φ): The east-west scale matches the north-south scale: conformal cylindrical or Mercator; this distorts areas excessively in high latitudes (see also transverse Mercator).
- North-south stretching grows with latitude faster than east-west stretching (sec2 φ): The cylindric perspective (or central cylindrical) projection; unsuitable because distortion is even worse than in the Mercator projection.
- North-south stretching grows with latitude, but less quickly than the east-west stretching: such as the Miller cylindrical projection (sec 4/5φ).
- North-south distances neither stretched nor compressed (1): equirectangular projection or "plate carrée".
- North-south compression equals the cosine of the latitude (the reciprocal of east-west stretching): equal-area cylindrical. This projection has many named specializations differing only in the scaling constant, such as the Gall–Peters or Gall orthographic (undistorted at the 45° parallels), Behrmann (undistorted at the 30° parallels), and Lambert cylindrical equal-area (undistorted at the equator). Since this projection scales north-south distances by the reciprocal of east-west stretching, it preserves area at the expense of shapes.
In the first case (Mercator), the east-west scale always equals the north-south scale. In the second case (central cylindrical), the north-south scale exceeds the east-west scale everywhere away from the equator. Each remaining case has a pair of secant lines—a pair of identical latitudes of opposite sign (or else the equator) at which the east-west scale matches the north-south-scale.
Normal cylindrical projections map the whole Earth as a finite rectangle, except in the first two cases, where the rectangle stretches infinitely tall while retaining constant width.
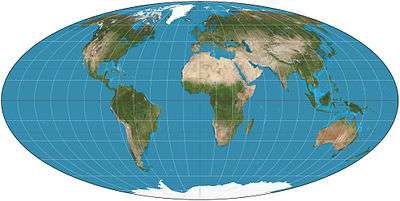
Pseudocylindrical
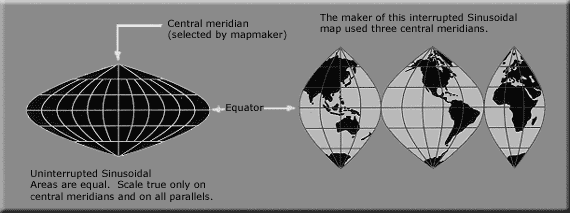
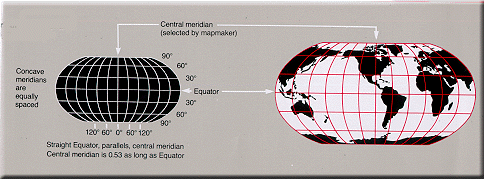
Pseudocylindrical projections represent the central meridian as a straight line segment. Other meridians are longer than the central meridian and bow outward, away from the central meridian. Pseudocylindrical projections map parallels as straight lines. Along parallels, each point from the surface is mapped at a distance from the central meridian that is proportional to its difference in longitude from the central meridian. Therefore, meridians are equally spaced along a given parallel. On a pseudocylindrical map, any point further from the equator than some other point has a higher latitude than the other point, preserving north-south relationships. This trait is useful when illustrating phenomena that depend on latitude, such as climate. Examples of pseudocylindrical projections include:
- Sinusoidal, which was the first pseudocylindrical projection developed. On the map, as in reality, the length of each parallel is proportional to the cosine of the latitude.[13] The area of any region is true.
- Collignon projection, which in its most common forms represents each meridian as two straight line segments, one from each pole to the equator.
|
|
|
|
|
|
|
|
Hybrid
The HEALPix projection combines an equal-area cylindrical projection in equatorial regions with the Collignon projection in polar areas.
Conic
The term "conic projection" is used to refer to any projection in which meridians are mapped to equally spaced lines radiating out from the apex and circles of latitude (parallels) are mapped to circular arcs centered on the apex.[14]
When making a conic map, the map maker arbitrarily picks two standard parallels. Those standard parallels may be visualized as secant lines where the cone intersects the globe—or, if the map maker chooses the same parallel twice, as the tangent line where the cone is tangent to the globe. The resulting conic map has low distortion in scale, shape, and area near those standard parallels. Distances along the parallels to the north of both standard parallels or to the south of both standard parallels are stretched; distances along parallels between the standard parallels are compressed. When a single standard parallel is used, distances along all other parallels are stretched.
Conic projections that are commonly used are:
- Equidistant conic, which keeps parallels evenly spaced along the meridians to preserve a constant distance scale along each meridian, typically the same or similar scale as along the standard parallels.
- Albers conic, which adjusts the north-south distance between non-standard parallels to compensate for the east-west stretching or compression, giving an equal-area map.
- Lambert conformal conic, which adjusts the north-south distance between non-standard parallels to equal the east-west stretching, giving a conformal map.
Pseudoconic
- Bonne, an equal-area projection on which most meridians and parallels appear as curved lines. It has a configurable standard parallel along which there is no distortion.
- Werner cordiform, upon which distances are correct from one pole, as well as along all parallels.
- American polyconic
Azimuthal (projections onto a plane)
Azimuthal projections have the property that directions from a central point are preserved and therefore great circles through the central point are represented by straight lines on the map. These projections also have radial symmetry in the scales and hence in the distortions: map distances from the central point are computed by a function r(d) of the true distance d, independent of the angle; correspondingly, circles with the central point as center are mapped into circles which have as center the central point on the map.
The mapping of radial lines can be visualized by imagining a plane tangent to the Earth, with the central point as tangent point.
The radial scale is r′(d) and the transverse scale r(d)/(R sin d/R) where R is the radius of the Earth.
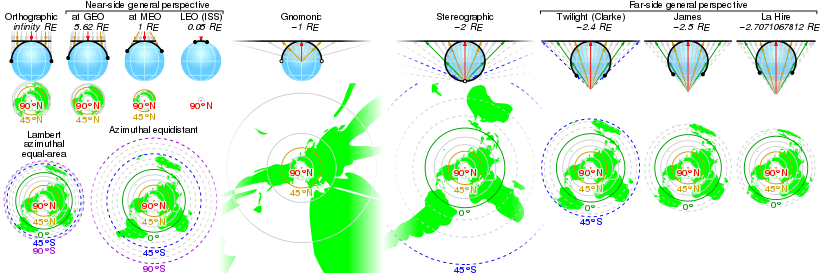
Some azimuthal projections are true perspective projections; that is, they can be constructed mechanically, projecting the surface of the Earth by extending lines from a point of perspective (along an infinite line through the tangent point and the tangent point's antipode) onto the plane:
- The gnomonic projection displays great circles as straight lines. Can be constructed by using a point of perspective at the center of the Earth. r(d) = c tan d/R; so that even just a hemisphere is already infinite in extent.[15][16]
- The General Perspective projection can be constructed by using a point of perspective outside the earth. Photographs of Earth (such as those from the International Space Station) give this perspective.
- The orthographic projection maps each point on the earth to the closest point on the plane. Can be constructed from a point of perspective an infinite distance from the tangent point; r(d) = c sin d/R.[17] Can display up to a hemisphere on a finite circle. Photographs of Earth from far enough away, such as the Moon, approximate this perspective.
- The stereographic projection, which is conformal, can be constructed by using the tangent point's antipode as the point of perspective. r(d) = c tan d/2R; the scale is c/(2R cos2 d/2R).[18] Can display nearly the entire sphere's surface on a finite circle. The sphere's full surface requires an infinite map.
Other azimuthal projections are not true perspective projections:
- Azimuthal equidistant: r(d) = cd; it is used by amateur radio operators to know the direction to point their antennas toward a point and see the distance to it. Distance from the tangent point on the map is proportional to surface distance on the earth (;[19] for the case where the tangent point is the North Pole, see the flag of the United Nations)
- Lambert azimuthal equal-area. Distance from the tangent point on the map is proportional to straight-line distance through the earth: r(d) = c sin d/2R[20]
- Logarithmic azimuthal is constructed so that each point's distance from the center of the map is the logarithm of its distance from the tangent point on the Earth. r(d) = c ln d/d0); locations closer than at a distance equal to the constant d0 are not shown.[21][22]
Projections by preservation of a metric property
Conformal
Conformal, or orthomorphic, map projections preserve angles locally, implying that they map infinitesimal circles of constant size anywhere on the Earth to infinitesimal circles of varying sizes on the map. In contrast, mappings that are not conformal distort most such small circles into ellipses of distortion. An important consequence of conformality is that relative angles at each point of the map are correct, and the local scale (although varying throughout the map) in every direction around any one point is constant. These are some conformal projections:
- Mercator: Rhumb lines are represented by straight segments
- Transverse Mercator
- Stereographic: Any circle of a sphere, great and small, maps to a circle or straight line.
- Roussilhe
- Lambert conformal conic
- Peirce quincuncial projection
- Adams hemisphere-in-a-square projection
- Guyou hemisphere-in-a-square projection
Equal-area
Equal-area maps preserve area measure, generally distorting shapes in order to do that. Equal-area maps are also called equivalent or authalic. These are some projections that preserve area:
- Albers conic
- Bonne
- Bottomley
- Collignon
- Cylindrical equal-area
- Eckert II, IV and VI
- Gall orthographic (also known as Gall–Peters, or Peters, projection)
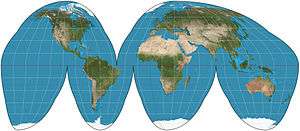
- Goode's homolosine
- Hammer
- Hobo–Dyer
- Lambert azimuthal equal-area
- Lambert cylindrical equal-area
- Mollweide
- Sinusoidal
- Strebe 1995
- Snyder’s equal-area polyhedral projection, used for geodesic grids.
- Tobler hyperelliptical
- Werner
Equidistant
These are some projections that preserve distance from some standard point or line:
- Equirectangular—distances along meridians are conserved
- Plate carrée—an Equirectangular projection centered at the equator
- Azimuthal equidistant—distances along great circles radiating from centre are conserved
- Equidistant conic
- Sinusoidal—distances along parallels are conserved
- Werner cordiform distances from the North Pole are correct as are the curved distance on parallels
- Soldner
- Two-point equidistant: two "control points" are arbitrarily chosen by the map maker. Distance from any point on the map to each control point is proportional to surface distance on the earth.
Gnomonic
Great circles are displayed as straight lines:
Retroazimuthal
Direction to a fixed location B (the bearing at the starting location A of the shortest route) corresponds to the direction on the map from A to B:
- Littrow—the only conformal retroazimuthal projection
- Hammer retroazimuthal—also preserves distance from the central point
- Craig retroazimuthal aka Mecca or Qibla—also has vertical meridians
Compromise projections
Compromise projections give up the idea of perfectly preserving metric properties, seeking instead to strike a balance between distortions, or to simply make things "look right". Most of these types of projections distort shape in the polar regions more than at the equator. These are some compromise projections:
Which projection is best?
The mathematics of projection do not permit any particular map projection to be "best" for everything. Something will always be distorted. Thus, many projections exist to serve the many uses of maps and their vast range of scales.
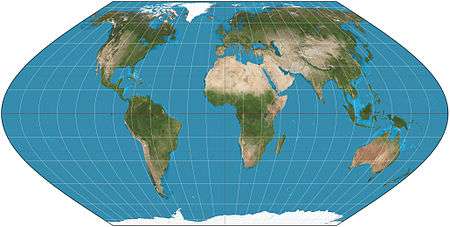
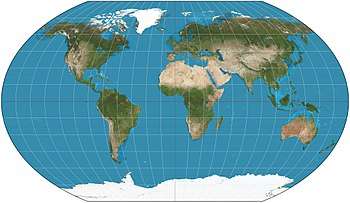
Modern national mapping systems typically employ a transverse Mercator or close variant for large-scale maps in order to preserve conformality and low variation in scale over small areas. For smaller-scale maps, such as those spanning continents or the entire world, many projections are in common use according to their fitness for the purpose, such as Winkel tripel, Robinson and Mollweide.[23] Reference maps of the world often appear on compromise projections. Due to distortions inherent in any map of the world, the choice of projection becomes largely one of aesthetics.
Thematic maps normally require an equal area projection so that phenomena per unit area are shown in correct proportion.[24] However, representing area ratios correctly necessarily distorts shapes more than many maps that are not equal-area.
The Mercator projection, developed for navigational purposes, has often been used in world maps where other projections would have been more appropriate.[25][26][27][28] This problem has long been recognized even outside professional circles. For example, a 1943 New York Times editorial states:
The time has come to discard [the Mercator] for something that represents the continents and directions less deceptively ... Although its usage ... has diminished ... it is still highly popular as a wall map apparently in part because, as a rectangular map, it fills a rectangular wall space with more map, and clearly because its familiarity breeds more popularity.[2]:166
A controversy in the 1980s over the Peters map motivated the American Cartographic Association (now Cartography and Geographic Information Society) to produce a series of booklets (including Which Map Is Best[29]) designed to educate the public about map projections and distortion in maps. In 1989 and 1990, after some internal debate, seven North American geographic organizations adopted a resolution recommending against using any rectangular projection (including Mercator and Gall–Peters) for reference maps of the world.[30][31]
See also
References
- ↑ Snyder, J.P. (1989). Album of Map Projections, United States Geological Survey Professional Paper. United States Government Printing Office. 1453.
- 1 2 3 4 Snyder, John P. (1993). Flattening the earth: two thousand years of map projections. University of Chicago Press. ISBN 0-226-76746-9.
- ↑ Snyder. Working Manual, p. 24.
- ↑ "Projection parameters".
- ↑ "Map projections".
- ↑ Cheng, Y.; Lorre, J. J. (2000). "Equal Area Map Projection for Irregularly Shaped Objects". Cartography and Geographic Information Science. 27 (2): 91. doi:10.1559/152304000783547957.
- ↑ Stooke, P. J. (1998). "Mapping Worlds with Irregular Shapes". The Canadian Geographer. 42: 61. doi:10.1111/j.1541-0064.1998.tb01553.x.
- ↑ Shingareva, K.B.; Bugaevsky, L.M.; Nyrtsov, M. (2000). "Mathematical Basis for Non-spherical Celestial Bodies Maps" (PDF). Journal of Geospatial Engineering. 2 (2): 45–50.
- ↑ Nyrtsov, M.V. (August 2003). "The Classification of Projections of Irregularly-shaped Celestial Bodies" (PDF). Proceedings of the 21st International Cartographic Conference (ICC): 1158–1164.
- ↑ Clark, P. E.; Clark, C. S. (2013). "CSNB Mapping Applied to Irregular Bodies". Constant-Scale Natural Boundary Mapping to Reveal Global and Cosmic Processes. SpringerBriefs in Astronomy. p. 71. doi:10.1007/978-1-4614-7762-4_6. ISBN 978-1-4614-7761-7.
- ↑ Snyder, John Parr (1987). Map Projections – a Working Manual. U.S. Government Printing Office. p. 192.
- ↑ Lee, L.P. (1944). "The nomenclature and classification of map projections". Empire Survey Review. VII (51): 190–200. doi:10.1179/sre.1944.7.51.190. p. 193
- ↑ Weisstein, Eric W. "Sinusoidal Projection". MathWorld.
- ↑ Carlos A. Furuti. "Conic Projections"
- ↑ Weisstein, Eric W. "Gnomonic Projection". MathWorld.
- ↑ "The Gnomonic Projection". Retrieved November 18, 2005.
- ↑ Weisstein, Eric W. "Orthographic Projection". MathWorld.
- ↑ Weisstein, Eric W. "Stereographic Projection". MathWorld.
- ↑ Weisstein, Eric W. "Azimuthal Equidistant Projection". MathWorld.
- ↑ Weisstein, Eric W. "Lambert Azimuthal Equal-Area Projection". MathWorld.
- ↑ Snyder, John P. "Enlarging the Heart of a Map". Archived from the original on July 2, 2010. Retrieved April 14, 2016.
- ↑ Snyder, John P. "Enlarging the Heart of a Map (accompanying figures)". Archived from the original on April 10, 2011. Retrieved November 18, 2005. (see figure 6-5)
- ↑ Choosing a World Map. Falls Church, Virginia: American Congress on Surveying and Mapping. 1988. p. 1. ISBN 0-9613459-2-6.
- ↑ Slocum, Terry A.; Robert B. McMaster; Fritz C. Kessler; Hugh H. Howard (2005). Thematic Cartography and Geographic Visualization (2nd ed.). Upper Saddle River, NJ: Pearson Prentice Hall. p. 166. ISBN 0-13-035123-7.
- ↑ Bauer, H.A. (1942). "Globes, Maps, and Skyways (Air Education Series)". New York. p. 28
- ↑ Miller, Osborn Maitland (1942). "Notes on Cylindrical World Map Projections". Geographical Review. 32 (3): 424–430. doi:10.2307/210384.
- ↑ Raisz, Erwin Josephus. (1938). General Cartography. New York: McGraw–Hill. 2d ed., 1948. p. 87.
- ↑ Robinson, Arthur Howard. (1960). Elements of Cartography, second edition. New York: John Wiley and Sons. p. 82.
- ↑ American Cartographic Association's Committee on Map Projections, 1986. Which Map is Best p. 12. Falls Church: American Congress on Surveying and Mapping.
- ↑ Robinson, Arthur (1990). "Rectangular World Maps—No!". Professional Geographer. 42 (1): 101–104. doi:10.1111/j.0033-0124.1990.00101.x.
- ↑ "Geographers and Cartographers Urge End to Popular Use of Rectangular Maps". American Cartographer. 16: 222–223. 1989. doi:10.1559/152304089783814089.
Notes
- Fran Evanisko, American River College, lectures for Geography 20: "Cartographic Design for GIS", Fall 2002
- Map Projections—PDF versions of numerous projections, created and released into the Public Domain by Paul B. Anderson ... member of the International Cartographic Association's Commission on Map Projections
External links
- "An Album of Map Projections" (PDF). (12.6 MB), U.S. Geological Survey Professional Paper 1453, by John P. Snyder (USGS) and Philip M. Voxland (U. Minnesota), 1989.
- Cartography at Curlie (based on DMOZ)
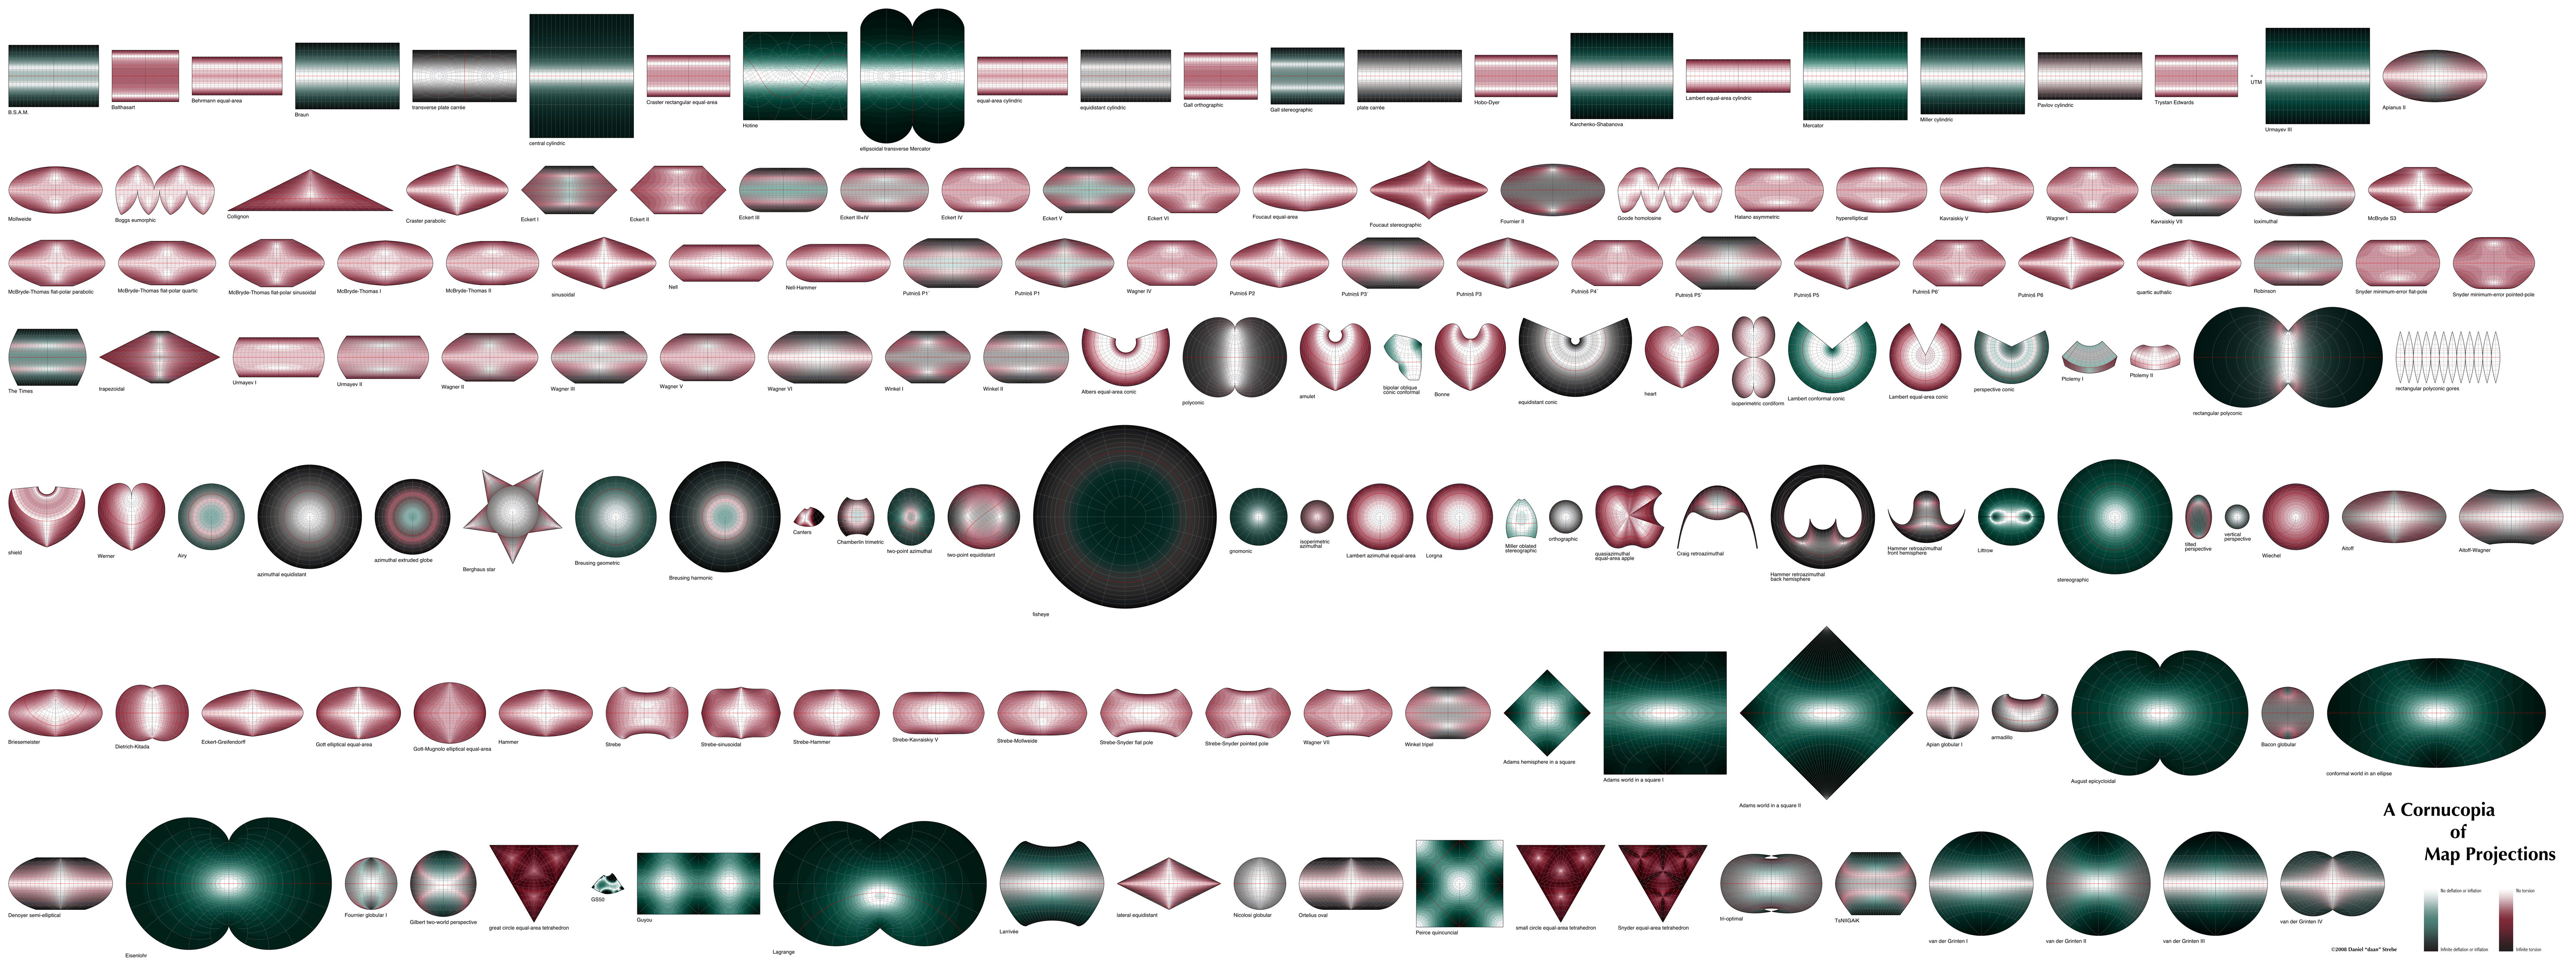
- A Cornucopia of Map Projections, a visualization of distortion on a vast array of map projections in a single image.
- G.Projector, free software can render many projections (NASA GISS).
- Color images of map projections and distortion (Mapthematics.com).
- Geometric aspects of mapping: map projection (KartoWeb.itc.nl).
- Java world map projections, Henry Bottomley (SE16.info).
- Map projections http://www.3dsoftware.com/Cartography/USGS/MapProjections/ at the Wayback Machine (archived January 4, 2007) (3DSoftware).
- Map projections, John Savard.
- Map Projections (MathWorld).
- Map Projections An interactive JAVA applet to study deformations (area, distance and angle) of map projections (UFF.br).
- Map Projections: How Projections Work (Progonos.com).
- Map Projections Poster (U.S. Geographical Survey).
- MapRef: The Internet Collection of MapProjections and Reference Systems in Europe
- PROJ.4 – Cartographic Projections Library.
- Projection Reference Table of examples and properties of all common projections (RadicalCartography.net).
- "Understanding Map Projections" (PDF). (1.70 MB), Melita Kennedy (ESRI).
- World Map Projections, Stephen Wolfram based on work by Yu-Sung Chang (Wolfram Demonstrations Project).
- Compare Map Projections
- Hazewinkel, Michiel, ed. (2001) [1994], "Cartographic projection", Encyclopedia of Mathematics, Springer Science+Business Media B.V. / Kluwer Academic Publishers, ISBN 978-1-55608-010-4