Lévis—Lotbinière
 Lotbinière—Chutes-de-la-Chaudière (2003 boundaries) | |||
| Federal electoral district | |||
| Legislature | House of Commons | ||
| MP |
Conservative | ||
| District created | 2003 | ||
| First contested | 2004 | ||
| Last contested | 2015 | ||
| District webpage | profile, map | ||
| Demographics | |||
| Population (2011)[1] | 107,593 | ||
| Electors (2015) | 86,700 | ||
| Area (km²)[2] | 2,123 | ||
| Pop. density (per km²) | 50.7 | ||
| Census divisions | Lévis, Lotbinière, La Nouvelle-Beauce | ||
| Census subdivisions | Lévis, Laurier-Station, Saint-Agapit, Saint-Apollinaire, Sainte-Croix, Saint-Lambert-de-Lauzon | ||
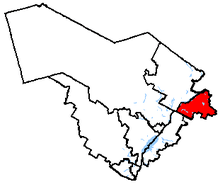
Lévis—Lotbinière (formerly Lotbinière—Chutes-de-la-Chaudière) is a federal electoral district in the province of Quebec, Canada, that has been represented in the House of Commons of Canada since 2004.
It was created in 2003 from parts of Lévis-et-Chutes-de-la-Chaudière and Lotbinière—L'Érable ridings.
Geography
Located southwest of Quebec City along the Saint Lawrence River, the riding includes parts of the city's south shore suburbs.
It consists of:
- the Regional County Municipality of Lotbinière;
- the part of the City of Lévis comprising: the former cities of Saint-Nicolas, Charny, Saint-Jean-Chrysostome and Saint-Rédempteur, the former Municipality of Saint-Étienne-de-Lauzon, and the former Parish Municipality of Sainte-Hélène-de-Breakeyville; and
- the Parish Municipality of Saint-Lambert-de-Lauzon in the Regional County Municipality of La Nouvelle-Beauce.
The neighbouring ridings are Lévis—Bellechasse, Beauce, Mégantic—L'Érable, Bas-Richelieu—Nicolet—Bécancour, Portneuf—Jacques-Cartier, and Louis-Hébert.
As per the 2012 federal electoral redistribution, this riding was renamed Lévis—Lotbinière, its territory will remain largely the same, but received a small portion from Mégantic—L'Érable.
Members of Parliament
This riding has elected the following Members of Parliament:
| Parliament | Years | Member | Party | |
|---|---|---|---|---|
| Lotbinière—Chutes-de-la-Chaudière Riding created from Lévis-et-Chutes-de-la-Chaudière and Lotbinière—L'Érable |
||||
| 38th | 2004–2006 | Odina Desrochers | Bloc Québécois | |
| 39th | 2006–2008 | Jacques Gourde | Conservative | |
| 40th | 2008–2011 | |||
| 41st | 2011–2015 | |||
| Lévis—Lotbinière | ||||
| 42nd | 2015–Present | Jacques Gourde | Conservative | |
Election results
Lévis—Lotbinière, 2013 Representation Order
This riding was renamed Lévis—Lotbinière, and received a small portion of territory from Mégantic—L'Érable for the 42nd Canadian federal election.
| Canadian federal election, 2015 | ||||||||
|---|---|---|---|---|---|---|---|---|
| Party | Candidate | Votes | % | ±% | Expenditures | |||
| Conservative | Jacques Gourde | 31,357 | 50.1 | +10.22 | $87,534.69 | |||
| Liberal | Claude Boucher | 13,562 | 21.67 | +16.58 | $20,248.35 | |||
| New Democratic | Hélène Bilodeau | 9,246 | 14.77 | -23.72 | $14,490.33 | |||
| Bloc Québécois | Steve Gagné | 7,163 | 11.44 | -3.44 | $17,237.82 | |||
| Green | Tina Biello | 1,124 | 1.8 | +0.14 | – | |||
| Alliance of the North | François Belanger | 136 | 0.22 | – | – | |||
| Total valid votes/Expense limit | 62,588 | 100.0 | $226,709.26 | |||||
| Total rejected ballots | 975 | – | – | |||||
| Turnout | 63,563 | – | – | |||||
| Eligible voters | 87,103 | |||||||
| Source: Elections Canada[3][4] | ||||||||
| 2011 federal election redistributed results[5] | |||
|---|---|---|---|
| Party | Vote | % | |
| Conservative | 22,469 | 39.88 | |
| New Democratic | 21,688 | 38.49 | |
| Bloc Québécois | 8,383 | 14.88 | |
| Liberal | 2,867 | 5.09 | |
| Green | 936 | 1.66 | |
Lotbinière—Chutes-de-la-Chaudière, 2003 Representation Order
| Canadian federal election, 2011 | ||||||||
|---|---|---|---|---|---|---|---|---|
| Party | Candidate | Votes | % | ±% | Expenditures | |||
| Conservative | Jacques Gourde | 22,460 | 39.88 | -7.39 | $78,886.19 | |||
| New Democratic | Tanya Fredette | 21,683 | 38.50 | +25.32 | $1,427.87 | |||
| Bloc Québécois | Gaston Gourde | 8,381 | 14.88 | -9.70 | $28,148.35 | |||
| Liberal | Nicole Larouche | 2,866 | 5.09 | -7.45 | $4,858.38 | |||
| Green | Richard Domm | 936 | 1.66 | -0.78 | none listed | |||
| Total valid votes/Expense limit | 56,326 | 100.0 | $89,473.12 | |||||
| Total rejected, unmarked and declined ballots | 926 | 1.62 | -0.10 | |||||
| Turnout | 57,252 | 69.21 | +3.06 | |||||
| Eligible voters | 82,725 | |||||||
| Conservative hold | Swing | -16.36 | ||||||
| Sources:[6][7] | ||||||||
| Canadian federal election, 2008 | ||||||||
|---|---|---|---|---|---|---|---|---|
| Party | Candidate | Votes | % | ±% | Expenditures | |||
| Conservative | Jacques Gourde | 24,495 | 47.27 | -7.07 | $72,248.18 | |||
| Bloc Québécois | Antoine Sarrazin-Bourgoin | 12,738 | 24.58 | -5.06 | $19,089.72 | |||
| New Democratic | Raymond Côté | 6,828 | 13.18 | +6.39 | $2,654.50 | |||
| Liberal | Marie-Thérèse Hovington | 6,498 | 12.54 | +7.11 | $3,272.46 | |||
| Green | Shirley Picknell | 1,265 | 2.44 | -1.37 | none listed | |||
| Total valid votes/Expense limit | 51,824 | 100.0 | $85,174 | |||||
| Total rejected, unmarked and declined ballots | 908 | 1.72 | +0.74 | |||||
| Turnout | 52,732 | 66.15 | -2.21 | |||||
| Eligible voters | 79,721 | |||||||
| Conservative hold | Swing | -1.00 | ||||||
| Canadian federal election, 2006 | ||||||||
|---|---|---|---|---|---|---|---|---|
| Party | Candidate | Votes | % | ±% | Expenditures | |||
| Conservative | Jacques Gourde | 28,236 | 54.34 | +30.20 | $45,970.43 | |||
| Bloc Québécois | Odina Desrochers | 15,402 | 29.64 | -16.35 | $61,218.95 | |||
| New Democratic | Raymond Côté | 3,529 | 6.79 | +2.50 | $2,346.22 | |||
| Liberal | Éric Paradis | 2,820 | 5.43 | -16.02 | $17,938.01 | |||
| Green | Shirley Picknell | 1,978 | 3.81 | +0.14 | none listed | |||
| Total valid votes/Expense limit | 51,965 | 100.0 | $78,226 | |||||
| Total rejected, unmarked and declined ballots | 513 | 0.98 | -1.41 | |||||
| Turnout | 52,478 | 68.36 | ||||||
| Eligible voters | 76,764 | |||||||
| Conservative gain from Bloc Québécois | Swing | +23.28 | ||||||
| Canadian federal election, 2004 | ||||||||
|---|---|---|---|---|---|---|---|---|
| Party | Candidate | Votes | % | ±% | Expenditures | |||
| Bloc Québécois | Odina Desrochers | 20,245 | 45.99 | +2.99 | $60,246.22 | |||
| Conservative | Jean Landry | 10,628 | 24.14 | +2.95 | $8,765.42 | |||
| Liberal | Anicet Gagné | 9,445 | 21.45 | -11.87 | $38,282.74 | |||
| New Democratic | Jean Bernatchez | 2,091 | 4.75 | +2.62 | $2,905.99 | |||
| Green | Rama Borne MacDonald | 1,615 | 3.67 | – | none listed | |||
| Total valid votes/Expense limit | 44,024 | 100.0 | $75,906 | |||||
| Total rejected, unmarked and declined ballots | 1,076 | 2.39 | ||||||
| Turnout | 45,100 | 60.42 | -3.64 | |||||
| Eligible voters | 74,647 | |||||||
| Bloc Québécois notional hold | Swing | +0.02 | ||||||
| Changes from 2000 are based on redistributed results. Change for the Conservative Party is based on the combined totals of the Canadian Alliance and the Progressive Conservative Party. | ||||||||
| 2000 federal election redistributed results | |||
|---|---|---|---|
| Party | Vote | % | |
| Bloc Québécois | 19,500 | 43.00 | |
| Liberal | 15,109 | 33.32 | |
| Alliance | 6,399 | 14.11 | |
| Progressive Conservative | 3,210 | 7.08 | |
| New Democratic | 966 | 2.13 | |
| Others | 161 | 0.36 | |
See also
References
- "(Code 24036) Census Profile". 2011 census. Statistics Canada. 2012. Retrieved 2011-03-07.
- Campaign expense data from Elections Canada
- 2011 Results from Elections Canada
- Riding history from the Library of Parliament
Notes
- ↑ Statistics Canada: 2011
- ↑ Statistics Canada: 2011
- ↑ Elections Canada – Confirmed candidates for Lévis—Lotbinière, 30 September 2015
- ↑ Elections Canada – Preliminary Election Expenses Limits for Candidates Archived 2016-03-04 at the Wayback Machine.
- ↑ Pundits' Guide to Canadian Elections
- ↑ Elections Canada – Official voting results, Forty-first general election, 2011
- ↑ Elections Canada – Candidate's electoral campaign return, 41st general election