List of countries by motor vehicle production
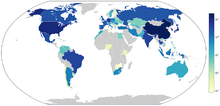
Motor vehicles produced by country in 2013.
This is a list of countries by motor vehicle production based on Organisation Internationale des Constructeurs d'Automobiles (OICA) and other data from 2016 and earlier.
Figures include passenger cars, light commercial vehicles, minibuses, trucks, buses and coaches.[1]
EX denotes that the country's motor vehicle production rank is unknown.
| # | Country | 2017[2] | 2016 [3] |
2015 [4] | 2014 [5] | 2013 [6] | 2012 [7] | 2011 [8][9] | 2010 [9][10] | 2005 [11] | 2000 [12][13] | 1995 [13][14] | 1990 [15][16] [17] | 1980 [15][16][17][18] | 1970 [15][16][17][18] | 1960 [15][16][17][18] | 1950 [15][16] | Peak production [15][16][13][19][14][17][2] | Peak year [15][16][13][19][14][17] |
|---|---|---|---|---|---|---|---|---|---|---|---|---|---|---|---|---|---|---|---|
| World | 97,302,534 | 95,057,929 | 90,780,583 | 89,747,430 | 87,507,027 | 84,141,209 | 80,092,840 | 77,629,127 | 66,482,439 | 58,374,162 | 50,046,000 | 48,553,969 | 38,564,516 | 29,419,484 | 16,488,340 | 10,577,426 | 97,302,534 | 2017 | |
| 1 | China | 29,015,434 | 28,118,794 | 24,503,326 | 23,722,890 | 22,116,825 | 19,271,808 | 18,418,876 | 18,264,761 | 5,717,619 | 2,069,069 | 1,434,772 | 509,242 | 222,288 | 87,166 | 22,574 | ? | 29,015,434 | 2017 |
| 2 | United States | 11,189,985 | 12,198,137 | 12,100,095 | 11,660,699 | 11,066,432 | 10,335,765 | 8,661,535 | 7,743,093 | 11,946,653 | 12,799,857 | 11,985,457 | 9,782,997 | 8,009,841 | 8,283,949 | 7,905,119 | 8,005,859 | 13,024,978[20] | 1999[21] |
| 3 | Japan | 9,693,746 | 9,204,590 | 9,278,321[22] | 9,774,558 | 9,630,181 | 9,943,077 | 8,398,630 | 9,628,920 | 10,799,659 | 10,140,796 | 10,195,536 | 13,486,796 | 11,042,884 | 5,289,157 | 481,551 | 31,597 | 13,486,796 | 1990 |
| 4 | Germany[23] | 5,645,581[24] | 5,746,808[24] | 6,033,164 | 5,907,548 | 5,718,222 | 5,649,260 | 6,146,948 | 5,905,985 | 5,757,710 | 5,526,615 | 4,667,364 | 4,976,552 | 3,878,553 | 3,842,247 | 2,056,149 | 306,064 | 6,213,460 | 2007 |
| 5 | India | 4,782,896[25] | 4,519,341[25] | 4,160,585[25] | 3,840,160 | 3,898,425 | 4,174,713 | 3,927,411 | 3,557,073 | 1,638,674 | 801,360 | 636,000[26] | 362,655 | 113,917 | 76,409 | 51,136 | 14,688 | 4,782,896 | 2017 |
| 6 | South Korea | 4,114,913 | 4,228,509 | 4,555,957 | 4,524,932 | 4,521,429 | 4,561,766 | 4,657,094 | 4,271,741 | 3,699,350 | 3,114,998 | 2,526,400 | 1,321,630 | 123,135 | 28,819 | 0 | 0 | 4,657,094 | 2011 |
| 7 | Mexico | 4,068,415 | 3,600,365 | 3,565,469 | 3,365,306 | 3,054,849 | 3,001,814 | 2,681,050 | 2,342,282 | 1,684,238 | 1,935,527 | 935,017 | 820,558 | 490,006 | 192,841 | 49,807 | 0 | 4,068,415 | 2017 |
| 8 | Spain | 2,848,335 | 2,885,922 | 2,733,201 | 2,402,978 | 2,163,338 | 1,979,179 | 2,373,329 | 2,387,900 | 2,752,500 | 3,032,874 | 2,333,787 | 2,053,350 | 1,181,659 | 539,132 | 58,209 | 0,253 | 3,032,874 | 2000 |
| 9 | Brazil | 2,699,672 | 2,156,356 | 2,429,463 | 3,364,890 | 3,712,380 | 3,402,508 | 3,407,861 | 3,381,728[27] | 2,530,840 | 1,681,517 | 1,629,008 | 914,466 | 1,165,174 | 416,089 | 133,041 | 0 | 3,712,380 | 2013 |
| 10 | France | 2,227,000 | 2,082,000[28] | 1,972,000[28] | 1,817,000[28] | 1,740,000[28] | 1,967,765 | 2,242,928 | 2,229,421 | 3,549,008 | 3,348,361 | 3,474,705 | 3,768,993 | 3,378,433 | 2,750,086 | 1,369,210 | 357,512 | 3,919,776[29] | 1989[30] |
| 11 | Canada | 2,199,789 | 2,370,271 | 2,283,474 | 2,393,890 | 2,379,806 | 2,463,364 | 2,135,121 | 2,068,189 | 2,687,892 | 2,961,636 | 2,407,999 | 1,947,106 | 1,369,607 | 1,159,504 | 397,739 | 387,726 | 3,058,813 | 1999 |
| 12 | Thailand | 1,988,823 | 1,944,417 | 1,915,420 | 1,880,007 | 2,457,057 | 2,429,142 | 1,457,798 | 1,644,513 | 1,122,712 | 411,721 | 533,200 | 304,843 | 73,347 | 22,055 | 0 | 0 | 2,457,057 | 2013 |
| 13 | United Kingdom | 1,749,385 | 1,816,622 | 1,682,156 | 1,598,879 | 1,597,433 | 1,576,945 | 1,463,999 | 1,393,463 | 1,803,109 | 1,813,894 | 1,765,000[31] | 1,565,957 | 1,312,914 | 2,098,498 | 1,810,700 | 783,672 | 2,332,376 | 1963 |
| 14 | Turkey | 1,695,731 | 1,485,927 | 1,358,796 | 1,170,445 | 1,125,534 | 1,072,978 | 1,189,131 | 1,094,557 | 879,452 | 430,947 | 282,000 | 209,150 | 50,881 | 25,000 | 0 | 0 | 1,695,731 | 2017 |
| 15 | Russia[32] | 1,551,293 | 1,303,989 | 1,384,399 | 1,886,646 | 2,184,266 | 2,233,103 | 1,990,155 | 1,403,244 | 1,354,504 | 1,205,581 | 994,000[33] | ? | ? | ? | ? | ? | 2,233,103 | 2012 |
| 16 | Iran | 1,515,396 | 1,164,710[34] | 982,337 | 1,090,846 | 743,647 | 1,000,089 | 1,649,311 | 1,599,454 | 1,077,190 | 277,985 | 44,665 | 161,000 | 35,000 | 1,649,311 | 2011 | |||
| 17 | Czech Republic | 1,419,993 | 1,349,896 | 1,303,603 | 1,251,220 | 1,132,931 | 1,178,995 | 1,199,845 | 1,076,384 | 602,237 | 455,492 | 216,000 | ? | ? | ? | ? | ? | 1,419,993 | 2017 |
| 18 | Indonesia | 1,216,615 | 1,177,389 | 1,098,780 | 1,298,523 | 1,206,368 | 1,052,895 | 838,388 | 702,508 | 500,710 | 379,300 | 292,710 | 103,000 | 1,298,523 | 2014 | ||||
| 19 | Italy | 1,142,210 | 1,103,516 | 1,014,223 | 697,864 | 658,206 | 671,768 | 790,348 | 838,186 | 1,038,352 | 1,738,315 | 1,667,270 | 2,120,850 | 1,610,287 | 1,854,252 | 644,633 | 127,847 | 2,220,774 | 1989 |
| 20 | Slovakia | 1,001,520 | 1,040,000 | 1,035,503 | 993,000 | 975,000 | 926,555 | 639,763 | 561,933 | 218,349 | 181,783 | 22,600 | - | - | - | - | - | 1,040,000 | 2016 |
| 21 | Poland | 689,729 | 681,837 | 660,603 | 593,904 | 590,159 | 654,756 | 838,133 | 869,474 | 613,200 | 504,972 | 381,000 | 347,975 | 417,834 | 113,087 | 37,000 | 1,000 | 950,908[35] | 2008 |
| 22 | South Africa | 589,951 | 599,004 | 615,658 | 566,083 | 545,913 | 539,424 | 532,545 | 472,049 | 525,227 | 345,297 | 334,779 | 404,766 | 297,573 | 615,658 | 2015 | |||
| 23 | Hungary | 505,400 | 472,000 | 495,370[34] | 437,599 | 222,400 | 217,840 | 202,800 | 211,461 | 152,015 | 137,398 | 53,000 | 3,000 | 505,400 | 2017 | ||||
| 24 | Argentina | 472,158[28] | 472,776[28] | 533,683[28] | 617,329 | 791,007 | 764,495 | 828,771 | 716,540 | 319,755 | 339,632 | 286,000 | 99,639 | 281,793 | 219,599 | 89,000 | 828,771 | 2011 | |
| 25 | Malaysia | 460,140 | 513,445[34] | 614,671 | 596,600 | 601,407 | 572,150 | 533,695 | 567,715 | 563,408 | 282,830 | 164,000 | 191,580 | 104,227 | 601,407 | 2013 | |||
| 26 | Belgium | 379,140 | 399,427 | 409,340 | 516,832 | 503,504 | 538,848 | 595,084 | 555,302 | 926,515 | 1,033,294 | 468,000 | 1,248,290 | 923,426 | 296,000 | 1,000[13][36] | 1,248,290 | 1990 | |
| 27 | Morocco | 376,286 | 345,106 | 288,329 | 231,986 | 167,452[34] | 108,743[34] | 59,477 | 42,066 | 33,992 | 31,314 | 376,286 | 2017 | ||||||
| 28 | Romania | 359,250 | 359,306 | 387,177 | 391,422 | 410,997 | 337,765 | 335,232 | 350,912 | 194,802 | 78,165 | 93,000 | 94,000[13][37] | 124,000 | 59,000 | 12,000 | 410,997 | 2013 | |
| 29 | Taiwan | 291,563 | 309,531 | 351,085 | 379,223 | 338,720 | 339,038 | 343,296 | 303,456 | 446,345 | 361,800 | 406,000 | 382,000[13][37] | 446,345 | 2005 | ||||
| 30 | Vietnam | 236,161[34] | 236,161 | 50,000[34] | 48,871 | 37,576[34] | 40,470[34] | 31,181 | 42,286 | 31,600[34] | 6,862[38] | 236,161 | 2017 | ||||||
| 31 | Pakistan | 230,250 | 214,650 | 229,686 | 148,746 | 134,145 | 165,700 | 162,194 | 152,970 | 153,393 | 31,500 | 230,250 | 2017 | ||||||
| 32 | Sweden | 226,000 | 205,374 | 188,987[24] | 154,173[24] | 161,080[24] | 162,814[24] | 188,969[24] | 217,084 | 339,229 | 301,343 | 490,000 | 344,000[13][37] | 317,000 | 311,000 | 129,000 | 28,000 | 494,000 | 1999 |
| 33 | Slovenia[39] | 189,852 | 133,702 | 133,092 | 118,591 | 93,734 | 130,949 | 174,119 | 205,711 | 187,247 | 98,953 | 212,749 | 2009 | ||||||
| 34 | Portugal | 175,544 | 143,096 | 156,626 | 161,509 | 154,016 | 163,561 | 192,242 | 158,723 | 226,834 | 245,784 | 57,000 | 26,000[13][37] | 91,000 | 271,030 | 1998 | |||
| 35 | Netherlands | 157,280 | 44,430[34] | 44,122[34] | 29,807[34] | 29,183 | 57,462 | 73,151[40] | 94,132 | 102,204 | 98,823 | 132,000 | 111,000[13][37] | 97,000 | 79,000 | 19,000 | 307,220 | 1999 | |
| 36 | Uzbekistan[41] | 140,247 | 88,152 | 185,400 | 245,660 | 246,641 | 164,180[34] | 179,560 | 156,880 | 94,437 | 32,273 | 246,641 | 2013 | ||||||
| 37 | Philippines | 116,686[34] | 116,686 | 112,493[34] | 106,938 | 52,260[34] | 55,360[34] | 53,921 | 65,625 | 64,492 | 38,877 | 107,000 | 213,402 | 2007 | |||||
| 38 | Austria | 99,880 | 108,000[34] | 125,500[34] | 154,340[34] | 166,428[34] | 143,060[34] | 152,505 | 104,814 | 253,279 | 141,026 | 68,000 | 20,000[13][37] | 14,000 | 7,000 | 13,000 | 274,932 | 2006 | |
| 39 | Australia | 98,632 | 161,294 | 173,009 | 180,311 | 215,926 | 209,730 | 224,193 | 243,495 | 394,713 | 347,122 | 331,000 | 284,000[13][37] | 361,000 | 475,000 | 204,000 | 58,000 | 498,000 | 1974 |
| 40 | Finland | 91,598 | 55,280[34] | 69,053[34] | 45,035[34] | 7,703 | 2,900[34] | 2,540 | 6,665 | 21,644 | 38,926 | 91,598 | 2017 | ||||||
| 41 | Serbia[42] | 79,912 | 80,320 | 83,630[34] | 103,150 | 113,878 | 11,032 | 11,023 | 18,033 | 14,179 | 12,740 | ?? | ?? | ||||||
| 42 | Colombia | 74,994 | 79,036[34] | 78,070[34] | 71,137 | 70,686[34] | 32,466 | 41,714 | 109,333 | 23,979[38] | ? | 34,850[34] | 43,000 | 109,333 | 2010 | ||||
| 43 | Algeria | 60,606 | 42,008 | 19,346 | 1,244 | 0 | ? | ? | ? | ? | ? | ? | ? | ? | ? | ? | ? | ?? | ?? |
| 44 | Egypt | 36,640 | 36,230[34] | 36,000[34] | 42,515 | 39,050[34] | 56,480[34] | 81,731 | 116,683 | 123,425 | 59,765 | 123,425 | 2005 | ||||||
| 45 | Kazakhstan[43] | 19,071 | 10,651 | 14,477 | 40,162 | 40,684 | 19,186 | 8,195 | 3,176 | ? | ? | 40,684 | 2013 | ||||||
| 46 | Belarus[44] | 13,428 | 16,864 | 15,033 | 22,990 | 22,926 | 25,425 | 24,343 | 15,249 | 26,995 | 19,324 | 40,100 | 29,800 | 18,700 | 2,400 | 40,100 | 1980 | ||
| 47 | Ukraine[45] | 9,542 | 5,264 | 8,244 | 28,751 | 50,449 | 76,281 | 104,654 | 83,133 | 215,759 | 31,255 | 206,700 | 115,700 | 7,500 | 18,300 | 423,127 | 2008 | ||
| 48 | Ecuador | 2,700[34] | 2,700[34] | 4,800[34] | 5,986 | 24,322[34] | 24,322[34] | 24,322 | 22,335 | 32,254 | 41,047 | 41,047 | 2000 | ||||||
| 49 | Tunisia | 1,940[34] | 1,940[34] | 540[34] | 540[34] | 1,860[34] | 1,860[34] | 1,860 | 0 | ? | ? | ?? | ?? | ||||||
| 50 | Venezuela | 1,774 | 2,850 | 18,300 | 19,759 | 71,753 | 104,083 | 102,409 | 104,357 | 135,425 | 21,190 | 96,400 | 153,000 | 175,458 | 2006 | ||||
| 51 | Bangladesh | 580[34] | 580[34] | 540[34] | 536 | ? | ? | ? | 0 | 0 | 0 | 0 | 0 | 0 | 0 | 0 | 0 | ?? | ?? |
| EX | Bulgaria | ? | ? | ? | ? | 2,508[34] | 2,200 | 0 | 0 | 0 | 0 | 2,200 | ? | 21,000 | 12,000 | 21,000 | 1990 | ||
| EX | North Korea | ? | ? | ? | ? | ? | ? | ? | ? | ? | ? | 3,000 | ?? | ?? | |||||
| EX | New Zealand | ? | ? | 0 | 0 | 0 | 0 | 0 | 0 | 0 | 0 | ? | ? | 90,000 | 55,178 | 32,409 | 9,731 | 123,000 | 1982 |
| EX | Ireland | ? | ? | 0 | 0 | 0 | 0 | 0 | 0 | 0 | 0 | ? | ? | 47,000 | 47,000 | 1981 | |||
| Azerbaijan[46] | 0 | 247 | 415 | 2,145 | 669[34] | ? | ? | ? | ? | ? | ? | 2,145 | 2014 | ||||||
| Zimbabwe | 0 | 0 | 0 | 0 | 829[34] | 829[34] | 829[34] | 257 | 960 | 792 | ?? | ?? | |||||||
| Kenya | 0 | 0 | 0 | 0 | 3,080[34] | 3,080[34] | 2,945 | 0 | 405 | 288 | ?? | ?? | |||||||
| Uruguay | 0 | 0 | 0 | 0 | 0 | 0 | 0 | 0 | 0 | 14,404 | ?? | ?? | |||||||
| Chile | 0 | 0 | 0 | 0 | 0 | 0 | 0 | 4,700 | 6,660[34] | 5,245[38] | 10,804 | 2007 | |||||||
| Nigeria | 0 | 0 | 0 | 0 | 0 | 0 | 0 | 0 | 2,937 | 7,834 | ?? | ?? | |||||||
| Peru | 0 | 0 | 0 | 0 | 0 | 0 | 0 | 0 | 1,566 | ? | ?? | ?? | |||||||
| Note 2. Former countries | |||||||||||||||||||
| — | Soviet Union | — | — | — | — | — | — | — | — | — | — | 2,039,600 | 2,199,200 | 916,118 | 523,591 | 362,985 | 2,247,500 | 1985 | |
| — | Yugoslavia | — | — | — | — | — | — | — | — | — | — | 239,000[13][37] | 278,000 | 124,000 | 16,000 | 1,000 | 318,300 | 1988 | |
| — | Czechoslovakia | — | — | — | — | — | — | — | — | — | — | 242,000 | 233,112 | 169,920 | 75,000 | 31,000 | 242,000 | 1990 | |
| — | East Germany | — | — | — | — | — | — | — | — | — | — | — | 216,585 | 153,378 | 77,350 | 8,243 | 264,444 | 1986 | |
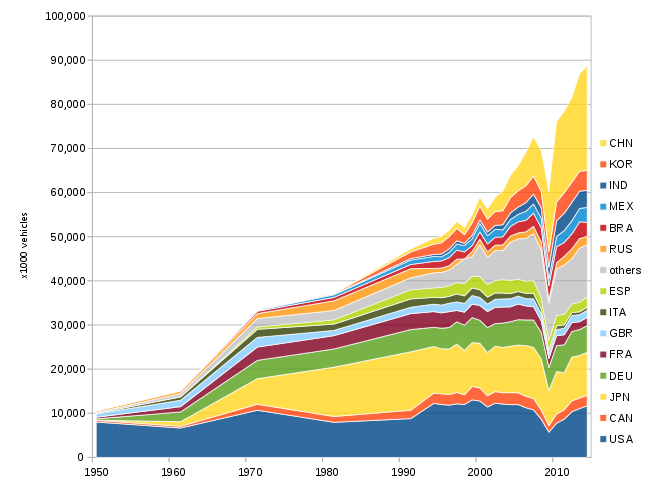
Countries by volume of production since 1950
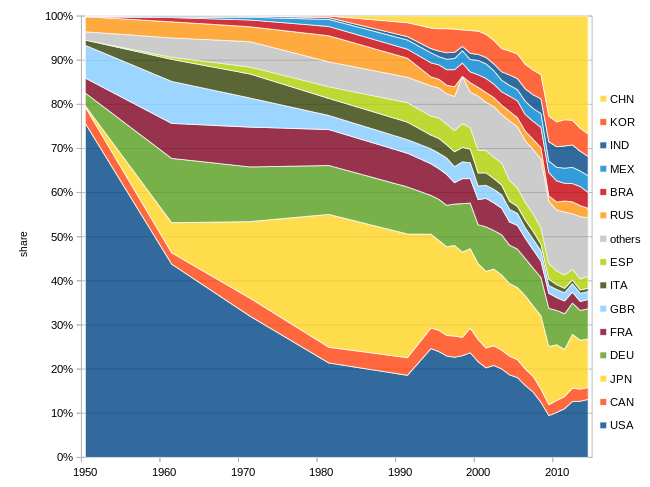
Countries by shares of production since 1950
See also
References and notes
- ↑ Statistic definitions
- 1 2 "World motor vehicle production by country and type" (PDF). OICA. Retrieved 2018-04-16.
- ↑ OICA 2016 statistic
- ↑ OICA 2015 statistic
- ↑ OICA 2014 statistic
- ↑ OICA 2013 statistic
- ↑ OICA 2012 statistic
- ↑ OICA 2011 statistic
- 1 2 OICA. World Motor Vehicle Production by country 2010-2011
- ↑ OICA 2010 statistic
- ↑ OICA 2005 statistic
- ↑ OICA 2000 statistic
- 1 2 3 4 5 6 7 8 9 10 11 12 13 RITA. Table 1-23: World Motor Vehicle Production, Selected Countries
- 1 2 3 IMF Auto Report 2000
- 1 2 3 4 5 6 7 OICA: Production Statistics
- 1 2 3 4 5 6 7 Ward's: World Motor Vehicle Data 2007. - Wards Communications, Southfield MI 2007, ISBN 0910589534
- 1 2 3 4 5 6 Michigan Statistical Abstract 1996. Table XIV-1 - University of Michigan, 1996 ISBN 0-472-08370-8
- 1 2 3 UNIVERSIDAD AUTONOMA METROPOLITANA UNIDAD El sector automotriz Mexicano ante el tratado de libre comercio de america del norte, 1994
- 1 2 Production automobile mondiale par continent et pour les principaux pays constructeurs,1898 2011.xls Production automobile mondiale par continent et pour les principaux pays constructeurs,1898-2011 (Tableau mde, contint, grds pays) Archived 2008-04-05 at the Wayback Machine.
- ↑ 15,168,000 according to other sources
- ↑ 1977 according to other sources
- ↑ "Development History Of Japanese Automobile Industry". carfromjapan.com. 2014-12-09. Retrieved 2017-11-22.
- ↑ West Germany before 1990
- 1 2 3 4 5 6 7 cars only
- 1 2 3 some manufacturers (BMW, Mercedes-Benz, Audi, Jaguar Land Rover) are not reported
- ↑ 544,989 according to other sources
- ↑ 3,648,358 according to other sources
- 1 2 3 4 5 6 7 Cars and LCV only
- ↑ 4,200,000 according to other sources
- ↑ 1979 according to other sources
- ↑ 1,907,045 according to other sources
- ↑ RSFSR before 1992
- ↑ 1,038,912 according to other sources
- 1 2 3 4 5 6 7 8 9 10 11 12 13 14 15 16 17 18 19 20 21 22 23 24 25 26 27 28 29 30 31 32 33 34 35 36 37 38 39 40 41 42 43 44 45 46 47 48 49 50 51 52 53 54 55 56 57 58 estimate
- ↑ 1,006,000 according to other sources
- ↑ 1961
- 1 2 3 4 5 6 7 8 1991
- 1 2 3 manufacturers' data
- ↑ SR Slovenia before 1993
- ↑ DAF missing
- ↑ Uzbek SSR before 1992
- ↑ SR Serbia before 1993
- ↑ Kazakh SSR before 1992
- ↑ Belorussian SSR before 1992
- ↑ Ukrainian SSR before 1992
- ↑ Azerbaijan SSR before 1992
External links
| By country |
| ||||||||||||
|---|---|---|---|---|---|---|---|---|---|---|---|---|---|
| Data | |||||||||||||
| History | |||||||||||||
| Manufacturers | |||||||||||||
| Organisations | |||||||||||||
| Related topics |
| ||||||||||||
This article is issued from
Wikipedia.
The text is licensed under Creative Commons - Attribution - Sharealike.
Additional terms may apply for the media files.