| Rank | Country/Region | 2012 salt
production
(metric tonnes) | % of world
production |
| 1 |  China China | 62,158,000 | 7001224800000000000♠22.48 % |
| 2 |  United States United States | 40,200,000 | 7001145400000000000♠14.54 % |
| 3 |  India India | 24,500,000 | 7000886000000000000♠8.86 % |
| 4 |  Germany Germany | 19,021,295 | 7000688000000000000♠6.88 % |
| 5 |  Canada Canada | 10,844,624 | 7000392000000000000♠3.92 % |
| 6 |  Australia Australia | 10,821,000 | 7000391000000000000♠3.91 % |
| 7 |  Mexico Mexico | 10,100,935 | 7000365000000000000♠3.65 % |
| 8 |  Chile Chile | 8,057,130 | 7000291000000000000♠2.91 % |
| 9 |  Netherlands Netherlands | 6,513,000 | 7000236000000000000♠2.36 % |
| 10 |  Brazil Brazil | 6,300,000 | 7000227990000099999♠2.28 % |
| 11 |  Ukraine Ukraine | 6,181,415 | 7000224000000000000♠2.24 % |
| 12 |  France France | 6,100,000 | 7000221000000000000♠2.21 % |
| 12 |  United Kingdom United Kingdom | 6,100,000 | 7000221000000000000♠2.21 % |
| 13 |  Poland Poland | 4,249,200 | 7000154000000000000♠1.54 % |
| 14 |  Spain Spain | 4,042,077 | 7000146000000000000♠1.46 % |
| 15 |  Turkey Turkey | 4,000,000 | 7000145000000000000♠1.45 % |
| 16 |  Austria Austria | 3,193,438 | 7000115000000099999♠1.15 % |
| 17 |  Egypt Egypt | 2,883,577 | 7000104000000000000♠1.04 % |
| 18 |  Italy Italy | 2,862,440 | 7000104000000000000♠1.04 % |
| 19 |  Iran Iran | 2,800,000 | 7000101000000000000♠1.01 % |
| 20 |  Pakistan Pakistan | 2,427,895 | 6999880000000000000♠0.88 % |
| 21 |  Belarus Belarus | 2,176,650 | 6999790000000000000♠0.79 % |
| 22 |  Bulgaria Bulgaria | 2,100,000 | 6999760000000000000♠0.76 % |
| 23 |  Russia Russia | 2,000,000 | 6999720000000000000♠0.72 % |
| 23 |  Saudi Arabia Saudi Arabia | 2,000,000 | 6999720000000000000♠0.72 % |
| 24 |  Argentina Argentina | 1,900,000 | 6999690009999900000♠0.69 % |
| 25 |  Romania Romania | 1,888,516 | 6999680000000000000♠0.68 % |
| 26 |  Thailand Thailand | 1,463,539 | 6999530000000000000♠0.53 % |
| 27 |  Bangladesh Bangladesh | 1,430,329 | 6999520000000000000♠0.52 % |
| 28 |  Peru Peru | 1,242,765 | 6999450000000000000♠0.45 % |
| 29 |  Vietnam Vietnam | 1,177,900 | 6999430000000000000♠0.43 % |
| 30 |  Tunisia Tunisia | 1,131,200 | 6999410009999900000♠0.41 % |
| 31 |  Bahamas Bahamas | 1,000,000 | 6999360000000000000♠0.36 % |
| 32 |  Japan Japan | 925,000 | 6999330000000000000♠0.33 % |
| 33 |  Bosnia and Herzegovina Bosnia and Herzegovina | 743,807 | 6999270000000000000♠0.27 % |
| 34 |  Namibia Namibia | 738,000 | 6999270000000000000♠0.27 % |
| 35 |  Philippines Philippines | 725,000 | 6999260000000000000♠0.26 % |
| 36 |  Morocco Morocco | 720,000 | 6999260000000000000♠0.26 % |
| 37 |  Indonesia Indonesia | 650,000 | 6999240000000000000♠0.24 % |
| 38 |  Portugal Portugal | 608,977 | 6999220000000000000♠0.22 % |
| 39 |  Denmark Denmark | 600,000 | 6999220000000000000♠0.22 % |
| 40 |  Switzerland Switzerland | 528,000 | 6999190000000000000♠0.19 % |
| 41 |  Colombia Colombia | 520,268 | 6999190000000000000♠0.19 % |
| 42 |  North Korea North Korea | 500,000 | 6999180000000000000♠0.18 % |
| 43 |  Kazakhstan Kazakhstan | 463,960 | 6999170000000000000♠0.17 % |
| 44 |  Israel Israel | 414,984 | 6999150000000000000♠0.15 % |
| 45 |  South Africa South Africa | 399,135 | 6999140000000000000♠0.14 % |
| 46 |  Botswana Botswana | 389,481 | 6999140000000000000♠0.14 % |
| 47 |  Venezuela Venezuela | 350,000 | 6999130000000000000♠0.13 % |
| 48 |  South Korea South Korea | 308,847 | 6999110000000000000♠0.11 % |
| 49 |  Cuba Cuba | 280,000 | 6999100000000000000♠0.1 % |
| 50 | 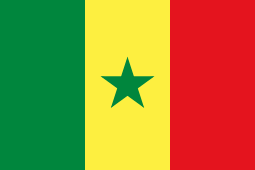 Senegal Senegal | 237,300 | 6998900000000000000♠0.09 % |
| 51 |  Myanmar Myanmar | 223,747 | 6998800000000000000♠0.08 % |
| 52 | 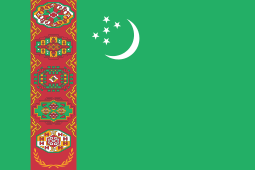 Turkmenistan Turkmenistan | 215,000 | 6998800000000000000♠0.08 % |
| 53 |  Greece Greece | 190,000 | 6998700000000000000♠0.07 % |
| 54 | 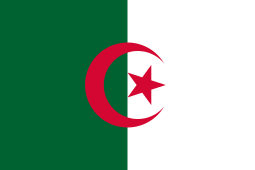 Algeria Algeria | 178,000 | 6998600000000000000♠0.06 % |
| 55 | 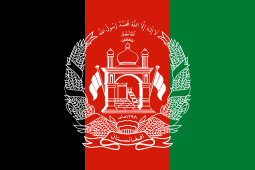 Afghanistan Afghanistan | 169,000 | 6998600000000000000♠0.06 % |
| 56 |  Ghana Ghana | 150,000 | 6998500000000000000♠0.05 % |
| 56 |  Sudan Sudan | 150,000 | 6998500000000000000♠0.05 % |
| 57 |  Iraq Iraq | 143,441 | 6998500000000000000♠0.05 % |
| 58 |  Mozambique Mozambique | 110,000 | 6998400000000000000♠0.04 % |
| 59 |  El Salvador El Salvador | 103,100 | 6998400000000000000♠0.04 % |
| 60 |  Ethiopia Ethiopia | 100,000 | 6998400000000000000♠0.04 % |
| 61 |  New Zealand New Zealand | 88,000 | 6998300000000000000♠0.03 % |
| 62 |  Sri Lanka Sri Lanka | 85,000 | 6998300000000000000♠0.03 % |
| 63 |  Albania Albania | 84,798 | 6998300000000000000♠0.03 % |
| 64 |  Cambodia Cambodia | 80,000 | 6998300000000000000♠0.03 % |
| 64 |  Syria Syria | 80,000 | 6998300000000000000♠0.03 % |
| 65 |  Ecuador Ecuador | 75,000 | 6998300000000000000♠0.03 % |
| 66 |  Taiwan Taiwan | 70,750 | 6998300000000000000♠0.03 % |
| 67 |  Madagascar Madagascar | 70,000 | 6998300000000000000♠0.03 % |
| 67 |  Yemen Yemen | 70,000 | 6998300000000000000♠0.03 % |
| 68 |  Uzbekistan Uzbekistan | 60,000 | 6998200000000000000♠0.02 % |
| 69 |  Dominican Republic Dominican Republic | 50,000 | 6998200000000000000♠0.02 % |
| 69 |  Guatemala Guatemala | 50,000 | 6998200000000000000♠0.02 % |
| 69 |  Kuwait Kuwait | 50,000 | 6998200000000000000♠0.02 % |
| 70 |  Laos Laos | 47,600 | 6998200000000000000♠0.02 % |
| 71 |  Croatia Croatia | 45,992 | 6998200000000000000♠0.02 % |
| 72 |  Angola Angola | 40,000 | 6998100000000000000♠0.01 % |
| 72 |  Honduras Honduras | 40,000 | 6998100000000000000♠0.01 % |
| 73 |  Armenia Armenia | 37,798 | 6998100000000000000♠0.01 % |
| 74 |  Tanzania Tanzania | 34,016 | 6998100000000000000♠0.01 % |
| 75 |  Djibouti Djibouti | 30,000 | 6998100000000000000♠0.01 % |
| 75 |  Nicaragua Nicaragua | 30,000 | 6998100000000000000♠0.01 % |
| 76 |  Tajikistan Tajikistan | 27,954 | 6998100000000000000♠0.01 % |
| 77 | 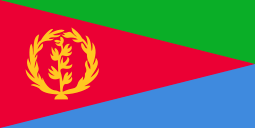 Eritrea Eritrea | 26,000 | 6998100000000000000♠0.01 % |
| 78 | 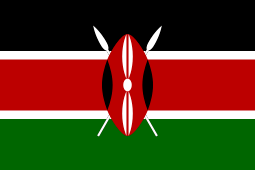 Kenya Kenya | 24,000 | 6998100000000000000♠0.01 % |
| 79 | 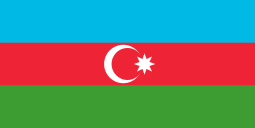 Azerbaijan Azerbaijan | 19,000 | 6998100000000000000♠0.01 % |
| 80 | 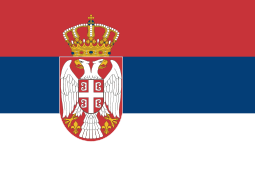 Serbia Serbia | 16,506 | 6998100000000000000♠0.01 % |
| 81 |  Montenegro Montenegro | 16,000 | 6998100000000000000♠0.01 % |
| 82 |  Panama Panama | 15,596 | 6998100000000000000♠0.01 % |
| 83 |  Guinea Guinea | 15,000 | 6998100000000000000♠0.01 % |
| 83 |  Lebanon Lebanon | 15,000 | 6998100000000000000♠0.01 % |
| 84 |  Oman Oman | 12,800 | 5000000000000000000♠0 % |
| 85 |  Libya Libya | 10,000 | 5000000000000000000♠0 % |
| 86 |  Mali Mali | 6,000 | 5000000000000000000♠0 % |
| 87 |  Slovenia Slovenia | 5,684 | 5000000000000000000♠0 % |
| 88 |  Burkina Faso Burkina Faso | 5,000 | 5000000000000000000♠0 % |
| 89 |  Mauritius Mauritius | 3,800 | 5000000000000000000♠0 % |
| 90 |  Mongolia Mongolia | 2,461 | 5000000000000000000♠0 % |
| 91 |  Niger Niger | 1,300 | 5000000000000000000♠0 % |
| 92 |  Somalia Somalia | 1,000 | 5000000000000000000♠0 % |
| 93 |  Mauritania Mauritania | 700 | 5000000000000000000♠0 % |
|
| Rank | Country/Region | 2012 salt
production
(metric tonnes) | % of world
production |
| — | World | 259,000,000 | 7002100000000000000♠100 % |
| 1 |  China China | 70,000,000 | 7001270300000000000♠27.03 % |
| — | other countries | 43,500,000 | 7001168000000000000♠16.8 % |
| 2 |  United States United States | 37,200,000 | 7001143600000000000♠14.36 % |
| 3 |  India India | 17,000,000 | 7000656000000000000♠6.56 % |
| 4 |  Germany Germany | 11,900,000 | 7000459000000000000♠4.59 % |
| 5 |  Australia Australia | 10,800,000 | 7000417000000000000♠4.17 % |
| 5 |  Canada Canada | 10,800,000 | 7000417000000000000♠4.17 % |
| 5 |  Mexico Mexico | 10,800,000 | 7000417000000000000♠4.17 % |
| 6 |  Chile Chile | 8,060,000 | 7000311000000000000♠3.11 % |
| 7 |  Brazil Brazil | 7,020,000 | 7000271000000000000♠2.71 % |
| 8 |  United Kingdom United Kingdom | 6,700,000 | 7000259000000000000♠2.59 % |
| 9 |  France France | 6,100,000 | 7000236000000000000♠2.36 % |
| 10 |  Ukraine Ukraine | 5,900,000 | 7000227990000099999♠2.28 % |
| 11 |  Turkey Turkey | 5,000,000 | 7000193000000000000♠1.93 % |
| 12 |  Spain Spain | 4,390,000 | 7000169000000000000♠1.69 % |
| 13 |  Poland Poland | 3,810,000 | 7000147000000000000♠1.47 % |
|