Greenhouse gas
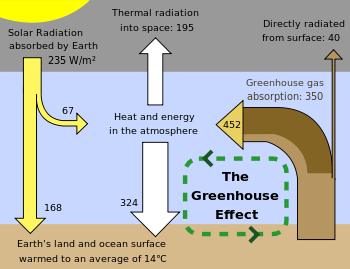
A greenhouse gas is a gas that absorbs and emits radiant energy within the thermal infrared range. Increasing greenhouse gas emissions cause the greenhouse effect.[1] The primary greenhouse gases in Earth's atmosphere are water vapor, carbon dioxide, methane, nitrous oxide and ozone. Without greenhouse gases, the average temperature of Earth's surface would be about −18 °C (0 °F),[2] rather than the present average of 15 °C (59 °F).[3][4][5] The atmospheres of Venus, Mars and Titan also contain greenhouse gases.
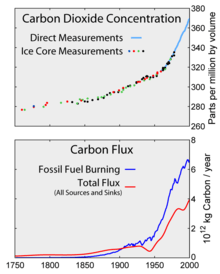
Human activities since the beginning of the Industrial Revolution (around 1750) have produced a 40% increase in the atmospheric concentration of carbon dioxide (CO2), from 280 ppm in 1750 to 406 ppm in early 2017.[6] This increase has occurred despite the uptake of more than half of the emissions by various natural "sinks" involved in the carbon cycle.[7][8] The vast majority of anthropogenic carbon dioxide emissions (i.e., emissions produced by human activities) come from combustion of fossil fuels, principally coal, oil, and natural gas, with additional contributions coming from deforestation, changes in land use, soil erosion and agriculture (including livestock).[9][10]
Should greenhouse gas emissions continue at their rate in 2017, Earth's surface temperature could exceed historical values as early as 2047, with potentially harmful effects on ecosystems, biodiversity and human livelihoods.[11] At current emission rates temperatures could increase by 2 °C, which the United Nations' IPCC designated as the upper limit to avoid "dangerous" levels, by 2036.[12]
Gases in Earth's atmosphere
Greenhouse gases
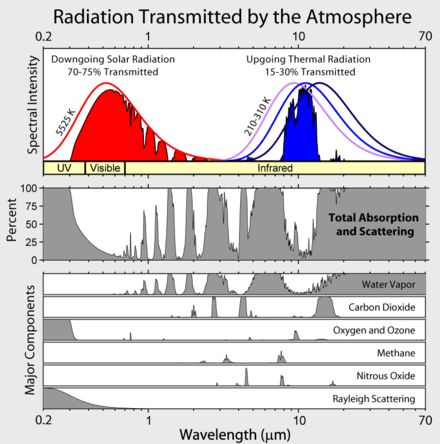
Greenhouse gases are those that absorb and emit infrared radiation in the wavelength range emitted by Earth.[1] In order, the most abundant greenhouse gases in Earth's atmosphere are:
- Water vapor (H
2O) - Carbon dioxide (CO
2) - Methane (CH
4) - Nitrous oxide (N
2O) - Ozone (O
3) - Chlorofluorocarbons (CFCs)
- Hydrofluorocarbons (incl. HCFCs and HFCs)
Atmospheric concentrations are determined by the balance between sources (emissions of the gas from human activities and natural systems) and sinks (the removal of the gas from the atmosphere by conversion to a different chemical compound or absorption by bodies of water).[13] The proportion of an emission remaining in the atmosphere after a specified time is the "airborne fraction" (AF). The annual airborne fraction is the ratio of the atmospheric increase in a given year to that year's total emissions. As of 2006 the annual airborne fraction for CO2 was about 0.45. The annual airborne fraction increased at a rate of 0.25 ± 0.21% per year over the period 1959–2006.[14]
Non-greenhouse gases
The major atmospheric constituents, nitrogen (N
2), oxygen (O
2), and argon (Ar), are not greenhouse gases because molecules containing two atoms of the same element such as N
2 and O
2 have no net change in the distribution of their electrical charges when they vibrate, and monatomic gases such as Ar do not have vibrational modes. Hence they are almost totally unaffected by infrared radiation. Some heterodiatomic molecules containing atoms of different elements such as carbon monoxide (CO) or hydrogen chloride (HCl) do absorb infrared radiation, although these molecules are short-lived in the atmosphere owing to their reactivity and solubility. Therefore, they do not contribute significantly to the greenhouse effect and often are omitted when discussing greenhouse gases.
Indirect radiative effects
Some gases have indirect radiative effects (whether or not they are greenhouse gases themselves). This happens in two main ways. One way is that when they break down in the atmosphere they produce another greenhouse gas. For example, methane and carbon monoxide (CO) are oxidized to give carbon dioxide (and methane oxidation also produces water vapor). Oxidation of CO to CO2 directly produces an unambiguous increase in radiative forcing although the reason is subtle. The peak of the thermal IR emission from Earth's surface is very close to a strong vibrational absorption band of CO2 (15 microns, or 667 cm−1). On the other hand, the single CO vibrational band only absorbs IR at much shorter wavelengths (4.7 microns, or 2145 cm−1), where the emission of radiant energy from Earth's surface is at least a factor of ten lower. Oxidation of methane to CO2, which requires reactions with the OH radical, produces an instantaneous reduction in radiative absorption and emission since CO2 is a weaker greenhouse gas than methane. However, the oxidations of CO and CH
4 are entwined since both consume OH radicals. In any case, the calculation of the total radiative effect includes both direct and indirect forcing.
A second type of indirect effect happens when chemical reactions in the atmosphere involving these gases change the concentrations of greenhouse gases. For example, the destruction of non-methane volatile organic compounds (NMVOCs) in the atmosphere can produce ozone. The size of the indirect effect can depend strongly on where and when the gas is emitted.[16]
Methane has indirect effects in addition to forming CO2. The main chemical that reacts with methane in the atmosphere is the hydroxyl radical (OH), thus more methane means that the concentration of OH goes down. Effectively, methane increases its own atmospheric lifetime and therefore its overall radiative effect. The oxidation of methane can produce both ozone and water; and is a major source of water vapor in the normally dry stratosphere. CO and NMVOCs produce CO2 when they are oxidized. They remove OH from the atmosphere, and this leads to higher concentrations of methane. The surprising effect of this is that the global warming potential of CO is three times that of CO2.[17] The same process that converts NMVOCs to carbon dioxide can also lead to the formation of tropospheric ozone. Halocarbons have an indirect effect because they destroy stratospheric ozone. Finally, hydrogen can lead to ozone production and CH
4 increases as well as producing stratospheric water vapor.[16]
Contribution of clouds to Earth's greenhouse effect
The major non-gas contributor to Earth's greenhouse effect, clouds, also absorb and emit infrared radiation and thus have an effect on greenhouse gas radiative properties. Clouds are water droplets or ice crystals suspended in the atmosphere.[18][19]
Impacts on the overall greenhouse effect
.png)
The contribution of each gas to the greenhouse effect is determined by the characteristics of that gas, its abundance, and any indirect effects it may cause. For example, the direct radiative effect of a mass of methane is about 84 times stronger than the same mass of carbon dioxide over a 20-year time frame[22] but it is present in much smaller concentrations so that its total direct radiative effect is smaller, in part due to its shorter atmospheric lifetime. On the other hand, in addition to its direct radiative impact, methane has a large, indirect radiative effect because it contributes to ozone formation. Shindell et al. (2005)[23] argue that the contribution to climate change from methane is at least double previous estimates as a result of this effect.[24]
When ranked by their direct contribution to the greenhouse effect, the most important are:[18]
| Compound |
Formula |
Concentration in atmosphere[25] (ppm) |
Contribution (%) |
|---|---|---|---|
| Water vapor and clouds | H 2O | 10–50,000(A) | 36–72% |
| Carbon dioxide | CO2 | ~400 | 9–26% |
| Methane | CH 4 | ~1.8 | 4–9% |
| Ozone | O 3 | 2–8(B) | 3–7% |
| notes: (A) Water vapor strongly varies locally[26] | |||
In addition to the main greenhouse gases listed above, other greenhouse gases include sulfur hexafluoride, hydrofluorocarbons and perfluorocarbons (see IPCC list of greenhouse gases). Some greenhouse gases are not often listed. For example, nitrogen trifluoride has a high global warming potential (GWP) but is only present in very small quantities.[27]
Proportion of direct effects at a given moment
It is not possible to state that a certain gas causes an exact percentage of the greenhouse effect. This is because some of the gases absorb and emit radiation at the same frequencies as others, so that the total greenhouse effect is not simply the sum of the influence of each gas. The higher ends of the ranges quoted are for each gas alone; the lower ends account for overlaps with the other gases.[18][19] In addition, some gases, such as methane, are known to have large indirect effects that are still being quantified.[28]
Atmospheric lifetime
Aside from water vapor, which has a residence time of about nine days,[29] major greenhouse gases are well mixed and take many years to leave the atmosphere.[30] Although it is not easy to know with precision how long it takes greenhouse gases to leave the atmosphere, there are estimates for the principal greenhouse gases. Jacob (1999)[31] defines the lifetime of an atmospheric species X in a one-box model as the average time that a molecule of X remains in the box. Mathematically can be defined as the ratio of the mass (in kg) of X in the box to its removal rate, which is the sum of the flow of X out of the box ( ), chemical loss of X ( ), and deposition of X ( ) (all in kg/s): .[31] If output of this gas into the box ceased, then after time , its concentration would decrease by about 63%.


The atmospheric lifetime of a species therefore measures the time required to restore equilibrium following a sudden increase or decrease in its concentration in the atmosphere. Individual atoms or molecules may be lost or deposited to sinks such as the soil, the oceans and other waters, or vegetation and other biological systems, reducing the excess to background concentrations. The average time taken to achieve this is the mean lifetime.
Carbon dioxide has a variable atmospheric lifetime, and cannot be specified precisely.[32] The atmospheric lifetime of CO2 is estimated of the order of 30–95 years.[33] This figure accounts for CO2 molecules being removed from the atmosphere by mixing into the ocean, photosynthesis, and other processes. However, this excludes the balancing fluxes of CO2 into the atmosphere from the geological reservoirs, which have slower characteristic rates.[34] Although more than half of the CO2 emitted is removed from the atmosphere within a century, some fraction (about 20%) of emitted CO2 remains in the atmosphere for many thousands of years.[35] [36] [37] Similar issues apply to other greenhouse gases, many of which have longer mean lifetimes than CO2, e.g. N2O has a mean atmospheric lifetime of 121 years.[22]
Radiative forcing
Earth absorbs some of the radiant energy received from the sun, reflects some of it as light and reflects or radiates the rest back to space as heat.[38] Earth's surface temperature depends on this balance between incoming and outgoing energy.[38] If this energy balance is shifted, Earth's surface becomes warmer or cooler, leading to a variety of changes in global climate.[38]
A number of natural and man-made mechanisms can affect the global energy balance and force changes in Earth's climate.[38] Greenhouse gases are one such mechanism.[38] Greenhouse gases absorb and emit some of the outgoing energy radiated from Earth's surface, causing that heat to be retained in the lower atmosphere.[38] As explained above, some greenhouse gases remain in the atmosphere for decades or even centuries, and therefore can affect Earth's energy balance over a long period.[38] Radiative forcing quantifies the effect of factors that influence Earth's energy balance, including changes in the concentrations of greenhouse gases.[38] Positive radiative forcing leads to warming by increasing the net incoming energy, whereas negative radiative forcing leads to cooling.[38]
Global warming potential
The global warming potential (GWP) depends on both the efficiency of the molecule as a greenhouse gas and its atmospheric lifetime. GWP is measured relative to the same mass of CO2 and evaluated for a specific timescale. Thus, if a gas has a high (positive) radiative forcing but also a short lifetime, it will have a large GWP on a 20-year scale but a small one on a 100-year scale. Conversely, if a molecule has a longer atmospheric lifetime than CO2 its GWP will increase when the timescale is considered. Carbon dioxide is defined to have a GWP of 1 over all time periods.
Methane has an atmospheric lifetime of 12 ± 3 years. The 2007 IPCC report lists the GWP as 72 over a time scale of 20 years, 25 over 100 years and 7.6 over 500 years.[39] A 2014 analysis, however, states that although methane's initial impact is about 100 times greater than that of CO2, because of the shorter atmospheric lifetime, after six or seven decades, the impact of the two gases is about equal, and from then on methane's relative role continues to decline.[40] The decrease in GWP at longer times is because methane is degraded to water and CO2 through chemical reactions in the atmosphere.
Examples of the atmospheric lifetime and GWP relative to CO2 for several greenhouse gases are given in the following table:
| Gas name | Chemical formula | Lifetime (years)[22] |
Global warming potential (GWP) for given time horizon | ||
|---|---|---|---|---|---|
| 20-yr[22] | 100-yr[22] | 500-yr[39] | |||
| Carbon dioxide | CO2 | 30–95 | 1 | 1 | 1 |
| Methane | CH 4 | 12 | 84 | 28 | 7.6 |
| Nitrous oxide | N 2O | 121 | 264 | 265 | 153 |
| CFC-12 | CCl 2F 2 | 100 | 10 800 | 10 200 | 5 200 |
| HCFC-22 | CHClF 2 | 12 | 5 280 | 1 760 | 549 |
| Tetrafluoromethane | CF 4 | 50 000 | 4 880 | 6 630 | 11 200 |
| Hexafluoroethane | C 2F 6 | 10 000 | 8 210 | 11 100 | 18 200 |
| Sulfur hexafluoride | SF 6 | 3 200 | 17 500 | 23 500 | 32 600 |
| Nitrogen trifluoride | NF 3 | 500 | 12 800 | 16 100 | 20 700 |
The use of CFC-12 (except some essential uses) has been phased out due to its ozone depleting properties.[41] The phasing-out of less active HCFC-compounds will be completed in 2030.[42]
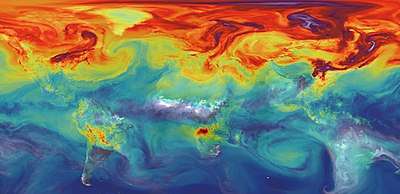
(NASA simulation; 9 November 2015)
Natural and anthropogenic sources
.png)
Aside from purely human-produced synthetic halocarbons, most greenhouse gases have both natural and human-caused sources. During the pre-industrial Holocene, concentrations of existing gases were roughly constant, because the large natural sources and sinks roughly balanced. In the industrial era, human activities have added greenhouse gases to the atmosphere, mainly through the burning of fossil fuels and clearing of forests.[47][48]
The 2007 Fourth Assessment Report compiled by the IPCC (AR4) noted that "changes in atmospheric concentrations of greenhouse gases and aerosols, land cover and solar radiation alter the energy balance of the climate system", and concluded that "increases in anthropogenic greenhouse gas concentrations is very likely to have caused most of the increases in global average temperatures since the mid-20th century".[49] In AR4, "most of" is defined as more than 50%.
Abbreviations used in the two tables below: ppm = parts-per-million; ppb = parts-per-billion; ppt = parts-per-trillion; W/m2 = watts per square metre
| Gas | Pre-1750 tropospheric concentration[51] | Recent tropospheric concentration[52] | Absolute increase since 1750 | Percentage increase since 1750 | Increased radiative forcing (W/m2)[53] |
|---|---|---|---|---|---|
| Carbon dioxide (CO2) | 280 ppm[54] | 395.4 ppm[55] | 115.4 ppm | 41.2% | 1.88 |
| Methane (CH 4) | 700 ppb[56] | 1893 ppb /[57][58] 1762 ppb[57] | 1193 ppb / 1062 ppb | 170.4% / 151.7% | 0.49 |
| Nitrous oxide (N 2O) | 270 ppb[53][59] | 326 ppb /[57] 324 ppb[57] | 56 ppb / 54 ppb | 20.7% / 20.0% | 0.17 |
| Tropospheric ozone (O 3) | 237 ppb[51] | 337 ppb[51] | 100 ppb | 42% | 0.4[60] |
| Gas | Recent tropospheric concentration | Increased radiative forcing (W/m2) |
|---|---|---|
| CFC-11 (trichlorofluoromethane) (CCl 3F) | 236 ppt / 234 ppt | 0.061 |
| CFC-12 (CCl 2F 2) | 527 ppt / 527 ppt | 0.169 |
| CFC-113 (Cl 2FC-CClF 2) | 74 ppt / 74 ppt | 0.022 |
| HCFC-22 (CHClF 2) | 231 ppt / 210 ppt | 0.046 |
| HCFC-141b (CH 3CCl 2F) | 24 ppt / 21 ppt | 0.0036 |
| HCFC-142b (CH 3CClF 2) | 23 ppt / 21 ppt | 0.0042 |
| Halon 1211 (CBrClF 2) | 4.1 ppt / 4.0 ppt | 0.0012 |
| Halon 1301 (CBrClF 3) | 3.3 ppt / 3.3 ppt | 0.001 |
| HFC-134a (CH 2FCF 3) | 75 ppt / 64 ppt | 0.0108 |
| Carbon tetrachloride (CCl 4) | 85 ppt / 83 ppt | 0.0143 |
| Sulfur hexafluoride (SF 6) | 7.79 ppt /[61] 7.39 ppt[61] | 0.0043 |
| Other halocarbons | Varies by substance | collectively 0.02 |
| Halocarbons in total | 0.3574 |
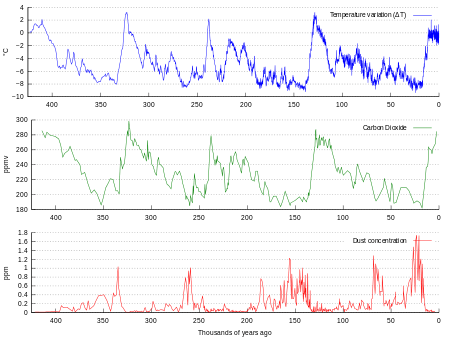
Ice cores provide evidence for greenhouse gas concentration variations over the past 800,000 years (see the following section). Both CO2 and CH
4 vary between glacial and interglacial phases, and concentrations of these gases correlate strongly with temperature. Direct data does not exist for periods earlier than those represented in the ice core record, a record that indicates CO2 mole fractions stayed within a range of 180 ppm to 280 ppm throughout the last 800,000 years, until the increase of the last 250 years. However, various proxies and modeling suggests larger variations in past epochs; 500 million years ago CO2 levels were likely 10 times higher than now.[62] Indeed, higher CO2 concentrations are thought to have prevailed throughout most of the Phanerozoic eon, with concentrations four to six times current concentrations during the Mesozoic era, and ten to fifteen times current concentrations during the early Palaeozoic era until the middle of the Devonian period, about 400 Ma.[63][64][65] The spread of land plants is thought to have reduced CO2 concentrations during the late Devonian, and plant activities as both sources and sinks of CO2 have since been important in providing stabilising feedbacks.[66]
Earlier still, a 200-million year period of intermittent, widespread glaciation extending close to the equator (Snowball Earth) appears to have been ended suddenly, about 550 Ma, by a colossal volcanic outgassing that raised the CO2 concentration of the atmosphere abruptly to 12%, about 350 times modern levels, causing extreme greenhouse conditions and carbonate deposition as limestone at the rate of about 1 mm per day.[67] This episode marked the close of the Precambrian eon, and was succeeded by the generally warmer conditions of the Phanerozoic, during which multicellular animal and plant life evolved. No volcanic carbon dioxide emission of comparable scale has occurred since. In the modern era, emissions to the atmosphere from volcanoes are approximately 0.645 billion tons of CO2 per year, whereas humans contribute 29 billion tons of CO2 each year.[68][67][69][70]
Ice cores
Measurements from Antarctic ice cores show that before industrial emissions started atmospheric CO2 mole fractions were about 280 parts per million (ppm), and stayed between 260 and 280 during the preceding ten thousand years.[71] Carbon dioxide mole fractions in the atmosphere have gone up by approximately 35 percent since the 1900s, rising from 280 parts per million by volume to 387 parts per million in 2009. One study using evidence from stomata of fossilized leaves suggests greater variability, with carbon dioxide mole fractions above 300 ppm during the period seven to ten thousand years ago,[72] though others have argued that these findings more likely reflect calibration or contamination problems rather than actual CO2 variability.[73][74] Because of the way air is trapped in ice (pores in the ice close off slowly to form bubbles deep within the firn) and the time period represented in each ice sample analyzed, these figures represent averages of atmospheric concentrations of up to a few centuries rather than annual or decadal levels.
Changes since the Industrial Revolution
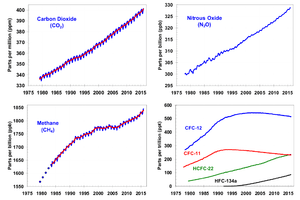
Since the beginning of the Industrial Revolution, the concentrations of most of the greenhouse gases have increased. For example, the mole fraction of carbon dioxide has increased from 280 ppm to 400 ppm, or 120 ppm over modern pre-industrial levels. The first 30 ppm increase took place in about 200 years, from the start of the Industrial Revolution to 1958; however the next 90 ppm increase took place within 56 years, from 1958 to 2014.[75][76]
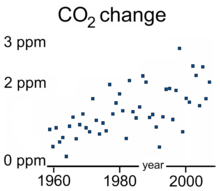
Recent data also shows that the concentration is increasing at a higher rate. In the 1960s, the average annual increase was only 37% of what it was in 2000 through 2007.[77]
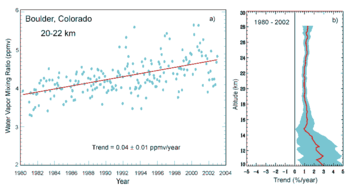
Today, the stock of carbon in the atmosphere increases by more than 3 million tonnes per annum (0.04%) compared with the existing stock. This increase is the result of human activities by burning fossil fuels, deforestation and forest degradation in tropical and boreal regions.[78]
The other greenhouse gases produced from human activity show similar increases in both amount and rate of increase. Many observations are available online in a variety of Atmospheric Chemistry Observational Databases.
Anthropogenic greenhouse gases
.png)
Since about 1750 human activity has increased the concentration of carbon dioxide and other greenhouse gases. Measured atmospheric concentrations of carbon dioxide are currently 100 ppm higher than pre-industrial levels.[81] Natural sources of carbon dioxide are more than 20 times greater than sources due to human activity,[82] but over periods longer than a few years natural sources are closely balanced by natural sinks, mainly photosynthesis of carbon compounds by plants and marine plankton. As a result of this balance, the atmospheric mole fraction of carbon dioxide remained between 260 and 280 parts per million for the 10,000 years between the end of the last glacial maximum and the start of the industrial era.[83]
It is likely that anthropogenic (i.e., human-induced) warming, such as that due to elevated greenhouse gas levels, has had a discernible influence on many physical and biological systems.[84] Future warming is projected to have a range of impacts, including sea level rise,[85] increased frequencies and severities of some extreme weather events,[85] loss of biodiversity,[86] and regional changes in agricultural productivity.[86]
The main sources of greenhouse gases due to human activity are:
- burning of fossil fuels and deforestation leading to higher carbon dioxide concentrations in the air. Land use change (mainly deforestation in the tropics) account for up to one third of total anthropogenic CO2 emissions.[83]
- livestock enteric fermentation and manure management,[87] paddy rice farming, land use and wetland changes, man-made lakes,[88] pipeline losses, and covered vented landfill emissions leading to higher methane atmospheric concentrations. Many of the newer style fully vented septic systems that enhance and target the fermentation process also are sources of atmospheric methane.
- use of chlorofluorocarbons (CFCs) in refrigeration systems, and use of CFCs and halons in fire suppression systems and manufacturing processes.
- agricultural activities, including the use of fertilizers, that lead to higher nitrous oxide (N
2O) concentrations.
The seven sources of CO2 from fossil fuel combustion are (with percentage contributions for 2000–2004):[89]
| Seven main fossil fuel combustion sources | Contribution (%) |
|---|---|
| Liquid fuels (e.g., gasoline, fuel oil) | 36% |
| Solid fuels (e.g., coal) | 35% |
| Gaseous fuels (e.g., natural gas) | 20% |
| Cement production | 3 % |
| Flaring gas industrially and at wells | < 1% |
| Non-fuel hydrocarbons | < 1% |
| "International bunker fuels" of transport not included in national inventories[90] | 4 % |
Carbon dioxide, methane, nitrous oxide (N
2O) and three groups of fluorinated gases (sulfur hexafluoride (SF
6), hydrofluorocarbons (HFCs), and perfluorocarbons (PFCs)) are the major anthropogenic greenhouse gases,[91]:147[92] and are regulated under the Kyoto Protocol international treaty, which came into force in 2005.[93] Emissions limitations specified in the Kyoto Protocol expired in 2012.[93] The Cancún agreement, agreed on in 2010, includes voluntary pledges made by 76 countries to control emissions.[94] At the time of the agreement, these 76 countries were collectively responsible for 85% of annual global emissions.[94]
Although CFCs are greenhouse gases, they are regulated by the Montreal Protocol, which was motivated by CFCs' contribution to ozone depletion rather than by their contribution to global warming. Note that ozone depletion has only a minor role in greenhouse warming, though the two processes often are confused in the media. On 15 October 2016, negotiators from over 170 nations meeting at the summit of the United Nations Environment Programme reached a legally binding accord to phase out hydrofluorocarbons (HFCs) in an amendment to the Montreal Protocol.[95][96][97]
Sectors
Tourism
According to UNEP global tourism is closely linked to climate change. Tourism is a significant contributor to the increasing concentrations of greenhouse gases in the atmosphere. Tourism accounts for about 50% of traffic movements. Rapidly expanding air traffic contributes about 2.5% of the production of CO2. The number of international travelers is expected to increase from 594 million in 1996 to 1.6 billion by 2020, adding greatly to the problem unless steps are taken to reduce emissions.[98]
Trucking and haulage
The trucking and haulage industry plays a part in production of CO2, contributing around 20% of the UK's total carbon emissions a year, with only the energy industry having a larger impact at around 39%.[99] Average carbon emissions within the haulage industry are falling—in the thirty-year period from 1977 to 2007, the carbon emissions associated with a 200-mile journey fell by 21 percent; NOx emissions are also down 87 percent, whereas journey times have fallen by around a third.[100] Due to their size, HGVs often receive criticism regarding their CO2 emissions; however, rapid development in engine technology and fuel management is having a largely positive effect.
Plastic
Plastic is produced mainly from Fossil fuels. Plastic manufacturing is estimated to use 8 percent of yearly global oil production. The EPA estimates as many as five ounces of carbon dioxide are emitted for each ounce of polyethylene (PET) produced—the type of plastic most commonly used for beverage bottles,[101] the transportation produce greenhouse gases also.[102] Plastic waste emits carbon dioxide when it degrades. In 2018 research claimed that some of the most common plastics in the environment release the greenhouse gasses Methane and Ethylene when exposed to sunlight in an amount that can affect the earth climate.[103][104]
From the other side, if it is placed in a landfill, it becomes a carbon sink[105] although biodegradable plastics have caused methane emissions. [106] Due to the lightness of plastic versus glass or metal, plastic may reduce energy consumption. For example, packaging beverages in PET plastic rather than glass or metal is estimated to save 52% in transportation energy, if the glass or metal packag is single use, of course .[107]
Role of water vapor
Water vapor accounts for the largest percentage of the greenhouse effect, between 36% and 66% for clear sky conditions and between 66% and 85% when including clouds.[19] Water vapor concentrations fluctuate regionally, but human activity does not directly affect water vapor concentrations except at local scales, such as near irrigated fields. Indirectly, human activity that increases global temperatures will increase water vapor concentrations, a process known as water vapor feedback.[108] The atmospheric concentration of vapor is highly variable and depends largely on temperature, from less than 0.01% in extremely cold regions up to 3% by mass in saturated air at about 32 °C.[109] (See Relative humidity#other important facts.)
The average residence time of a water molecule in the atmosphere is only about nine days, compared to years or centuries for other greenhouse gases such as CH
4 and CO2.[110] Thus, water vapor responds to and amplifies effects of the other greenhouse gases. The Clausius–Clapeyron relation establishes that more water vapor will be present per unit volume at elevated temperatures. This and other basic principles indicate that warming associated with increased concentrations of the other greenhouse gases also will increase the concentration of water vapor (assuming that the relative humidity remains approximately constant; modeling and observational studies find that this is indeed so). Because water vapor is a greenhouse gas, this results in further warming and so is a "positive feedback" that amplifies the original warming. Eventually other earth processes offset these positive feedbacks, stabilizing the global temperature at a new equilibrium and preventing the loss of Earth's water through a Venus-like runaway greenhouse effect.[111]
Direct greenhouse gas emissions
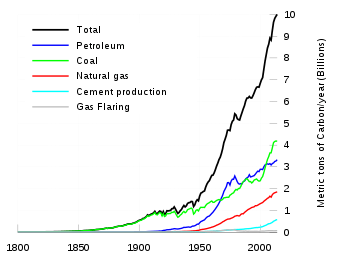
Between the period 1970 to 2004, greenhouse gas emissions (measured in CO2-equivalent)[112] increased at an average rate of 1.6% per year, with CO2 emissions from the use of fossil fuels growing at a rate of 1.9% per year.[113][114] Total anthropogenic emissions at the end of 2009 were estimated at 49.5 gigatonnes CO2-equivalent.[115]:15 These emissions include CO2 from fossil fuel use and from land use, as well as emissions of methane, nitrous oxide and other greenhouse gases covered by the Kyoto Protocol.
At present, the primary source of CO2 emissions is the burning of coal, natural gas, and petroleum for electricity and heat.[116]
Regional and national attribution of emissions
According to the Environmental Protection Agency (EPA), GHG emissions in the United States can be traced from different sectors.[117]
There are several different ways of measuring greenhouse gas emissions, for example, see World Bank (2010)[118]:362 for tables of national emissions data. Some variables that have been reported[119] include:
- Definition of measurement boundaries: Emissions can be attributed geographically, to the area where they were emitted (the territory principle) or by the activity principle to the territory produced the emissions. These two principles result in different totals when measuring, for example, electricity importation from one country to another, or emissions at an international airport.
- Time horizon of different gases: Contribution of a given greenhouse gas is reported as a CO2 equivalent. The calculation to determine this takes into account how long that gas remains in the atmosphere. This is not always known accurately and calculations must be regularly updated to reflect new information.
- What sectors are included in the calculation (e.g., energy industries, industrial processes, agriculture etc.): There is often a conflict between transparency and availability of data.
- The measurement protocol itself: This may be via direct measurement or estimation. The four main methods are the emission factor-based method, mass balance method, predictive emissions monitoring systems, and continuous emissions monitoring systems. These methods differ in accuracy, cost, and usability.
These different measures are sometimes used by different countries to assert various policy/ethical positions on climate change (Banuri et al., 1996, p. 94).[120] The use of different measures leads to a lack of comparability, which is problematic when monitoring progress towards targets. There are arguments for the adoption of a common measurement tool, or at least the development of communication between different tools.[119]
Emissions may be measured over long time periods. This measurement type is called historical or cumulative emissions. Cumulative emissions give some indication of who is responsible for the build-up in the atmospheric concentration of greenhouse gases (IEA, 2007, p. 199).[121]
The national accounts balance would be positively related to carbon emissions. The national accounts balance shows the difference between exports and imports. For many richer nations, such as the United States, the accounts balance is negative because more goods are imported than they are exported. This is mostly due to the fact that it is cheaper to produce goods outside of developed countries, leading the economies of developed countries to become increasingly dependent on services and not goods. We believed that a positive accounts balance would means that more production was occurring in a country, so more factories working would increase carbon emission levels.[122]
Emissions may also be measured across shorter time periods. Emissions changes may, for example, be measured against a base year of 1990. 1990 was used in the United Nations Framework Convention on Climate Change (UNFCCC) as the base year for emissions, and is also used in the Kyoto Protocol (some gases are also measured from the year 1995).[91]:146, 149 A country's emissions may also be reported as a proportion of global emissions for a particular year.
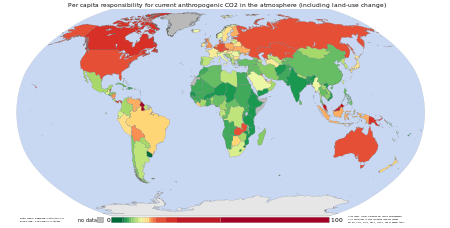
Another measurement is of per capita emissions. This divides a country's total annual emissions by its mid-year population.[118]:370 Per capita emissions may be based on historical or annual emissions (Banuri et al., 1996, pp. 106–07).[120]
While cities are sometimes considered to be disproportionate contributors to emissions, per-capita emissions tend to be lower for cities than the averages in their countries.[123]
From land-use change
Land-use change, e.g., the clearing of forests for agricultural use, can affect the concentration of greenhouse gases in the atmosphere by altering how much carbon flows out of the atmosphere into carbon sinks.[124] Accounting for land-use change can be understood as an attempt to measure "net" emissions, i.e., gross emissions from all sources minus the removal of emissions from the atmosphere by carbon sinks (Banuri et al., 1996, pp. 92–93).[120]
There are substantial uncertainties in the measurement of net carbon emissions.[125] Additionally, there is controversy over how carbon sinks should be allocated between different regions and over time (Banuri et al., 1996, p. 93).[120] For instance, concentrating on more recent changes in carbon sinks is likely to favour those regions that have deforested earlier, e.g., Europe.
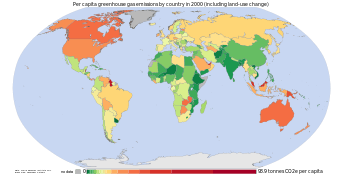
Greenhouse gas intensity
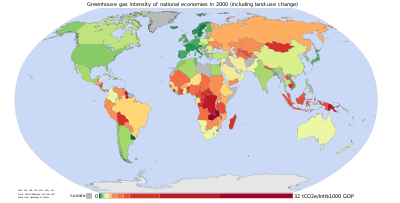 Greenhouse gas intensity in the year 2000, including land-use change. |
_for_different_regions%2C_1982-2011.png) Carbon intensity of GDP (using PPP) for different regions, 1982–2011. |
_for_different_regions%2C_1982-2011_(corrected).png) Carbon intensity of GDP (using MER) for different regions, 1982–2011. |
Greenhouse gas intensity is a ratio between greenhouse gas emissions and another metric, e.g., gross domestic product (GDP) or energy use. The terms "carbon intensity" and "emissions intensity" are also sometimes used.[126] Emission intensities may be calculated using market exchange rates (MER) or purchasing power parity (PPP) (Banuri et al., 1996, p. 96).[120] Calculations based on MER show large differences in intensities between developed and developing countries, whereas calculations based on PPP show smaller differences.
Cumulative and historical emissions
Cumulative anthropogenic (i.e., human-emitted) emissions of CO2 from fossil fuel use are a major cause of global warming,[127] and give some indication of which countries have contributed most to human-induced climate change.[128]:15
| Region | Industrial CO2 |
Total CO2 |
|---|---|---|
| OECD North America | 33.2 | 29.7 |
| OECD Europe | 26.1 | 16.6 |
| Former USSR | 14.1 | 12.5 |
| China | 5.5 | 6.0 |
| Eastern Europe | 5.5 | 4.8 |
The table above to the left is based on Banuri et al. (1996, p. 94).[120] Overall, developed countries accounted for 83.8% of industrial CO2 emissions over this time period, and 67.8% of total CO2 emissions. Developing countries accounted for industrial CO2 emissions of 16.2% over this time period, and 32.2% of total CO2 emissions. The estimate of total CO2 emissions includes biotic carbon emissions, mainly from deforestation. Banuri et al. (1996, p. 94)[120] calculated per capita cumulative emissions based on then-current population. The ratio in per capita emissions between industrialized countries and developing countries was estimated at more than 10 to 1.
Including biotic emissions brings about the same controversy mentioned earlier regarding carbon sinks and land-use change (Banuri et al., 1996, pp. 93–94).[120] The actual calculation of net emissions is very complex, and is affected by how carbon sinks are allocated between regions and the dynamics of the climate system.
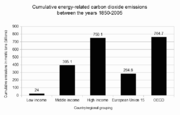
Non-OECD countries accounted for 42% of cumulative energy-related CO2 emissions between 1890 and 2007.[129]:179–80 Over this time period, the US accounted for 28% of emissions; the EU, 23%; Russia, 11%; China, 9%; other OECD countries, 5%; Japan, 4%; India, 3%; and the rest of the world, 18%.[129]:179–80
Changes since a particular base year
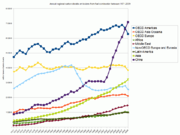
Between 1970 and 2004, global growth in annual CO2 emissions was driven by North America, Asia, and the Middle East.[130] The sharp acceleration in CO2 emissions since 2000 to more than a 3% increase per year (more than 2 ppm per year) from 1.1% per year during the 1990s is attributable to the lapse of formerly declining trends in carbon intensity of both developing and developed nations. China was responsible for most of global growth in emissions during this period. Localised plummeting emissions associated with the collapse of the Soviet Union have been followed by slow emissions growth in this region due to more efficient energy use, made necessary by the increasing proportion of it that is exported.[89] In comparison, methane has not increased appreciably, and N
2O by 0.25% y−1.
Using different base years for measuring emissions has an effect on estimates of national contributions to global warming.[128]:17–18[131] This can be calculated by dividing a country's highest contribution to global warming starting from a particular base year, by that country's minimum contribution to global warming starting from a particular base year. Choosing between different base years of 1750, 1900, 1950, and 1990 has a significant effect for most countries.[128]:17–18 Within the G8 group of countries, it is most significant for the UK, France and Germany. These countries have a long history of CO2 emissions (see the section on Cumulative and historical emissions).
Annual emissions
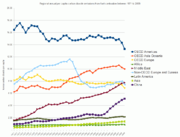
Annual per capita emissions in the industrialized countries are typically as much as ten times the average in developing countries.[91]:144 Due to China's fast economic development, its annual per capita emissions are quickly approaching the levels of those in the Annex I group of the Kyoto Protocol (i.e., the developed countries excluding the US).[132] Other countries with fast growing emissions are South Korea, Iran, and Australia (which apart from the oil rich Persian Gulf states, now has the highest percapita emission rate in the world). On the other hand, annual per capita emissions of the EU-15 and the US are gradually decreasing over time.[132] Emissions in Russia and Ukraine have decreased fastest since 1990 due to economic restructuring in these countries.[133]
Energy statistics for fast growing economies are less accurate than those for the industrialized countries. For China's annual emissions in 2008, the Netherlands Environmental Assessment Agency estimated an uncertainty range of about 10%.[132]
The greenhouse gas footprint refers to the emissions resulting from the creation of products or services. It is more comprehensive than the commonly used carbon footprint, which measures only carbon dioxide, one of many greenhouse gases.
2015 was the first year to see both total global economic growth and a reduction of carbon emissions.[134]
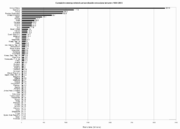
Top emitter countries
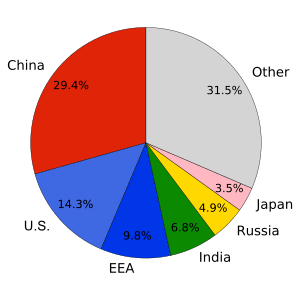
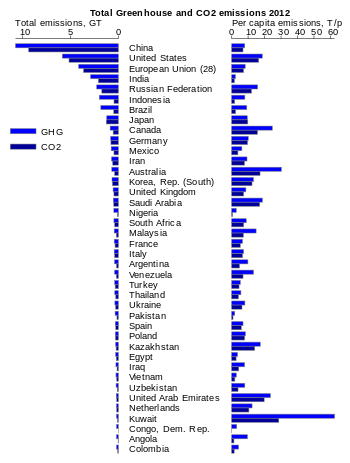
Annual
In 2009, the annual top ten emitting countries accounted for about two-thirds of the world's annual energy-related CO2 emissions.[135]
| Country | % of global total annual emissions |
Tonnes of GHG per capita |
|---|---|---|
| 23.6 | 5.1 | |
| 17.9 | 16.9 | |
| 5.5 | 1.4 | |
| 5.3 | 10.8 | |
| 3.8 | 8.6 | |
| 2.6 | 9.2 | |
| 1.8 | 7.3 | |
| 1.8 | 15.4 | |
| 1.8 | 10.6 | |
| 1.6 | 7.5 |
Cumulative
| Country | % of world total |
Metric tonnes CO2 per person |
|---|---|---|
| 28.5 | 1,132.7 | |
| 9.36 | 85.4 | |
| 7.95 | 677.2 | |
| 6.78 | 998.9 | |
| 5.73 | 1,127.8 | |
| 3.88 | 367 | |
| 2.73 | 514.9 | |
| 2.52 | 26.7 | |
| 2.17 | 789.2 | |
| 2.13 | 556.4 |
Embedded emissions
One way of attributing greenhouse gas (GHG) emissions is to measure the embedded emissions (also referred to as "embodied emissions") of goods that are being consumed. Emissions are usually measured according to production, rather than consumption.[136] For example, in the main international treaty on climate change (the UNFCCC), countries report on emissions produced within their borders, e.g., the emissions produced from burning fossil fuels.[129]:179[137]:1 Under a production-based accounting of emissions, embedded emissions on imported goods are attributed to the exporting, rather than the importing, country. Under a consumption-based accounting of emissions, embedded emissions on imported goods are attributed to the importing country, rather than the exporting, country.
Davis and Caldeira (2010)[137]:4 found that a substantial proportion of CO2 emissions are traded internationally. The net effect of trade was to export emissions from China and other emerging markets to consumers in the US, Japan, and Western Europe. Based on annual emissions data from the year 2004, and on a per-capita consumption basis, the top-5 emitting countries were found to be (in tCO2 per person, per year): Luxembourg (34.7), the US (22.0), Singapore (20.2), Australia (16.7), and Canada (16.6).[137]:5 Carbon Trust research revealed that approximately 25% of all CO2 emissions from human activities 'flow' (i.e., are imported or exported) from one country to another. Major developed economies were found to be typically net importers of embodied carbon emissions—with UK consumption emissions 34% higher than production emissions, and Germany (29%), Japan (19%) and the US (13%) also significant net importers of embodied emissions.[138]
Effect of policy
Governments have taken action to reduce greenhouse gas emissions (climate change mitigation). Assessments of policy effectiveness have included work by the Intergovernmental Panel on Climate Change,[139] International Energy Agency,[140][141] and United Nations Environment Programme.[142] Policies implemented by governments have included[143][144][145] national and regional targets to reduce emissions, promoting energy efficiency, and support for renewable energy such as Solar energy as an effective use of renewable energy because solar uses energy from the sun and does not release pollutants into the air.
Countries and regions listed in Annex I of the United Nations Framework Convention on Climate Change (UNFCCC) (i.e., the OECD and former planned economies of the Soviet Union) are required to submit periodic assessments to the UNFCCC of actions they are taking to address climate change.[145]:3 Analysis by the UNFCCC (2011)[145]:8 suggested that policies and measures undertaken by Annex I Parties may have produced emission savings of 1.5 thousand Tg CO2-eq in the year 2010, with most savings made in the energy sector. The projected emissions saving of 1.5 thousand Tg CO2-eq is measured against a hypothetical "baseline" of Annex I emissions, i.e., projected Annex I emissions in the absence of policies and measures. The total projected Annex I saving of 1.5 thousand CO2-eq does not include emissions savings in seven of the Annex I Parties.[145]:8
Projections
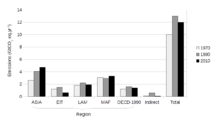
A wide range of projections of future emissions have been produced.[146] Rogner et al. (2007)[147] assessed the scientific literature on greenhouse gas projections. Rogner et al. (2007)[113] concluded that unless energy policies changed substantially, the world would continue to depend on fossil fuels until 2025–2030. Projections suggest that more than 80% of the world's energy will come from fossil fuels. This conclusion was based on "much evidence" and "high agreement" in the literature.[113] Projected annual energy-related CO2 emissions in 2030 were 40–110% higher than in 2000, with two-thirds of the increase originating in developing countries.[113] Projected annual per capita emissions in developed country regions remained substantially lower (2.8–5.1 tonnes CO2) than those in developed country regions (9.6–15.1 tonnes CO2).[148] Projections consistently showed increase in annual world emissions of "Kyoto" gases,[149] measured in CO2-equivalent) of 25–90% by 2030, compared to 2000.[113]
Relative CO2 emission from various fuels
One liter of gasoline, when used as a fuel, produces 2.32 kg (about 1300 liters or 1.3 cubic meters) of carbon dioxide, a greenhouse gas. One US gallon produces 19.4 lb (1,291.5 gallons or 172.65 cubic feet)[150][151][152]
| Fuel name | CO2 emitted (lbs/106 Btu) |
CO2 emitted (g/MJ) |
CO2 emitted (g/kWh) |
|---|---|---|---|
| Natural gas | 117 | 50.30 | 181.08 |
| Liquefied petroleum gas | 139 | 59.76 | 215.14 |
| Propane | 139 | 59.76 | 215.14 |
| Aviation gasoline | 153 | 65.78 | 236.81 |
| Automobile gasoline | 156 | 67.07 | 241.45 |
| Kerosene | 159 | 68.36 | 246.10 |
| Fuel oil | 161 | 69.22 | 249.19 |
| Tires/tire derived fuel | 189 | 81.26 | 292.54 |
| Wood and wood waste | 195 | 83.83 | 301.79 |
| Coal (bituminous) | 205 | 88.13 | 317.27 |
| Coal (sub-bituminous) | 213 | 91.57 | 329.65 |
| Coal (lignite) | 215 | 92.43 | 332.75 |
| Petroleum coke | 225 | 96.73 | 348.23 |
| Tar-sand Bitumen | |||
| Coal (anthracite) | 227 | 97.59 | 351.32 |
Life-cycle greenhouse-gas emissions of energy sources
A literature review of numerous energy sources CO2 emissions by the IPCC in 2011, found that, the CO2 emission value that fell within the 50th percentile of all total life cycle emissions studies conducted was as follows.[154]
| Technology | Description | 50th percentile (g CO2/kWhe) |
|---|---|---|
| Hydroelectric | reservoir | 4 |
| Ocean Energy | wave and tidal | 8 |
| Wind | onshore | 12 |
| Nuclear | various generation II reactor types | 16 |
| Biomass | various | 18 |
| Solar thermal | parabolic trough | 22 |
| Geothermal | hot dry rock | 45 |
| Solar PV | Polycrystalline silicon | 46 |
| Natural gas | various combined cycle turbines without scrubbing | 469 |
| Coal | various generator types without scrubbing | 1001 |
Removal from the atmosphere ("sinks")
Natural processes
Greenhouse gases can be removed from the atmosphere by various processes, as a consequence of:
- a physical change (condensation and precipitation remove water vapor from the atmosphere).
- a chemical reaction within the atmosphere. For example, methane is oxidized by reaction with naturally occurring hydroxyl radical, OH· and degraded to CO2 and water vapor (CO2 from the oxidation of methane is not included in the methane Global warming potential). Other chemical reactions include solution and solid phase chemistry occurring in atmospheric aerosols.
- a physical exchange between the atmosphere and the other compartments of the planet. An example is the mixing of atmospheric gases into the oceans.
- a chemical change at the interface between the atmosphere and the other compartments of the planet. This is the case for CO2, which is reduced by photosynthesis of plants, and which, after dissolving in the oceans, reacts to form carbonic acid and bicarbonate and carbonate ions (see ocean acidification).
- a photochemical change. Halocarbons are dissociated by UV light releasing Cl· and F· as free radicals in the stratosphere with harmful effects on ozone (halocarbons are generally too stable to disappear by chemical reaction in the atmosphere).
Negative emissions
A number of technologies remove greenhouse gases emissions from the atmosphere. Most widely analysed are those that remove carbon dioxide from the atmosphere, either to geologic formations such as bio-energy with carbon capture and storage[155][156][157] and carbon dioxide air capture,[157] or to the soil as in the case with biochar.[157] The IPCC has pointed out that many long-term climate scenario models require large-scale manmade negative emissions to avoid serious climate change.[158]
History of scientific research
In the late 19th century scientists experimentally discovered that N
2 and O
2 do not absorb infrared radiation (called, at that time, "dark radiation"), while water (both as true vapor and condensed in the form of microscopic droplets suspended in clouds) and CO2 and other poly-atomic gaseous molecules do absorb infrared radiation. In the early 20th century researchers realized that greenhouse gases in the atmosphere made Earth's overall temperature higher than it would be without them. During the late 20th century, a scientific consensus evolved that increasing concentrations of greenhouse gases in the atmosphere cause a substantial rise in global temperatures and changes to other parts of the climate system,[159] with consequences for the environment and for human health.
See also
- Attribution of recent climate change
- Carbon accounting
- Carbon credit
- Carbon emissions reporting
- Carbon neutrality
- Carbon offset
- Cap and Trade
- Deforestation and climate change
- Effects of global warming
- Emission standard
- Environmental impact of aviation
- Greenhouse debt
- Hydrogen economy
- Integrated Carbon Observation System
- List of countries by electricity production from renewable sources
- List of international environmental agreements
- Low-carbon economy
- Methane
- Mobile source air pollution
- Paris Agreement
- Perfluorotributylamine
- Physical properties of greenhouse gases
- Sustainability measurement
- World energy consumption
- Zero-emissions vehicle
- Top contributors to carbon dioxide emissions
References
- 1 2 "IPCC AR4 SYR Appendix Glossary" (PDF). Retrieved 14 December 2008.
- ↑ "NASA GISS: Science Briefs: Greenhouse Gases: Refining the Role of Carbon Dioxide". www.giss.nasa.gov. Retrieved 2016-04-26.
- ↑ Karl TR, Trenberth KE (2003). "Modern global climate change". Science. 302 (5651): 1719–23. Bibcode:2003Sci...302.1719K. doi:10.1126/science.1090228. PMID 14657489.
- ↑ Le Treut H.; Somerville R.; Cubasch U.; Ding Y.; Mauritzen C.; Mokssit A.; Peterson T.; Prather M. Historical overview of climate change science (PDF). Retrieved 14 December 2008. in IPCC AR4 WG1 2007
- ↑ "NASA Science Mission Directorate article on the water cycle". Nasascience.nasa.gov. Archived from the original on 17 January 2009. Retrieved 16 October 2010.
- ↑ "Trends in Atmospheric Carbon Dioxide".
- ↑ "Frequently asked global change questions". Carbon Dioxide Information Analysis Center.
- ↑ ESRL Web Team (14 January 2008). "Trends in carbon dioxide". Esrl.noaa.gov. Retrieved 2011-09-11.
- ↑ EPA,OA, US. "Global Greenhouse Gas Emissions Data - US EPA". US EPA.
- ↑ "AR4 SYR Synthesis Report Summary for Policymakers – 2 Causes of change". ipcc.ch.
- ↑ Mora, C (2013). "The projected timing of climate departure from recent variability". Nature. 502 (7470): 183–87. Bibcode:2013Natur.502..183M. doi:10.1038/nature12540. PMID 24108050.
- ↑ Mann, Michael E. (2014-04-01). "Earth Will Cross the Climate Danger Threshold by 2036". Scientific American. Retrieved 30 August 2016.
- ↑ "FAQ 7.1". p. 14. in IPCC AR4 WG1 2007
- ↑ Canadell, J.G.; Le Quere, C.; Raupach, M.R.; Field, C.B.; Buitenhuis, E.T.; Ciais, P.; Conway, T.J.; Gillett, N.P.; Houghton, R.A.; Marland, G. (2007). "Contributions to accelerating atmospheric CO2 growth from economic activity, carbon intensity, and efficiency of natural sinks". Proc. Natl. Acad. Sci. USA. 104 (47): 18866–70. Bibcode:2007PNAS..10418866C. doi:10.1073/pnas.0702737104. PMC 2141868. PMID 17962418.
- ↑ http://earthobservatory.nasa.gov/Library/RemoteSensingAtmosphere/remote_sensing6.html Archived 20 September 2008 at the Wayback Machine.
- 1 2 Forster, P.; et al. (2007). "2.10.3 Indirect GWPs". Changes in Atmospheric Constituents and in Radiative Forcing. Contribution of Working Group I to the Fourth Assessment Report of the Intergovernmental Panel on Climate Change. Cambridge University Press. Retrieved 2012-12-02.
- ↑ MacCarty, N. "Laboratory Comparison of the Global-Warming Potential of Six Categories of Biomass Cooking Stoves" (PDF). Approvecho Research Center. Archived from the original (PDF) on 11 November 2013.
- 1 2 3 Kiehl, J.T.; Kevin E. Trenberth (1997). "Earth's annual global mean energy budget" (PDF). Bulletin of the American Meteorological Society. 78 (2): 197–208. Bibcode:1997BAMS...78..197K. doi:10.1175/1520-0477(1997)078<0197:EAGMEB>2.0.CO;2. Archived from the original (PDF) on 30 March 2006. Retrieved 1 May 2006.
- 1 2 3 "Water vapour: feedback or forcing?". RealClimate. 6 April 2005. Retrieved 1 May 2006.
- ↑ Schmidt, G.A.; R. Ruedy; R.L. Miller; A.A. Lacis (2010), "The attribution of the present-day total greenhouse effect" (PDF), J. Geophys. Res., 115, Bibcode:2010JGRD..11520106S, doi:10.1029/2010JD014287, archived from the original (PDF) on 22 October 2011 , D20106. Web page
- ↑ Lacis, A. (October 2010), NASA GISS: CO2: The Thermostat that Controls Earth's Temperature, New York: NASA GISS
- 1 2 3 4 5 "Appendix 8.A". Intergovernmental Panel on Climate Change Fifth Assessment Report (PDF). p. 731.
- ↑ Shindell, Drew T. (2005). "An emissions-based view of climate forcing by methane and tropospheric ozone". Geophysical Research Letters. 32 (4): L04803. Bibcode:2005GeoRL..32.4803S. doi:10.1029/2004GL021900.
- ↑ "Methane's Impacts on Climate Change May Be Twice Previous Estimates". Nasa.gov. 30 November 2007. Retrieved 2010-10-16.
- ↑ "Climate Change Indicators: Atmospheric Concentrations of Greenhouse Gases". Climate Change Indicators. United States Environmental Protection Agency. Retrieved 2017-01-20.
- ↑ Wallace, John M. and Peter V. Hobbs. Atmospheric Science; An Introductory Survey. Elsevier. Second Edition, 2006. ISBN 978-0127329512. Chapter 1
- ↑ Prather, Michael J.; J Hsu (2008). "NF
3, the greenhouse gas missing from Kyoto". Geophysical Research Letters. 35 (12): L12810. Bibcode:2008GeoRL..3512810P. doi:10.1029/2008GL034542. - ↑ Isaksen, Ivar S.A.; Michael Gauss; Gunnar Myhre; Katey M. Walter Anthony; Carolyn Ruppel (20 April 2011). "Strong atmospheric chemistry feedback to climate warming from Arctic methane emissions" (PDF). Global Biogeochemical Cycles. 25 (2): n/a. Bibcode:2011GBioC..25B2002I. doi:10.1029/2010GB003845. Retrieved 29 July 2011.
- ↑ "AGU Water Vapor in the Climate System". Eso.org. 27 April 1995. Retrieved 2011-09-11.
- ↑ Betts (2001). "6.3 Well-mixed Greenhouse Gases". Chapter 6 Radiative Forcing of Climate Change. Working Group I: The Scientific Basis IPCC Third Assessment Report – Climate Change 2001. UNEP/GRID-Arendal – Publications. Archived from the original on 29 June 2011. Retrieved 16 October 2010.
- 1 2 Jacob, Daniel (1999). Introduction to atmospheric chemistry. Princeton University Press. pp. 25–26. ISBN 978-0691001852. Archived from the original on 2 September 2011.
- ↑ "How long will global warming last?". RealClimate. Retrieved 2012-06-12.
- ↑ Jacobson, M.Z. (2005). "Correction to "Control of fossil-fuel particulate black carbon and organic matter, possibly the most effective method of slowing global warming."". J. Geophys. Res. 110. p. D14105. Bibcode:2005JGRD..11014105J. doi:10.1029/2005JD005888.
- ↑ Archer, David (2009). "Atmospheric lifetime of fossil fuel carbon dioxide". Annual Review of Earth and Planetary Sciences. 37. pp. 117–34. Bibcode:2009AREPS..37..117A. doi:10.1146/annurev.earth.031208.100206.
- ↑ "Frequently Asked Question 10.3: If emissions of greenhouse gases are reduced, how quickly do their concentrations in the atmosphere decrease?". Global Climate Projections. Retrieved 2011-06-01. in IPCC AR4 WG1 2007
- ↑ See also: Archer, David (2005). "Fate of fossil fuel CO2 in geologic time" (PDF). Journal of Geophysical Research. 110 (C9): C09S05.1–6. Bibcode:2005JGRC..11009S05A. doi:10.1029/2004JC002625. Retrieved 27 July 2007.
- ↑ See also: Caldeira, Ken; Wickett, Michael E. (2005). "Ocean model predictions of chemistry changes from carbon dioxide emissions to the atmosphere and ocean" (PDF). Journal of Geophysical Research. 110 (C9): C09S04.1–12. Bibcode:2005JGRC..11009S04C. doi:10.1029/2004JC002671. Archived from the original (PDF) on 10 August 2007. Retrieved 27 July 2007.
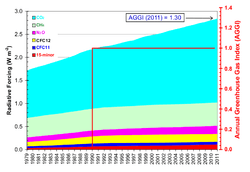
- 1 2 3 4 5 6 7 8 9 Edited quote from public-domain source: "Climate Change Indicators in the United States". U.S. Environmental Protection Agency (EPA). 2010. Greenhouse Gases: Figure 1. The Annual Greenhouse Gas Index, 1979–2008: Background. . PDF (p. 18)
- 1 2 "Table 2.14". IPCC Fourth Assessment Report (PDF). p. 212.
- ↑ Chandler, David L. "How to count methane emissions". MIT News. Retrieved 2018-08-20. Referenced paper is Trancik, Jessika; Edwards, Morgan (April 25, 2014). "Climate impacts of energy technologies depend on emissions timing" (PDF). Nature Climate Change. 4: 347. Archived from the original (PDF) on 16 January 2015. Retrieved January 15, 2015.
- ↑ Vaara, Miska (2003), Use of ozone depleting substances in laboratories, TemaNord, p. 170, ISBN 978-9289308847, archived from the original on 6 August 2011
- ↑ Montreal Protocol
- ↑ St. Fleur, Nicholas (10 November 2015). "Atmospheric Greenhouse Gas Levels Hit Record, Report Says". New York Times. Retrieved 11 November 2015.
- ↑ Ritter, Karl (9 November 2015). "UK: In 1st, global temps average could be 1 degree C higher". AP News. Retrieved 11 November 2015.
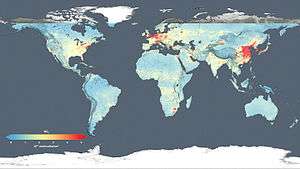
- ↑ Cole, Steve; Gray, Ellen (14 December 2015). "New NASA Satellite Maps Show Human Fingerprint on Global Air Quality". NASA. Retrieved 14 December 2015.
- ↑ Canadell, J.G.; et al. (20 November 2007), "Contributions to Accelerating Atmospheric CO2 Growth from Economic Activity, Carbon Intensity, and Efficiency of Natural Sinks (Results and Discussion: Growth in Atmospheric CO2)", Proceedings of the National Academy of Sciences of the United States of America, 104 (47): 18866–70, Bibcode:2007PNAS..10418866C, doi:10.1073/pnas.0702737104, PMC 2141868, PMID 17962418
- ↑ "Historical Overview of Climate Change Science – FAQ 1.3 Figure 1" (PDF). p. 116. in IPCC AR4 WG1 2007
- ↑ "Chapter 3, IPCC Special Report on Emissions Scenarios, 2000" (PDF). Intergovernmental Panel on Climate Change. 2000. Retrieved 16 October 2010.
- ↑ Intergovernmental Panel on Climate Change (November 17, 2007). "Climate Change 2007: Synthesis Report" (PDF). p. 5. Retrieved 2017-01-20.
- 1 2 Blasing, T.J. 2013
- 1 2 3 Ehhalt, D.; et al., "Table 4.1", Atmospheric Chemistry and Greenhouse Gases, archived from the original on 3 January 2013 , in IPCC TAR WG1 2001, pp. 244–45. Referred to by: Blasing, T.J. (February 2013), Current Greenhouse Gas Concentrations, doi:10.3334/CDIAC/atg.032 , on Blasing, T.J. 2013. Based on Blasing et al. (2013): Pre-1750 concentrations of CH4,N2O and current concentrations of O3, are taken from Table 4.1 (a) of the IPCC Intergovernmental Panel on Climate Change), 2001. Following the convention of IPCC (2001), inferred global-scale trace-gas concentrations from prior to 1750 are assumed to be practically uninfluenced by human activities such as increasingly specialized agriculture, land clearing, and combustion of fossil fuels. Preindustrial concentrations of industrially manufactured compounds are given as zero. The short atmospheric lifetime of ozone (hours-days) together with the spatial variability of its sources precludes a globally or vertically homogeneous distribution, so that a fractional unit such as parts per billion would not apply over a range of altitudes or geographical locations. Therefore a different unit is used to integrate the varying concentrations of ozone in the vertical dimension over a unit area, and the results can then be averaged globally. This unit is called a Dobson Unit (D.U.), after G.M.B. Dobson, one of the first investigators of atmospheric ozone. A Dobson unit is the amount of ozone in a column that, unmixed with the rest of the atmosphere, would be 10 micrometers thick at standard temperature and pressure.
- ↑ Because atmospheric concentrations of most gases tend to vary systematically over the course of a year, figures given represent averages over a 12-month period for all gases except ozone (O3), for which a current global value has been estimated (IPCC, 2001, Table 4.1a). CO2 averages for year 2012 are taken from the National Oceanic and Atmospheric Administration, Earth System Research Laboratory, web site: www.esrl.noaa.gov/gmd/ccgg/trends maintained by Dr. Pieter Tans. For other chemical species, the values given are averages for 2011. These data are found on the CDIAC AGAGE web site: http://cdiac.ornl.gov/ndps/alegage.html or the AGAGE home page: http://agage.eas.gatech.edu.
- 1 2 Forster, P.; et al., "Table 2.1", Changes in Atmospheric Constituents and in Radiative Forcing , in IPCC AR4 WG1 2007, p. 141. Referred to by: Blasing, T.J. 2013
- ↑ Prentice, I.C.; et al. "Executive summary". The Carbon Cycle and Atmospheric Carbon Dioxide. Archived from the original on 7 December 2009. , in IPCC TAR WG1 2001, p. 185. Referred to by: Blasing, T.J. (February 2013), Current Greenhouse Gas Concentrations, doi:10.3334/CDIAC/atg.032 , on Blasing, T.J. 2013
- ↑ Recent CO2 concentration (395.4 ppm) is the 2013 average taken from globally averaged marine surface data given by the National Oceanic and Atmospheric Administration Earth System Research Laboratory, website: http://www.esrl.noaa.gov/gmd/ccgg/trends/index.html#global. Please read the material on that web page and reference Dr. Pieter Tans when citing this average (Dr. Pieter Tans, NOAA/ESRL http://www.esrl.noaa.gov/gmd/ccgg/trends). The oft-cited Mauna Loa average for 2012 is 393.8 ppm, which is a good approximation although typically about 1 ppm higher than the spatial average given above. Refer to http://www.esrl.noaa.gov/gmd/ccgg/trends for records back to the late 1950s.
- ↑ ppb = parts-per-billion
- 1 2 3 4 The first value in a cell represents Mace Head, Ireland, a mid-latitude Northern-Hemisphere site, while the second value represents Cape Grim, Tasmania, a mid-latitude Southern-Hemisphere site. "Current" values given for these gases are annual arithmetic averages based on monthly background concentrations for year 2011. The SF
6 values are from the AGAGE gas chromatography – mass spectrometer (gc-ms) Medusa measuring system. - ↑ "Advanced Global Atmospheric Gases Experiment (AGAGE)". Data compiled from finer time scales in the Prinn; etc (2000). "ALE/GAGE/AGAGE database".
- ↑ The pre-1750 value for N
2O is consistent with ice-core records from 10,000 BCE through 1750 CE: "Summary for policymakers", Figure SPM.1, IPCC , in IPCC AR4 WG1 2007, p. 3. Referred to by: Blasing, T.J. (February 2013), Current Greenhouse Gas Concentrations, doi:10.3334/CDIAC/atg.032 , on Blasing, T.J. 2013 - ↑ Changes in stratospheric ozone have resulted in a decrease in radiative forcing of 0.05 W/m2: Forster, P.; et al., "Table 2.12", Changes in Atmospheric Constituents and in Radiative Forcing , in IPCC AR4 WG1 2007, p. 204. Referred to by: Blasing, T.J. 2013
- 1 2 "SF
6 data from January 2004". "Data from 1995 through 2004". National Oceanic and Atmospheric Administration (NOAA), Halogenated and other Atmospheric Trace Species (HATS). Sturges, W.T.; et al. "Concentrations of SF
6 from 1970 through 1999, obtained from Antarctic firn (consolidated deep snow) air samples". - ↑ File:Phanerozoic Carbon Dioxide.png
- ↑ Berner, Robert A. (January 1994). "GEOCARB II: a revised model of atmospheric CO2 over Phanerozoic time" (PDF). American Journal of Science. 294 (1): 56–91. Bibcode:1994AmJS..294...56B. doi:10.2475/ajs.294.1.56.
- ↑ Royer, D.L.; R.A. Berner; D.J. Beerling (2001). "Phanerozoic atmospheric CO2 change: evaluating geochemical and paleobiological approaches". Earth-Science Reviews. 54 (4): 349–92. Bibcode:2001ESRv...54..349R. doi:10.1016/S0012-8252(00)00042-8.
- ↑ Berner, Robert A.; Kothavala, Zavareth (2001). "GEOCARB III: a revised model of atmospheric CO2 over Phanerozoic time" (PDF). American Journal of Science. 301 (2): 182–204. Bibcode:2001AmJS..301..182B. CiteSeerX 10.1.1.393.582. doi:10.2475/ajs.301.2.182. Archived from the original (PDF) on 6 August 2004.
- ↑ Beerling, D.J.; Berner, R.A. (2005). "Feedbacks and the co-evolution of plants and atmospheric CO2". Proc. Natl. Acad. Sci. USA. 102 (5): 1302–05. Bibcode:2005PNAS..102.1302B. doi:10.1073/pnas.0408724102. PMC 547859. PMID 15668402.
- 1 2 Hoffmann, PF; AJ Kaufman; GP Halverson; DP Schrag (1998). "A neoproterozoic snowball earth". Science. 281 (5381): 1342–46. Bibcode:1998Sci...281.1342H. doi:10.1126/science.281.5381.1342. PMID 9721097.
- ↑ Siegel, Ethan. "How Much CO2 Does A Single Volcano Emit?". Forbes. Retrieved 2018-09-06.
- ↑ Gerlach, TM (1991). "Present-day CO2 emissions from volcanoes". Transactions of the American Geophysical Union. 72 (23): 249–55. Bibcode:1991EOSTr..72..249.. doi:10.1029/90EO10192.
- ↑ See also: "U.S. Geological Survey". 14 June 2011. Retrieved 15 October 2012.
- ↑ Flückiger, Jacqueline (2002). "High-resolution Holocene N
2O ice core record and its relationship with CH
4 and CO2". Global Biogeochemical Cycles. 16: 1010. Bibcode:2002GBioC..16a..10F. doi:10.1029/2001GB001417. - ↑ Friederike Wagner; Bent Aaby; Henk Visscher (2002). "Rapid atmospheric CO2 changes associated with the 8,200-years-B.P. cooling event". Proc. Natl. Acad. Sci. USA. 99 (19): 12011–14. Bibcode:2002PNAS...9912011W. doi:10.1073/pnas.182420699. PMC 129389. PMID 12202744.
- ↑ Andreas Indermühle; Bernhard Stauffer; Thomas F. Stocker (1999). "Early Holocene Atmospheric CO2 Concentrations". Science. 286 (5446): 1815. doi:10.1126/science.286.5446.1815a. IndermÜhle, A (1999). "Early Holocene atmospheric CO2 concentrations". Science. 286 (5446): 1815a–15. doi:10.1126/science.286.5446.1815a. Retrieved 26 May 2005.
- ↑ H. J. Smith; M. Wahlen; D. Mastroianni (1997). "The CO2 concentration of air trapped in GISP2 ice from the Last Glacial Maximum-Holocene transition". Geophysical Research Letters. 24 (1): 1–4. Bibcode:1997GeoRL..24....1S. doi:10.1029/96GL03700.
- ↑ Charles J. Kibert (2016). "Background". Sustainable Construction: Green Building Design and Delivery. Wiley. ISBN 978-1119055327.
- ↑ "Full Mauna Loa CO2 record". Earth System Research Laboratory. 2005. Retrieved 6 May 2017.
- ↑ Tans, Pieter (3 May 2008). "Annual CO2 mole fraction increase (ppm) for 1959–2007". National Oceanic and Atmospheric Administration Earth System Research Laboratory, Global Monitoring Division. "additional details". ; see also Masarie, K.A.; Tans, P.P. (1995). "Extension and integration of atmospheric carbon dioxide data into a globally consistent measurement record" (Full text). J. Geophys. Res. 100: 11593–610. Bibcode:1995JGR...10011593M. doi:10.1029/95JD00859.
- ↑ Dumitru-Romulus Târziu; Victor-Dan Păcurar (Jan 2011). "Pădurea, climatul și energia". Rev. pădur. (in Romanian). 126 (1): 34–39. ISSN 1583-7890. 16720. Archived from the original on 2013-04-16. Retrieved 2012-06-11. (webpage has a translation button)
- 1 2 "Climate Change Indicators in the United States". NOAA. 2012. Figure 4. The Annual Greenhouse Gas Index, 1979–2011.
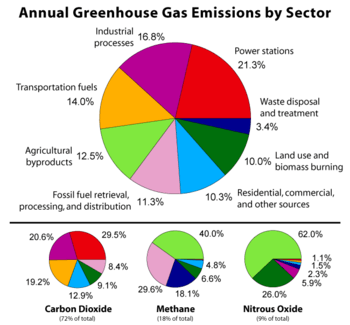
- ↑ "Climate Change Indicators in the United States". US Environmental Protection Agency (EPA). 2010. Figure 2. Global Greenhouse Gas Emissions by Sector, 1990–2005.
- ↑ "Climate Change 2001: Working Group I: The Scientific Basis: figure 6-6". Archived from the original on 14 June 2006. Retrieved 1 May 2006.
- ↑ "The present carbon cycle – Climate Change". Grida.no. Retrieved 2010-10-16.
- 1 2 Couplings Between Changes in the Climate System and Biogeochemistry (PDF). Retrieved 13 May 2008. in IPCC AR4 WG1 2007
- ↑ IPCC (2007d). "6.1 Observed changes in climate and their effects, and their causes". 6 Robust findings, key uncertainties. Climate Change 2007: Synthesis Report. A Contribution of Working Groups I, II, and III to the Fourth Assessment Report of the Intergovernmental Panel on Climate Change (IPCC). Geneva: IPCC.
- 1 2 "6.2 Drivers and projections of future climate changes and their impacts". 6 Robust findings, key uncertainties. Climate Change 2007: Synthesis Report. A Contribution of Working Groups I, II, and III to the Fourth Assessment Report of the Intergovernmental Panel on Climate Change (IPCC). Geneva, Switzerland: IPCC. 2007d.
- 1 2 "3.3.1 Impacts on systems and sectors". 3 Climate change and its impacts in the near and long term under different scenarios. Climate Change 2007: Synthesis Report. A Contribution of Working Groups I, II, and III to the Fourth Assessment Report of the Intergovernmental Panel on Climate Change (IPCC). Geneva: IPCC. 2007d.
- ↑ Steinfeld, H.; Gerber, P.; Wassenaar, T.; Castel, V.; Rosales, M.; de Haan, C. (2006). "Livestock's long shadow". FAO Livestock, Environment and Development (LEAD) Initiative.
- ↑ Ciais, Phillipe; Sabine, Christopher; et al. "Carbon and Other Biogeochemical Cycles". In Stocker Thomas F.; et al. Climate Change 2013: The Physical Science Basis (PDF). IPCC. p. 473.
- 1 2 Raupach, M.R.; et al. (2007). "Global and regional drivers of accelerating CO2 emissions" (PDF). Proc. Natl. Acad. Sci. USA. 104 (24): 10288–93. Bibcode:2007PNAS..10410288R. doi:10.1073/pnas.0700609104. PMC 1876160. PMID 17519334.
- ↑ Schrooten, L; De Vlieger, Ina; Int Panis, Luc; Styns, R. Torfs, K; Torfs, R (2008). "Inventory and forecasting of maritime emissions in the Belgian sea territory, an activity based emission model". Atmospheric Environment. 42 (4): 667–76. Bibcode:2008AtmEn..42..667S. doi:10.1016/j.atmosenv.2007.09.071.
- 1 2 3 Grubb, M. (July–September 2003). "The economics of the Kyoto protocol" (PDF). World Economics. 4 (3). Archived from the original (PDF) on 17 July 2011.
- ↑ Lerner & K. Lee Lerner, Brenda Wilmoth (2006). "Environmental issues: essential primary sources". Thomson Gale. Retrieved 11 September 2006.
- 1 2 "Kyoto Protocol". United Nations Framework Convention on Climate Change. Home > Kyoto Protocol.
- 1 2 King, D.; et al. (July 2011), "Copenhagen and Cancún", International climate change negotiations: Key lessons and next steps, Oxford: Smith School of Enterprise and the Environment, University of Oxford, p. 12, doi:10.4210/ssee.pbs.2011.0003 (inactive 14 August 2018), archived from the original on 1 August 2013 "PDF available" (PDF). Archived from the original (PDF) on 13 January 2012.
- ↑ Johnston, Chris; Milman, Oliver; Vidal, John (15 October 2016). "Climate change: global deal reached to limit use of hydrofluorocarbons". The Guardian. Retrieved 2018-08-21.
- ↑ "Climate change: 'Monumental' deal to cut HFCs, fastest growing greenhouse gases". BBC News. 15 October 2016. Retrieved 15 October 2016.
- ↑ "Nations, Fighting Powerful Refrigerant That Warms Planet, Reach Landmark Deal". New York Times. 15 October 2016. Retrieved 15 October 2016.
- ↑ "Environmental Impacts of Tourism – Global Level". UNEP.
- ↑ "A Cheaper and More Efficient Freight Industry In and Out of the UK". freightbestpractice.org.uk. Retrieved 13 September 2015.
- ↑ Newbold, Richard (May 19, 2014), A practical guide for fleet operators, returnloads.net, retrieved 2017-01-20.
- ↑ Glazner, Elizabeth. "Plastic Pollution and Climate Change". Plastic Pollution Coalition. Plastic Pollution Coalition. Retrieved 6 August 2018.
- ↑ Luise Blue, Marie-. "What Is the Carbon Footprint of a Plastic Bottle?". Sciencing. Leaf Group Ltd. Retrieved 6 August 2018.
- ↑ Jeanne Royer, Sarah-; Ferrón, Sara; T. Wilson, Samuel; M. Karl, David (August 1, 2018). "Production of methane and ethylene from plastic in the environment". PLOS One. 13 (Plastic, Climate Change): e0200574. doi:10.1371/journal.pone.0200574. PMC 6070199. PMID 30067755. Retrieved 6 August 2018.
- ↑ Rosane, Olivia (2 August 2018). "Study Finds New Reason to Ban Plastic: It Emits Methane in the Sun" (Plastic, Climate Change). Ecowatch. Retrieved 6 August 2018.
- ↑ EPA (2012). "Landfilling" (PDF).
- ↑ Levis, James W.; Barlaz, Morton A. (July 2011). "Is Biodegradability a Desirable Attribute for Discarded Solid Waste? Perspectives from a National Landfill Greenhouse Gas Inventory Model". Environmental Science & Technology. 45 (13): 5470–5476. Bibcode:2011EnST...45.5470L. doi:10.1021/es200721s. PMID 21615182.
- ↑
- ↑ Held, I.M. and Soden, B.J., 2000. Water vapor feedback and global warming. Annual review of energy and the environment, 25(1), pp.441–475.
- ↑ Evans, Kimberly Masters (2005). "The greenhouse effect and climate change". The environment: a revolution in attitudes. Detroit: Thomson Gale. ISBN 978-0787690823.
- ↑ "Inventory of U.S. Greenhouse Gas Emissions and Sinks: 1990–2010" (PDF). U.S. Environmental Protection Agency. 15 April 2012. p. 1.4. Retrieved 2 June 2012.
- ↑ Held, I.M.; Soden, B.J. (2000). "Water Vapor Feedback and Global Warming1" (Submitted manuscript). Annual Review of Energy and the Environment. 25: 441–75. CiteSeerX 10.1.1.22.9397. doi:10.1146/annurev.energy.25.1.441.
- ↑ Includes the Kyoto "basket" of GHGs
- 1 2 3 4 5 "Introduction". Executive Summary. in Rogner et al. 2007
- ↑ "Introduction". 1.3.1 Review of the last three decades. in Rogner et al. 2007 This citation clarifies the time period (1970–2004) for the observed emissions trends.
- ↑ Bridging the Emissions Gap: A UNEP Synthesis Report (PDF), Nairobi, Kenya: United Nations Environment Programme (UNEP), November 2011, ISBN 978-9280732290 UNEP Stock Number: DEW/1470/NA
- ↑ "Global Greenhouse Gas Emissions Data". EPA. Retrieved 4 March 2014.
The burning of coal, natural gas, and oil for electricity and heat is the largest single source of global greenhouse gas emissions.
- ↑ "What is GHG?". ADEC Innovations ESG Solutions. Retrieved 2018-01-09.
- 1 2 "Selected Development Indicators" (PDF). World Development Report 2010: Development and Climate Change (PDF). Washington, DC: The International Bank for Reconstruction and Development / The World Bank. 2010. Tables A1 and A2. doi:10.1596/978-0-8213-7987-5. ISBN 978-0821379875.
- 1 2 Bader, N.; Bleichwitz, R. (2009). "Measuring urban greenhouse gas emissions: The challenge of comparability. S.A.P.I.EN.S. 2 (3)". Sapiens.revues.org. Retrieved 2011-09-11.
- 1 2 3 4 5 6 7 8 Banuri, T. (1996). Equity and social considerations. In: Climate change 1995: Economic and social dimensions of climate change. Contribution of Working Group III to the Second Assessment Report of the Intergovernmental Panel on Climate Change (J.P. Bruce et al. Eds.) (PDF). This version: Printed by Cambridge University Press, Cambridge and New York. PDF version: IPCC website. doi:10.2277/0521568544. ISBN 978-0521568548.
- ↑ World energy outlook 2007 edition – China and India insights. International Energy Agency (IEA), Head of Communication and Information Office, 9 rue de la Fédération, 75739 Paris Cedex 15, France. 2007. p. 600. ISBN 978-9264027305. Retrieved 2010-05-04.
- ↑ Holtz-Eakin, D. (1995). "Stoking the fires? CO2 emissions and economic growth". Journal of Public Economics. 57 (1): 85–101. doi:10.1016/0047-2727(94)01449-X.
- ↑ Dodman, David (April 2009). "Blaming cities for climate change? An analysis of urban greenhouse gas emissions inventories". Environment and Urbanization. 21 (1): 185–201. doi:10.1177/0956247809103016. ISSN 0956-2478.
- ↑ B. Metz; O.R. Davidson; P.R. Bosch; R. Dave; L.A. Meyer (eds.), Annex I: Glossary J–P, archived from the original on 3 May 2010
- ↑ Markandya, A. (2001). "7.3.5 Cost Implications of Alternative GHG Emission Reduction Options and Carbon Sinks". In B. Metz; et al. Costing Methodologies. Climate Change 2001: Mitigation. Contribution of Working Group III to the Third Assessment Report of the Intergovernmental Panel on Climate Change. Print version: Cambridge University Press, Cambridge and New York. This version: GRID-Arendal website. doi:10.2277/0521015022 (inactive 14 August 2018). ISBN 978-0521015028. Archived from the original on 5 August 2011. Retrieved 11 April 2011.
- ↑ Herzog, T. (November 2006). Yamashita, M.B., ed. Target: intensity – an analysis of greenhouse gas intensity targets (PDF). World Resources Institute. ISBN 978-1569736388. Retrieved 2011-04-11.
- ↑ Botzen, W.J.W.; et al. (2008). "Cumulative CO2 emissions: shifting international responsibilities for climate debt". Climate Policy. 8 (6): 570. doi:10.3763/cpol.2008.0539.
- 1 2 3 Höhne, N.; et al. (24 September 2010). "Contributions of individual countries' emissions to climate change and their uncertainty" (PDF). Climatic Change. 106 (3): 359–91. doi:10.1007/s10584-010-9930-6. Archived from the original (PDF) on 26 April 2012.
- 1 2 3 World Energy Outlook 2009 (PDF), Paris: International Energy Agency (IEA), 2009, pp. 179–80, ISBN 978-9264061309
- ↑ "Introduction", 1.3.1 Review of the last three decades in Rogner et al. 2007
- ↑ The cited paper uses the term "start date" instead of "base year."
- 1 2 3 "Global CO2 emissions: annual increase halves in 2008". Netherlands Environmental Assessment Agency (PBL) website. 25 June 2009. Retrieved 2010-05-05.
- ↑ "Global Carbon Mechanisms: Emerging lessons and implications (CTC748)". Carbon Trust. March 2009. p. 24. Retrieved 2010-03-31.
- ↑ Vaughan, Adam (2015-12-07). "Global emissions to fall for first time during a period of economic growth". The Guardian. ISSN 0261-3077. Retrieved 2016-12-23.
- ↑ CO2 Emissions From Fuel Combustion: Highlights (2011 edition), Paris, France: International Energy Agency (IEA), 2011, p. 9
- ↑ Helm, D.; et al. (10 December 2007). Too Good To Be True? The UK's Climate Change Record (PDF). p. 3. Archived from the original (PDF) on 15 July 2011.
- 1 2 3 Davis, S.J.; K. Caldeira (8 March 2010). "Consumption-based Accounting of CO2 Emissions" (PDF). Proceedings of the National Academy of Sciences of the United States of America. 107 (12): 5687–5692. Bibcode:2010PNAS..107.5687D. doi:10.1073/pnas.0906974107. PMC 2851800. PMID 20212122. Retrieved 2011-04-18.
- ↑ "International Carbon Flows". Carbon Trust. May 2011. Retrieved 12 November 2012.
- ↑ e.g., Gupta et al. (2007) assessed the scientific literature on climate change mitigation policy: Gupta, S.; et al. Policies, instruments, and co-operative arrangements. in Rogner et al. 2007
- ↑ "Energy Policy". Paris: International Energy Agency (IEA). 2012.
- ↑ "IEA Publications on 'Energy Policy'". Paris: Organization for Economic Co-operation and Development (OECD) / International Energy Agency (IEA). 2012.
- ↑ Bridging the Emissions Gap: A UNEP Synthesis Report (PDF), Nairobi, Kenya: United Nations Environment Programme (UNEP), November 2011, ISBN 978-9280732290 UNEP Stock Number: DEW/1470/NA
- ↑ "4. Energizing development without compromising the climate" (PDF). World Development Report 2010: Development and Climate Change (PDF). Washington, DC: The International Bank for Reconstruction and Development / The World Bank. 2010. p. 192, Box 4.2: Efficient and clean energy can be good for development. doi:10.1596/978-0-8213-7987-5. ISBN 978-0821379875.
- ↑ Sixth compilation and synthesis of initial national communications from Parties not included in Annex I to the Convention. Note by the secretariat. Executive summary (PDF). Geneva, Switzerland: United Nations Framework Convention on Climate Change (UNFCCC). 2005. pp. 10–12.
- 1 2 3 4 Compilation and synthesis of fifth national communications. Executive summary. Note by the secretariat (PDF). Geneva (Switzerland): United Nations Framework Convention on Climate Change (UNFCCC). 2011. pp. 9–10.
- ↑ Fisher, B.; et al. "3.1 Emissions scenarios". Issues related to mitigation in the long-term context. in Rogner et al. 2007
- ↑ "1.3.2 Future outlook". Introduction. in Rogner et al. 2007
- ↑ "1.3.2.4 Total GHG emissions". Introduction. in Rogner et al. 2007
- ↑ carbon dioxide, methane, nitrous oxide, sulfur hexafluoride
- ↑ "Greenhouse Gas Emissions from a Typical Passenger Vehicle" (PDF). Epa.gov. US Environment Protection Agency. Retrieved 2011-09-11.
- ↑ Engber, Daniel (1 November 2006). "How gasoline becomes CO2, Slate Magazine". Slate Magazine. Retrieved 2011-09-11.
- ↑ "Volume calculation for carbon dioxide". Icbe.com. Retrieved 2011-09-11.
- ↑ "Voluntary Reporting of Greenhouse Gases Program". Energy Information Administration. Archived from the original on 1 November 2004. Retrieved 21 August 2009.
- ↑ Moomaw, W.; P. Burgherr; G. Heath; M. Lenzen; J. Nyboer; A. Verbruggen (2011). "Annex II: Methodology" (PDF). IPCC Special Report on Renewable Energy Sources and Climate Change Mitigation: 10.
- ↑ Obersteiner M; Azar C; Kauppi P; et al. (October 2001). "Managing climate risk". Science. 294 (5543): 786–87. doi:10.1126/science.294.5543.786b. PMID 11681318.
- ↑ Azar, C.; Lindgren, K.; Larson, E.D.; Möllersten, K. (2006). "Carbon capture and storage from fossil fuels and biomass – Costs and potential role in stabilising the atmosphere" (PDF). Climatic Change. 74: 47–79. doi:10.1007/s10584-005-3484-7.
- 1 2 3 "Geoengineering the climate: science, governance and uncertainty". The Royal Society. 2009. Archived from the original on 7 September 2009. Retrieved 12 September 2009.
- ↑ Fischer, B.S.; Nakicenovic, N.; Alfsen, K.; Morlot, J. Corfee; de la Chesnaye, F.; Hourcade, J.-Ch.; Jiang, K.; Kainuma, M.; La Rovere, E.; Matysek, A.; Rana, A.; Riahi, K.; Richels, R.; Rose, S.; van Vuuren, D.; Warren, R., Issues related to mitigation in the long term context (PDF) in Rogner et al. 2007
- ↑ Cook, J.; Nuccitelli, D.; Green, S.A.; Richardson, M.; Winkler, B.R.; Painting, R.; Way, R.; Jacobs, P.; Skuce, A. (2013). "Quantifying the consensus on anthropogenic global warming in the scientific literature". Environmental Research Letters. 8 (2): 024024. Bibcode:2013ERL.....8b4024C. doi:10.1088/1748-9326/8/2/024024.
Bibliography
- Carbon Dioxide Information Analysis Center (CDIAC), Oak Ridge, TN, 2012
- IPCC TAR WG1 (2001), Houghton, J.T.; Ding, Y.; Griggs, D.J.; Noguer, M.; van der Linden, P.J.; Dai, X.; Maskell, K.; Johnson, C.A., eds., Climate Change 2001: The Scientific Basis, Contribution of Working Group I (WG1) to the Third Assessment Report (TAR) of the Intergovernmental Panel on Climate Change (IPCC), Cambridge University Press, ISBN 978-0521807678, archived from the original on 30 March 2016 (pb: 0-521-01495-6)
- Rogner, H.-H.; Zhou, D.; Bradley, R.; Crabbé, P.; Edenhofer, O.; Hare, B.; Kuijpers, L.; Yamaguchi, M. (2007), B. Metz; O.R. Davidson; P.R. Bosch; R. Dave; L.A. Meyer, eds., Climate Change 2007: Mitigation. Contribution of Working Group III to the Fourth Assessment Report of the Intergovernmental Panel on Climate Change, Cambridge University Press, ISBN 978-0521880114
- IPCC AR4 WG1 (2007), Solomon, S.; Qin, D.; Manning, M.; Chen, Z.; Marquis, M.; Averyt, K.B.; Tignor, M.; Miller, H.L., eds., Climate Change 2007: The Physical Science Basis - Contribution of Working Group I (WG1) to the Fourth Assessment Report (AR4) of the Intergovernmental Panel on Climate Change (IPCC), Cambridge University Press, ISBN 978-0521880091 (pb: 978-0521705967)
- Van Dijk, P.; Zhang, J.; Jun, W.; Kuenzer, C.; Wolf, K.H. (2011). "Assessment of the contribution of in-situ combustion of coal to greenhouse gas emission; based on a comparison of Chinese mining information to previous remote sensing estimates". International Journal of Coal Geology. 86 (1 Special Issue RS/GIS): 108–19. doi:10.1016/j.coal.2011.01.009.
- Zhou, Yiqin (2011). Compar[ison of] Fresh or Ensiled Fodders (e.g., Grass, Legume, Corn) on the Production of Greenhouse Gases Following Enteric Fermentation in Beef Cattle. Rouyn-Noranda, Qué.: Université du Québec en Abitibi-Témiscamingue. N.B.: Research report.
- Blasing, T.J. (February 2013), Current Greenhouse Gas Concentrations, doi:10.3334/CDIAC/atg.032
External links
| Wikimedia Commons has media related to Greenhouse gases. |
- The official greenhouse gas emissions data of developed countries from the UNFCCC
- Greenhouse gas at Curlie (based on DMOZ)
- Annual Greenhouse Gas Index (AGGI) from NOAA
- Atmospheric spectra of GHGs and other trace gases
- How Much Greenhouse Gas Does the United States Emit?
Carbon dioxide emissions
- International Energy Annual: Reserves
- Trends in Atmospheric Carbon Dioxide at NOAA
- NOAA CMDL CCGG – Interactive Atmospheric Data Visualization NOAA CO2 data
- Carbon Dioxide Information Analysis Center (CDIAC)
- Little Green Data Book 2007, World Bank. Lists CO2 statistics by country, including per capita and by country income class.
- Database of carbon emissions of power plants
- NASA's Orbiting Carbon Observatory
| Authority control |
|---|