World energy consumption
World total primary energy consumption by fuel in 2015[2]
World energy consumption is the total energy used by the entire human civilization. Typically measured per year, it involves all energy harnessed from every energy source applied towards humanity's endeavours across every single industrial and technological sector, across every country. It does not include energy from food, and the extent to which direct biomass burning has been accounted for is poorly documented. Being the power source metric of civilization, World Energy Consumption has deep implications for humanity's socio-economic-political sphere.
Institutions such as the International Energy Agency (IEA), the U.S. Energy Information Administration (EIA), and the European Environment Agency (EEA) record and publish energy data periodically. Improved data and understanding of World Energy Consumption may reveal systemic trends and patterns, which could help frame current energy issues and encourage movement towards collectively useful solutions.
Closely related to energy consumption is the concept of total primary energy supply (TPES), which - on a global level - is the sum of energy production minus storage changes. Since changes of energy storage over the year are minor, TPES values can be used as an estimator for energy consumption. However, TPES ignores conversion efficiency, overstating forms of energy with poor conversion efficiency (e.g. coal, gas and nuclear) and understating forms already accounted for in converted forms (e.g. photovoltaic or hydroelectricity). The IEA estimates that, in 2013, total primary energy supply (TPES) was 1.575 × 10¹⁷ Wh (= 157.5 PWh, 157,500 TWh, 5.67 × 10²⁰ joules, or 13,541 Mtoe) or about 18 TW-year.[3] From 2000–2012 coal was the source of energy with the largest growth. The use of oil and natural gas also had considerable growth, followed by hydropower and renewable energy. Renewable energy grew at a rate faster than any other time in history during this period. The demand for nuclear energy decreased, in part due to nuclear disasters (e.g. Three Mile Island 1979, Chernobyl 1986, and Fukushima 2011).[1][4]
In 2011, expenditures on energy totalled over 6 trillion USD, or about 10% of the world gross domestic product (GDP). Europe spends close to one-quarter of the world's energy expenditures, North America close to 20%, and Japan 6%.[5]
Overview
Energy supply, consumption and electricity
| Year | Primary energy supply (TPES)1 |
Final energy consumption1 |
Electricity generation |
Ref |
|---|---|---|---|---|
| 1973 | 71,013 (Mtoe 6,106) |
54,335 (Mtoe 4,672) |
6,129 | [3] |
| 1990 | 102,569 | – | 11,821 | – |
| 2000 | 117,687 | – | 15,395 | – |
| 2010 | 147,899 (Mtoe 12,717) |
100,914 (Mtoe 8,677) |
21,431 | [6] |
| 2011 | 152,504 (Mtoe 13,113) |
103,716 (Mtoe 8,918) |
22,126 | [7] |
| 2012 | 155,505 (Mtoe 13,371) |
104,426 (Mtoe 8,979) |
22,668 | [8] |
| 2013 | 157,482 (Mtoe 13,541) |
108,171 (Mtoe 9,301) |
23,322 | [9] |
| 2014 | 155,481 (Mtoe 13,369) |
109,613 (Mtoe 9,425) |
23,816 | [10] |
| 2015 | 168,519 (Mtoe 13,647) |
109,136 (Mtoe 9,384) |
[11][12] | |
| 1 converted from Mtoe into TWh (1 Mtoe = 11.63 TWh) and from Quad BTU into TWh (1 Quad BTU = 293.07 TWh) | ||||
World total primary energy supply (TPES), or "primary energy" differs from the world final energy consumption because much of the energy that is acquired by humans is lost as other forms of energy during the process of its refinement into usable forms of energy and its transport from its initial place of supply to consumers. For instance, when oil is extracted from the ground it must be refined into gasoline, so that it can be used in a car, and transported over long distances to gas stations where it can be used by consumers. World final energy consumption refers to the fraction of the world's primary energy that is used in its final form by humanity.
In 2014, world primary energy supply amounted to 155,481 terawatt-hour (TWh) or 13,541 Mtoe, while the world final energy consumption was 109,613 TWh or about 29.5% less than the total supply.[10] World final energy consumption includes products as lubricants, asphalt and petrochemicals which have chemical energy content but are not used as fuel. This non-energy use amounted to 9,723 TWh (836 Mtoe) in 2015.[11]
2014 World electricity generation (23,816 TWh) by source (IEA, 2016)[13]
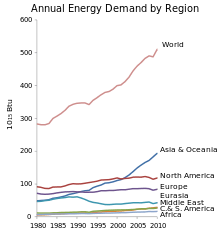
The United States Energy Information Administration (EIA) regularly publishes a report on world consumption for most types of primary energy resources. For 2013, estimated world energy consumption was 5.67 × 10²⁰ joules, or 157,481 TWh. According to the IEA the total world energy consumption in past years was 143,851 TWh in 2008, 133,602 TWh in 2005, 117,687 TWh in 2000, and 102,569 TWh in 1990.[3] In 2012 approximately 22% of world energy was consumed in North America, 5% was consumed South and Central America, 23% was consumed in Europe and Eurasia, 3% was consumed in Africa, and 40% was consumed in the Asia Pacific region.[1]
Electricity generation
The total amount of electricity consumed worldwide was 19,504 TWh in 2013, 16,503 TWh in 2008, 15,105 TWh in 2005, and 12,116 TWh in 2000. By the end of 2014, the total installed electricity generating capacity worldwide was nearly 6.142 TW (million MW) which only includes generation connected to local electricity grids.[14] In addition there is an unknown amount of heat and electricity consumed off-grid by isolated villages and industries. In 2014, the share of world energy consumption for electricity generation by source was coal at 40.8%, natural gas at 21.6%, nuclear at 10.6%, hydro at 16.4%, other sources (solar, wind, geothermal, biomass, etc.) at 6.3% and oil at 4.3%. Coal and natural gas were the most used energy fuels for generating electricity. The world's electricity consumption was 18,608 TWh in 2012. This figure is about 18% smaller than the generated electricity, due to grid losses, storage losses, and self-consumption from power plants (gross generation). Cogeneration (CHP) power stations use some of the heat that is otherwise wasted for use in buildings or in industrial processes.
In 2016 while total world energy came from 80% fossil fuels, 10% biofuels, 5% nuclear and 5% renewable (hydro, wind, solar, geothermal), only 18% of that total world energy was in the form of electricity.[15] Most of the other 82% was used for heat and transportation.
Recently there has been a large increase in international agreements and national Energy Action Plans, such as the EU 2009 Renewable Energy Directive, to increase the use of renewable energy due to the growing concerns about pollution from energy sources that come from fossil fuels such as oil, coal, and natural gas.[4][16] One such initiative was the United Nations Development Programme's World Energy Assessment in 2000 that highlighted many challenges humanity would have to overcome in order to shift from fossil fuels to renewable energy sources.[4] From 2000–2012 renewable energy grew at a rate higher than any other point in history, with a consumption increase of 176.5 million tonnes of oil. During this period, oil, coal, and natural gas continued to grow and had increases that were much higher than the increase in renewable energy. The following figures illustrate the growth in consumption of fossil fuels such as oil, coal, and natural gas as well as renewable sources of energy during this period.[1]
Trends
.svg.png)
The energy consumption growth in the G20 slowed down to 2% in 2011, after the strong increase of 2010. The economic crisis is largely responsible for this slow growth. For several years now, the world energy demand is characterized by the bullish Chinese and Indian markets, while developed countries struggle with stagnant economies, high oil prices, resulting in stable or decreasing energy consumption.[20]
According to IEA data from 1990 to 2008, the average energy use per person increased 10% while world population increased 27%. Regional energy use also grew from 1990 to 2008: the Middle East increased by 170%, China by 146%, India by 91%, Africa by 70%, Latin America by 66%, the USA by 20%, the EU-27 block by 7%, and world overall grew by 39%.
In 2008, total worldwide primary energy consumption was 132,000 terawatt-hours (TWh) or 474 exajoules (EJ).[21] In 2012, primary energy demand increased to 158,000 TWh (567 EJ).[22]
Energy consumption in the G20 increased by more than 5% in 2010 after a slight decline of 2009. In 2009, world energy consumption decreased for the first time in 30 years by 1.1%, or about 130 million tonnes of oil equivalent (Mtoe), as a result of the financial and economic crisis, which reduced world GDP by 0.6% in 2009.[23]
This evolution is the result of two contrasting trends: Energy consumption growth remained vigorous in several developing countries, specifically in Asia (+4%). Conversely, in OECD, consumption was severely cut by 4.7% in 2009 and was thus almost down to its 2000 levels. In North America, Europe and the CIS, consumptions shrank by 4.5%, 5% and 8.5% respectively due to the slowdown in economic activity. China became the world's largest energy consumer (18% of the total) since its consumption surged by 8% during 2009 (up from 4% in 2008). Oil remained the largest energy source (33%) despite the fact that its share has been decreasing over time. Coal posted a growing role in the world's energy consumption: in 2009, it accounted for 27% of the total.
Most energy is used in the country of origin, since it is cheaper to transport final products than raw materials. In 2008, the share export of the total energy production by fuel was: oil 50% (1,952/3,941 Mt), gas 25% (800/3,149 bcm) and hard coal 14% (793/5,845 Mt).[24]
Most of the world's high energy resources are from the conversion of the sun's rays to other energy forms after being incident upon the planet. Some of that energy has been preserved as fossil energy, some is directly or indirectly usable; for example, via solar PV/thermal, wind, hydro- or wave power. The total solar irradiance is measured by satellite to be roughly 1361 watts per square meter (see solar constant), though it fluctuates by about 6.9% during the year due to the Earth's varying distance from the sun. This value, after multiplication by the cross-sectional area intercepted by the Earth, is the total rate of solar energy received by the planet; about half, 89,000 TW, reaches the Earth's surface.[25]
The estimates of remaining non-renewable worldwide energy resources vary, with the remaining fossil fuels totaling an estimated 0.4 yottajoule (YJ) or 4 × 10²³ joules, and the available nuclear fuel such as uranium exceeding 2.5 YJ. Fossil fuels range from 0.6 to 3 YJ if estimates of reserves of methane clathrates are accurate and become technically extractable. The total power flux from the sun intercepting the Earth is 5.5 YJ per year, though not all of this is available for human consumption. The IEA estimates for the world to meet global energy demand for the two decades from 2015 to 2035 it will require investment of $48 trillion and "credible policy frameworks."[26]
According to IEA (2012) the goal of limiting warming to 2 °C is becoming more difficult and costly with each year that passes. If action is not taken before 2017, CO2 emissions would be locked-in by energy infrastructure existing in 2017. Fossil fuels are dominant in the global energy mix, supported by $523 billion subsidies in 2011, up almost 30% on 2010 and six times more than subsidies to renewables.[27]
| kWh/capita | Population (million) | Energy use (1,000 TWh) | |||||||
|---|---|---|---|---|---|---|---|---|---|
| Region | 1990 | 2008 | Growth | 1990 | 2008 | Growth | 1990 | 2008 | Growth |
| USA | 89,021 | 87,216 | −2% | 250 | 305 | 22% | 22.3 | 26.6 | 20% |
| EU-28 | 40,240 | 40,821 | 1% | 473 | 499 | 5% | 19.0 | 20.4 | 7% |
| Middle East | 19,422 | 34,774 | 79% | 132 | 199 | 51% | 2.6 | 6.9 | 170% |
| China | 8,839 | 18,608 | 111% | 1,141 | 1,333 | 17% | 10.1 | 24.8 | 146% |
| Latin America | 11,281 | 14,421 | 28% | 355 | 462 | 30% | 4.0 | 6.7 | 66% |
| Africa | 7,094 | 7,792 | 10% | 634 | 984 | 55% | 4.5 | 7.7 | 70% |
| India | 4,419 | 6,280 | 42% | 850 | 1,140 | 34% | 3.8 | 7.2 | 91% |
| Others* | 25,217 | 23,871 | nd | 1,430 | 1,766 | 23% | 36.1 | 42.2 | 17% |
| The World | 19,422 | 21,283 | 10% | 5,265 | 6,688 | 27% | 102.3 | 142.3 | 39% |
Source: IEA/OECD, Population OECD/World Bank
| |||||||||
Emissions
Global warming emissions resulting from energy production are an environmental problem. Efforts to resolve this include the Kyoto Protocol, which is a UN agreement aiming to reduce harmful climate impacts, which a number of nations have signed. Limiting global temperature increase to 2 degrees Celsius, thought to be a risk by the SEI, is now doubtful.
To limit global temperature to a hypothetical 2 degrees Celsius rise would demand a 75% decline in carbon emissions in industrial countries by 2050, if the population is 10 billion in 2050.[30] Across 40 years, this averages to a 2% decrease every year. In 2011, the emissions of energy production continued rising regardless of the consensus of the basic problem. Hypothetically, according to Robert Engelman (Worldwatch institute), in order to prevent collapse, human civilization would have to stop increasing emissions within a decade regardless of the economy or population (2009).[31]
Greenhouse gases are not the only emissions of energy production and consumption. Large amounts of pollutants such as sulphurous oxides (SOx), nitrous oxides (NOx), and particulate matter (PM) are produced from the combustion of fossil fuels and biomass; the World Health Organisation estimates that 7 million premature deaths are caused each year by air pollution.[32] Biomass combustion is a major contributor.[32][33][34] In addition to producing air pollution like fossil fuel combustion, most biomass has high CO2 emissions.[35]
By source
Fossil fuels
The twentieth century saw a rapid twenty-fold increase in the use of fossil fuels. Between 1980 and 2006, the worldwide annual growth rate was 2%.[21] According to the US Energy Information Administration's 2006 estimate, the estimated 471.8 EJ total consumption in 2004, was divided as given in the table above, with fossil fuels supplying 86% of the world's energy:
Coal
In 2000, China accounted for 28% of world coal consumption, other Asia consumed 19%, North America 25% and the EU 14%. The single greatest coal-consuming country is China. Its share of the world coal production was 28% in 2000 and rose to 48% in 2009. In contrast to China's ~70% increase in coal consumption, world coal use increased 48% from 2000 to 2009. In practice, the majority of this growth occurred in China and the rest in other Asia.[36] China's energy consumption is mostly driven by the industry sector, the majority of which comes from coal consumption.[37]
World annual coal production increased 1,905 Mt or 32% in 6 years in 2011 compared to 2005, of which over 70% was in China and 8% in India. Coal production was in 2011 7,783 Mt, and 2009 6,903 Mt, equal to 12.7% production increase in two years.[38]
If production and consumption of coal continue at the rate as in 2008, proven and economically recoverable world reserves of coal would last for about 150 years. This is much more than needed for an irreversible climate catastrophe. Coal is the largest source of carbon dioxide emissions in the world. According to James Hansen the single most important action needed to tackle the climate crisis is to reduce CO2 emissions from coal.[39] Indonesia and Australia exported together 57.1% of the world coal export in 2011. China, Japan, South Korea, India and Taiwan had 65% share of all the world coal import in 2011.[40]
| Region | 2000 | 2008 | 2009* | 2010* | %* | Change 2000–2009* |
|---|---|---|---|---|---|---|
| North America | 6,654 | 6,740 | 6,375 | 6,470 | 16% | −1.2% |
| Asia excl. China | 5,013 | 7,485 | 7,370 | 7,806 | 19% | 18.9% |
| China | 7,318 | 16,437 | 18,449 | 19,928 | 48% | 85.5% |
| EU | 3,700 | 3,499 | 3,135 | 3,137 | 8% | −3.8% |
| Africa | 1,049 | 1,213 | 1,288 | 1,109 | 3% | 0.4% |
| Russia | 1,387 | 1,359 | 994 | 1,091 | 3% | −2.0% |
| Others | 1,485 | 1,763 | 1,727 | 1,812 | 4% | 2.2% |
| Total | 26,607 | 38,497 | 39,340 | 41,354 | 100% | 47.9% |
| Source: IEA, *in 2009, 2010 BP *Change 2000–2009: Region's share of the world change +12,733 TWh from 2000 to 2009 | ||||||
| Rank | Nation | 2010 | 2011 | Share % 2011 |
2012 |
|---|---|---|---|---|---|
| 1 | Indonesia | 162 | 309 | 29.7% | 383 |
| 2 | Australia | 298 | 285 | 27.4% | 302 |
| 3 | Russia | 89 | 99 | 9.5% | 103 |
| 4 | US | 57 | 85 | 8.2% | 106 |
| 5 | Colombia | 68 | 76 | 7.3% | 82 |
| 6 | South Africa | 68 | 70 | 6.7% | 72 |
| 7 | Kazakhstan | 33 | 34 | 3.3% | 32 |
| 8 | Canada | 24 | 24 | 2.3% | 25 |
| 9 | Vietnam | 21 | 23 | 2.2% | 18 |
| 10 | Mongolia | 17 | 22 | 2.1% | 22 |
| x | Others | 19 | 14 | 1.3% | |
| Total (Mt) | 856 | 1,041 | 1,168 | ||
| Top ten | 97.8% | 98.7% | |||
Oil
Coal fueled the industrial revolution in the 18th and 19th century. With the advent of the automobile, aeroplanes and the spreading use of electricity, oil became the dominant fuel during the twentieth century. The growth of oil as the largest fossil fuel was further enabled by steadily dropping prices from 1920 until 1973. After the oil shocks of 1973 and 1979, during which the price of oil increased from 5 to 45 US dollars per barrel, there was a shift away from oil.[43] Coal, natural gas, and nuclear became the fuels of choice for electricity generation and conservation measures increased energy efficiency. In the U.S. the average car more than doubled the number of miles per gallon. Japan, which bore the brunt of the oil shocks, made spectacular improvements and now has the highest energy efficiency in the world.[44] From 1965 to 2008, the use of fossil fuels has continued to grow and their share of the energy supply has increased. From 2003 to 2008, coal was the fastest growing fossil fuel.[45]
It is estimated that between 100 and 135 billion tonnes of oil has been consumed between 1850 and the present.[46]
Natural Gas
In 2009, the world use of natural gas grew 31% compared to 2000. 66% of this growth was outside EU, North America, Latin America, and Russia. Others include the Middle East, Asia, and Africa. The gas supply increased also in the previous regions: 8.6% in the EU and 16% in the North America 2000–2009.[47]
| Land | 2000 | 2008 | 2009 | 2010 | % |
|---|---|---|---|---|---|
| North America | 7,621 | 7,779 | 8,839 | 8,925 | 27% |
| Asia excl. China | 2,744 | 4,074 | 4,348 | 4,799 | 14% |
| China | 270 | 825 | 1,015 | 1,141 | 3% |
| EU | 4,574 | 5,107 | 4,967 | 5,155 | 16% |
| Africa | 612 | 974 | 1,455 | 1,099 | 3% |
| Russia | 3,709 | 4,259 | 4,209 | 4,335 | 13% |
| Latin America | 1,008 | 1,357 | 958 | nd | nd |
| Others | 3,774 | 5,745 | 6,047 | 7,785 | 23% |
| Total | 24,312 | 30,134 | 31,837 | 33,240 | 100% |
| Source: IEA, in 2009, 2010 BP | |||||
Nuclear power
As of 1 July 2016, the world had 444 operable grid-electric nuclear power reactors with 62 others under construction.[48] Since commercial nuclear energy began in the mid 1950s, 2008 was the first year that no new nuclear power plant was connected to the grid, although two were connected in 2009.[49][50]
Annual generation of nuclear power has been on a slight downward trend since 2007, decreasing 1.8% in 2009 to 2558 TWh, and another 1.6% in 2011 to 2518 TWh, despite increases in production from most countries worldwide, because those increases were more than offset by decreases in Germany and Japan. Nuclear power met 11.7% of the world's electricity demand in 2011. Source: IEA/OECD[7]
Renewable energy
.png)
Renewable energy is generally defined as energy that comes from resources that are not significantly depleted by their use, such as sunlight, wind, rain, tides, waves and geothermal heat.[52] Renewable energy is gradually replacing conventional fuels in four distinct areas: electricity generation, hot water/space heating, motor fuels, and rural (off-grid) energy services.[53]
Based on REN21's 2014 report, renewables contributed 19 percent to our energy consumption and 22 percent to our electricity generation in 2012 and 2013, respectively. This energy consumption is divided as 9% coming from traditional biomass, 4.2% as heat energy (non-biomass), 3.8% hydro electricity and 2% electricity from wind, solar, geothermal, and biomass. Worldwide investments in renewable technologies amounted to more than US$214 billion in 2013, with countries like China and the United States heavily investing in wind, hydro, solar and biofuels.[54] Renewable energy resources exist over wide geographical areas, in contrast to other energy sources, which are concentrated in a limited number of countries. Rapid deployment of renewable energy and energy efficiency is resulting in significant energy security, climate change mitigation, and economic benefits.[55] In international public opinion surveys there is strong support for promoting renewable sources such as solar power and wind power.[56] At the national level, at least 30 nations around the world already have renewable energy contributing more than 20 percent of energy supply. National renewable energy markets are projected to continue to grow strongly in the coming decade and beyond.[57]
The following table shows increasing nameplate capacity, and has capacity factors that range from 11% for solar, to 40% for hydropower.[58]
| Selected renewable energy global indicators | 2008 | 2009 | 2010 | 2011 | 2012 | 2013 | 2014 | 2015 |
|---|---|---|---|---|---|---|---|---|
| Investment in new renewable capacity (annual) (109 USD)[59] | 182 | 178 | 237 | 279 | 256 | 232 | 270 | 285 |
| Renewables power capacity (existing) (GWe) | 1,140 | 1,230 | 1,320 | 1,360 | 1,470 | 1,578 | 1,712 | 1,849 |
| Hydropower capacity (existing) (GWe) | 885 | 915 | 945 | 970 | 990 | 1,018 | 1,055 | 1,064 |
| Wind power capacity (existing) (GWe) | 121 | 159 | 198 | 238 | 283 | 319 | 370 | 433 |
| Solar PV capacity (grid-connected) (GWe) | 16 | 23 | 40 | 70 | 100 | 138 | 177 | 227 |
| Solar hot water capacity (existing) (GWth) | 130 | 160 | 185 | 232 | 255 | 373 | 406 | 435 |
| Ethanol production (annual) (109 litres) | 67 | 76 | 86 | 86 | 83 | 87 | 94 | 98 |
| Biodiesel production (annual) (109 litres) | 12 | 17.8 | 18.5 | 21.4 | 22.5 | 26 | 29.7 | 30 |
| Countries with policy targets for renewable energy use | 79 | 89 | 98 | 118 | 138 | 144 | 164 | 173 |
| Source: The Renewable Energy Policy Network for the 21st Century (REN21)–Global Status Report[60][61][62][63][64] | ||||||||
| 2000 | 2010 | 2013 | |
|---|---|---|---|
| North-America | 1,973 | 2,237 | 2,443 |
| EU | 1,204 | 2,093 | 2,428 |
| Russia | 245 | 239 | 271 |
| China | 2,613 | 3,374 | 3,847 |
| Asia (-China) | 4,147 | 4,996 | 5,361 |
| Africa | 2,966 | 3,930 | 4,304 |
| Latin America | 1 502 | 2,127 | 2,242 |
| Other | 567 | 670 | 738 |
| Total renewable | 15,237 | 19,711 | 21,685 |
| Total energy | 116,958 | 148,736 | 157,485 |
| Share | 13.0% | 13.3% | 13.8% |
| Total nonrenewable | 101,721 | 129,025 | 135,800 |
From 2000 to 2013 the total renewable energy use has increased 6,450 TWh and total energy use 40,500 TWh.
Hydro
Hydroelectricity is the term referring to electricity generated by hydropower; the production of electrical power through the use of the kinetic energy of falling or flowing water. In 2015 hydropower generated 16.6% of the world's total electricity and 70% of all renewable electricity,[66] which continues the rapid rate of increase experienced between 2003 and 2009.[67] Hydropower is produced in 150 countries, with the Asia-Pacific region generating 32 percent of global hydropower in 2010. China is the largest hydroelectricity producer, with 2,600 PJ (721 TWh) of production in 2010, representing around 17% of domestic electricity use. There are now three hydroelectricity plants larger than 10 GW: the Three Gorges Dam in China, Itaipu Dam in Brazil, and Guri Dam in Venezuela.[67] Nine of the worlds top 10 renewable electricity producers are primarily hydroelectric, one is wind.
Marine energy
Marine energy, also known as ocean energy and marine and hydrokinetic energy (MHK) includes tidal and wave power and is a relatively new sector of renewable energy, with most projects still in the pilot phase, but the theoretical potential is equivalent to 4–18 million tonne of oil equivalent (toe). MHK development in U.S. and international waters includes projects using devices such as, wave energy converters in open coastal areas with significant waves, tidal turbines placed in coastal and estuarine areas, in-stream turbines in fast-moving rivers, ocean current turbines in areas of strong marine currents, and ocean thermal energy converters in deep tropical waters.[68]
Wind
Wind power is growing at the rate of 17% annually, with a worldwide installed capacity of 432,883 megawatts (MW) at the end of 2015,[69][70][71] and is widely used in Europe, Asia, and the United States.[72][73] Several countries have achieved relatively high levels of wind power penetration, such as 21% of stationary electricity production in Denmark,[74] 18% in Portugal,[74] 16% in Spain,[74] 14% in Ireland[75] and 9% in Germany in 2010.[74][76] As of 2011, 83 countries around the world are using wind power on a commercial basis.[76] Continuing strong growth, by 2016 wind generated 3% of global power annually.[77]
Solar
Solar energy, radiant light and heat from the sun, has been harnessed by humans since ancient times using a range of ever-evolving technologies. Solar energy technologies include solar heating, solar photovoltaics, concentrated solar power and solar architecture, which can make considerable contributions to solving some of the most urgent problems the world now faces. The International Energy Agency projected that solar power could provide "a third of the global final energy demand after 2060, while CO2 emissions would be reduced to very low levels."[78] Solar technologies are broadly characterized as either passive solar or active solar depending on the way they capture, convert and distribute solar energy. Active solar techniques include the use of photovoltaic systems and solar thermal collectors to harness the energy. Passive solar techniques include orienting a building to the Sun, selecting materials with favorable thermal mass or light dispersing properties, and designing spaces that naturally circulate air. From 2012 to 2016 solar capacity tripled and now provides 1.3% of global energy.[79]
Geothermal
Geothermal energy is used commercially in over 70 countries.[80] In 2004, 200 petajoules (56 TWh) of electricity was generated from geothermal resources, and an additional 270 petajoules (75 TWh) of geothermal energy was used directly, mostly for space heating. In 2007, the world had a global capacity for 10 GW of electricity generation and an additional 28 GW of direct heating, including extraction by geothermal heat pumps.[81][82] Heat pumps are small and widely distributed, so estimates of their total capacity are uncertain and range up to 100 GW.[80]
Bio energy
Until the beginning of the nineteenth century biomass was the predominant fuel, today it has only a small share of the overall energy supply. Electricity produced from biomass sources was estimated at 44 GW for 2005. Biomass electricity generation increased by over 100% in Germany, Hungary, the Netherlands, Poland, and Spain. A further 220 GW was used for heating (in 2004), bringing the total energy consumed from biomass to around 264 GW. The use of biomass fires for cooking is excluded.[81] World production of bioethanol increased by 8% in 2005 to reach 33 gigalitres (8.7×10⁹ US gal), with most of the increase in the United States, bringing it level to the levels of consumption in Brazil.[81] Biodiesel increased by 85% to 3.9 gigalitres (1.0×10⁹ US gal), making it the fastest growing renewable energy source in 2005. Over 50% is produced in Germany.[81]
By country
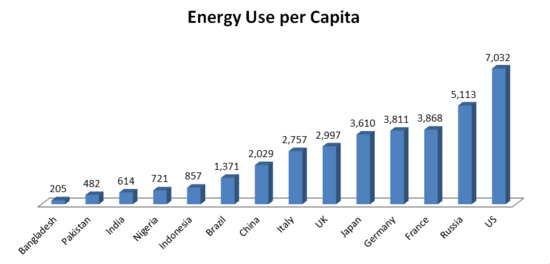
Energy consumption is loosely correlated with gross national product and climate, but there is a large difference even between the most highly developed countries, such as Japan and Germany with an energy consumption rate of 6 kW per person and the United States with an energy consumption rate of 11.4 kW per person. In developing countries, particularly those that are sub-tropical or tropical such as India, the per person energy use rate is closer to 0.7 kW. Bangladesh has the lowest consumption rate with 0.2 kW per person.
The US consumes 25% of the world's energy with a share of global GDP at 22% and a share of the world population at 4.59%.[83] The most significant growth of energy consumption is currently taking place in China, which has been growing at 5.5% per year over the last 25 years. Its population of 1.3 billion people (19.6% of the world population[83]) is consuming energy at a rate of 1.6 kW per person.
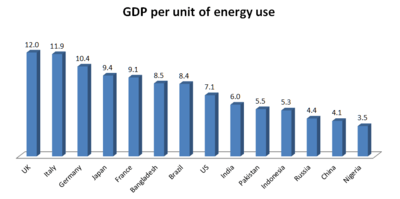
One measurement of efficiency is energy intensity. This is a measure of the amount of energy it takes a country to produce a dollar of gross domestic product.
Oil
Saudi Arabia, Russia and the United States accounted for 34% of oil production in 2011. Saudi Arabia, Russia and Nigeria accounted for 36% of oil export in 2011.
| Rank | Nation | 2005 | 2008 | 2009 | 2010 | 2011 | Share % 2011 |
2012 |
|---|---|---|---|---|---|---|---|---|
| 1 | Saudi Arabia | 519 | 509 | 452 | 471 | 517 | 12.9% | 544 |
| 2 | Russia | 470 | 485 | 494 | 502 | 510 | 12.7% | 520 |
| 3 | United States | 307 | 300 | 320 | 336 | 346 | 8.6% | 387 |
| 4 | Iran | 205 | 214 | 206 | 227 | 215 | 5.4% | 186 |
| 5 | China | 183 | 190 | 194 | 200 | 203 | 5.1% | 206 |
| 6 | Canada | 143 | 155 | 152 | 159 | 169 | 4.2% | 182 |
| 7 | UAE | nd | 136 | 120 | 129 | 149 | 3.7% | 163 |
| 8 | Venezuela | 162 | 137 | 126 | 149 | 148 | 3.7% | 162 |
| 9 | Mexico | 188 | 159 | 146 | 144 | 144 | 3.6% | nd |
| 10 | Nigeria | 133 | nd | nd | 130 | 139 | 3.5% | nd |
| x | Kuwait | nd | 145 | 124 | nd | nd | nd | 152 |
| x | Iraq | nd | nd | 114 | 140 | nd | nd | 148 |
| x | Norway | 139 | nd | nd | nd | nd | nd | nd |
| Total | 3,923 | 3,941 | 3,843 | 3,973 | 4,011 | 100% | ||
| Top ten | 62% | 62% | 61% | 62% | 63% | |||
| Rank | Nation | 2011 | Share % 2011 |
2012 |
|---|---|---|---|---|
| 1 | Saudi Arabia | 333 | 17.0% | |
| 2 | Russia | 246 | 12.5% | |
| 3 | Nigeria | 129 | 6.6% | |
| 4 | Iran | 126 | 6.4% | |
| 5 | UAE | 105 | 5.4% | |
| 6 | Iraq | 94 | 4.8% | |
| 7 | Venezuela | 87 | 4.4% | |
| 8 | Angola | 84 | 4.3% | |
| 9 | Norway | 78 | 4.0% | |
| 10 | Mexico | 71 | 3.6% | |
| x | Others | 609 | 31.0% | |
| Total (Mt) | 1,962 | |||
Coal
| Rank | Nation | 2005 | 2008 | 2009 | 2010 | 2011 | Share % 2011 |
2012 |
|---|---|---|---|---|---|---|---|---|
| 1 | China | 2,226 | 2,761 | 2,971 | 3,162 | 3,576 | 46% | 3,549 |
| 2 | US | 1,028 | 1,076 | 985 | 997 | 1,004 | 13% | 935 |
| 3 | India | 430 | 521 | 561 | 571 | 586 | 8% | 595 |
| 4 | Australia | 372 | 397 | 399 | 420 | 414 | 5% | 421 |
| 5 | Indonesia | 318 | 284 | 301 | 336 | 376 | 5% | 443 |
| 6 | Russia | 222 | 323 | 297 | 324 | 334 | 4% | 354 |
| 7 | South Africa | 315 | 236 | 247 | 255 | 253 | 3% | 259 |
| 8 | Germany | nd | nd | nd | nd | 189 | 2% | 197 |
| 9 | Poland | 160 | 144 | 135 | 134 | 139 | 2% | 144 |
| 10 | Kazakhstan | 79 | 108 | 101 | 111 | 117 | 2% | 126 |
| 11 | Colombia | 65 | 79 | 73 | 74 | 1% | nd | nd |
| Total | 5,878 | 6,796 | 6,903 | 7,229 | 7,783 | 100% | 7,831 | |
| Top ten | 89% | 87% | 88% | 88% | nd | 90% | ||
| *include hard coal and brown coal | ||||||||
| Rank | Nation | 2005 | 2008 | 2009 | 2010 | 2011 | |
|---|---|---|---|---|---|---|---|
| 1 | China | 25 | nd | 114 | 157 | 177 | |
| 2 | Japan | 178 | 186 | 165 | 187 | 175 | |
| 3 | South Korea | 77 | 100 | 103 | 119 | 129 | |
| 4 | India | 37 | 58 | 66 | 88 | 101 | |
| 5 | Taiwan | 61 | 66 | 60 | 63 | 66 | |
| 6 | Germany | 38 | 46 | 38 | 45 | 41 | |
| 7 | UK | 44 | 43 | 38 | 26 | 32 | |
| 8 | Turkey | nd | 19 | 20 | 27 | 24 | |
| 9 | Italy | 24 | 25 | 19 | 22 | 23 | |
| 10 | Malaysia | nd | nd | nd | 19 | 21 | |
| x | Spain | 25 | 19 | 16 | nd | nd | |
| x | France | nd | 21 | nd | nd | nd | |
| x | US | 28 | nd | nd | nd | nd | |
| Total | 778 | 778 | 819 | 949 | 1,002 | ||
| Top ten | 69% | 75% | 78% | 79% | 79% | ||
| Import of production | 16% | 13% | 14% | 15% | 13% | ||
| *2005–2010 hard coal | |||||||
Natural gas
| Rank | Nation | 2005 | 2008 | 2009 | 2010 | 2011 | Share % 2011 |
|---|---|---|---|---|---|---|---|
| 1 | Russia | 627 | 657 | 589 | 637 | 677 | 20.0% |
| 2 | US | 517 | 583 | 594 | 613 | 651 | 19.2% |
| 3 | Canada | 187 | 175 | 159 | 160 | 160 | 4.7% |
| 4 | Qatar | nd | 79 | 89 | 121 | 151 | 4.5% |
| 5 | Iran | 84 | 121 | 144 | 145 | 149 | 4.4% |
| 6 | Norway | 90 | 103 | 106 | 107 | 106 | 3.1% |
| 7 | China | nd | 76 | 90 | 97 | 103 | 3.0% |
| 8 | Saudi Arabia | 70 | nd | nd | 82 | 92 | 2.7% |
| 9 | Indonesia | 77 | 77 | 76 | 88 | 92 | 2.7% |
| 10 | Netherlands | 79 | 85 | 79 | 89 | 81 | 2.4% |
| x | Algeria | 93 | 82 | 81 | nd | nd | nd |
| x | UK | 93 | nd | nd | nd | nd | nd |
| Total | 2,872 | 3,149 | 3,101 | 3,282 | 100% | 3,388 | |
| Top ten | 67% | 65% | 65% | 65% | 67% | ||
| bcm = billion cubic meters | |||||||
| Rank | Nation | 2005 | 2008 | 2009 | 2010 | 2011 | Share % 2011 |
|---|---|---|---|---|---|---|---|
| 1 | Japan | 81 | 95 | 93 | 99 | 116 | 13.9% |
| 2 | Italy | 73 | 77 | 69 | 75 | 70 | 8.4% |
| 3 | Germany | 91 | 79 | 83 | 83 | 68 | 8.2% |
| 4 | US | 121 | 84 | 76 | 74 | 55 | 6.6% |
| 5 | South Korea | 29 | 36 | 33 | 43 | 47 | 5.6% |
| 6 | Ukraine | 62 | 53 | 38 | 37 | 44 | 5.3% |
| 7 | Turkey | 27 | 36 | 35 | 37 | 43 | 5.2% |
| 8 | France | 47 | 44 | 45 | 46 | 41 | 4.9% |
| 9 | UK | nd | 26 | 29 | 37 | 37 | 4.4% |
| 10 | Spain | 33 | 39 | 34 | 36 | 34 | 4.1% |
| x | Netherlands | 23 | nd | nd | nd | nd | nd |
| Total | 838 | 783 | 749 | 820 | 834 | 100% | |
| Top ten | 70% | 73% | 71% | 69% | 67% | ||
| Import of production | 29% | 25% | 24% | 25% | 25% | ||
| bcm = billion cubic meters | |||||||
Wind power
| Country | Windpower capacity (MW) ǂprovisional |
% world total |
|---|---|---|
| China | 62,733ǂ | 26.3 |
| United States | 46,919 | 19.7 |
| Germany | 29,060 | 12.2 |
| Spain | 21,674 | 9.1 |
| India | 16,084 | 6.7 |
| France | 6,800ǂ | 2.8 |
| Italy | 6,747 | 2.8 |
| United Kingdom | 6,540 | 2.7 |
| Canada | 5,265 | 2.2 |
| Portugal | 4,083 | 1.7 |
| (rest of world) | 32,446 | 13.8 |
| World total | 238,351 MW | 100% |
| Country | Windpower production (TWh) |
% world total |
|---|---|---|
| United States | 95.2 | 27.6 |
| China | 55.5 | 15.9 |
| Spain | 43.7 | 12.7 |
| Germany | 36.5 | 10.6 |
| India | 20.6 | 6.0 |
| United Kingdom | 10.2 | 3.0 |
| France | 9.7 | 2.8 |
| Portugal | 9.1 | 2.6 |
| Italy | 8.4 | 2.5 |
| Canada | 8.0 | 2.3 |
| (rest of world) | 48.5 | 14.1 |
| World total | 344.8 TWh | 100% |
By sector
| Sector | 1015Btu | Petawatt-hours | percentage | |
|---|---|---|---|---|
| Residential | 53.0 | 15.5 | 13 | |
| Commercial | 29.3 | 8.6 | 7 | |
| Industrial | 222.3 | 65.1 | 54 | |
| Transportation | 104.2 | 30.5 | 26 | |
| Total* | 408.9 | 119.8 | 100 | |
| Source: US DOE. PWh from 0.293 times Btu column. Numbers are the end use of energy | ||||
The table to the right shows the amounts of energy consumed worldwide in 2012 by four sectors, according to the Energy Information Administration of the US Department of Energy:
- Residential (heating, lighting, and appliances)
- Commercial (lighting, heating and cooling of commercial buildings, and provision of water and sewer services)
- Industrial users (agriculture, mining, manufacturing, and construction)
- Transportation (passenger, freight, and pipeline)
Of the total 120 PWh (120×1015 Wh) consumed, 19.4 were in the form of electricity, but this electricity required 61.7 PWh to produce. Thus the total energy consumption was around 160 PWh (ca 550×1015 Btu).[88] The efficiency of a typical existing power plant is around 38%.[89] The new generation of gas-fired plants reaches a substantially higher efficiency of 55%. Coal is the most common fuel for the world's electricity plants.[90]
Another report gives different values for the sectors, apparently due to different definitions. According to this, total world energy use per sector in 2008 was industry 28%, transport 27% and residential and service 36%. Division was about the same in the year 2000.[91]
| Year | 2000 | 2008 | 2000 | 2008 |
|---|---|---|---|---|
| Sector | TWh | %* | ||
| Industry | 21,733 | 27,273 | 26.5 | 27.8 |
| Transport | 22,563 | 26,742 | 27.5 | 27.3 |
| Residential and service | 30,555 | 35,319 | 37.3 | 36.0 |
| Non-energy use | 7,119 | 8,688 | 8.7 | 8.9 |
| Total* | 81,970 | 98,022 | 100 | 100 |
| Source: IEA 2010, Total is calculated from the given sectors Numbers are the end use of energy Total world energy supply (2008) 143,851 TWh | ||||
European Union
The European Environmental Agency (EEA) measures final energy consumption (does not include energy used in production and lost in transportation) and finds that the transport sector is responsible for 31.8% of final energy consumption, households 26.2%, industry 25.6%, services 13.5% and agriculture 2.9% in 2012.[92] The use of energy is responsible for the majority of greenhouse gas emissions (79%), with the energy sector representing 31%, transport 19%, industry 13%, households 9% and others 7%.[93]
While efficient energy use and resource efficiency are growing as public policy issues, more than 70% of coal plants in the European Union are more than 20 years old and operate at an efficiency level of between 32–40%.[94] Technological developments in the 1990s have allowed efficiencies in the range of 40–45% at newer plants.[94] However, according to an impact assessment by the European Commission, this is still below the best available technological (BAT) efficiency levels of 46–49%.[94] With gas-fired power plants the average efficiency is 52% compared to 58–59% with best available technology (BAT), and gas and oil boiler plants operate at average 36% efficiency (BAT delivers 47%).[94] According to that same impact assessment by the European Commission, raising the efficiency of all new plants and the majority of existing plants, through the setting of authorisation and permit conditions, to an average generation efficiency of 51.5% in 2020 would lead to a reduction in annual consumption of 15 km3 (3.6 cu mi) of natural gas and 25 Mt (25,000,000 long tons; 28,000,000 short tons) of coal.[94]
See also
- Comparisons of life-cycle greenhouse gas emissions
- Cubic mile of oil
- Domestic Energy Consumption
- Earth's energy budget
- Electricity generation
- Electric energy consumption
- Energy development
- Energy intensity
- Energy policy
- Environmental impact of aviation
- Energy security and renewable technology
- Environmental tariff
- Feed-in Tariff
- Kardashev scale
- Peak oil
- Renewable energy commercialization
- Renewable energy by country
- Sustainable energy
- A Thousand Barrels a Second: The Coming Oil Break Point and the Challenges Facing an Energy Dependent World (book)
- World Energy Outlook
- Regional
- Energy by country
- European countries by fossil fuel use (% of total energy)
- European countries by electricity consumption per person
- Energy use and conservation in the United Kingdom
- Energy use in the United States
- Asian brown cloud
- Making Sweden an Oil-Free Society
- Lists
- List of countries by carbon dioxide emissions
- List of countries by electricity consumption
- List of countries by electricity production
- List of countries by energy consumption and production
- List of countries by energy consumption per capita
- List of countries by energy intensity
- List of countries by greenhouse gas emissions
- List of countries by renewable electricity production
References
- 1 2 3 4 BP: Statistical Review of World Energy, Workbook (xlsx), London, 2016
- ↑ Statistical Review of World Energy (June 2016)
- 1 2 3 "IEA - Key world energy statistics, 2015" (PDF). Retrieved 6 April 2017.
- 1 2 3 World Energy Assessment (WEA). UNDP, United Nations Department of Economic and Social Affairs, World Energy Council, New York
- ↑ Nathalie Desbrosses, World Energy Expenditures, Leonardo Energy, Nov. 28 2011 (accessed 30 January 2015)
- ↑ "2012 Key World Energy Statistics" (PDF). www.iea.org. IEA. 2012. pp. 6, 24, 28. Archived (PDF) from the original on 1 July 2015.
- 1 2 "2013 Key World Energy Statistics" (PDF). www.iea.org. IEA. 2013. pp. 6, 24, 26, 28. Archived (PDF) from the original on 5 May 2015.
- 1 2 "2014 Key World Energy Statistics" (PDF). www.iea.org. IEA. 2014. pp. 6, 38. Archived (PDF) from the original on 5 May 2015.
- ↑ "Key World Energy Statistics" (PDF). 2017-05-28. pp. 27, 37.
- 1 2 "Key World Energy Statistics" (PDF). IEA. 2017-05-28. p. 38.
- 1 2 "Key World Energy Statistics" (PDF). IEA. September 2017. p. 7 (TPES), 36 (TFC, total final consumption). Retrieved 2018-09-05.
- ↑ "International Energy Outlook 2017" (PDF). EIA. 2017-09-14. p. 10.
- 1 2 3 "IEA - Key world energy statistics, 2016" (PDF). Retrieved 6 April 2017.
- ↑ "Electricity - Installed generating capacity, 2014". Retrieved 6 April 2017.
- ↑ http://www.shell.com/energy-and-innovation/the-energy-future/scenarios/shell-scenarios-energy-models/world-energy-model/_jcr_content/par/textimage.stream/1510344160326/d62f12b8fe88e85dc3349c38b1ca5e44cc22c5ccc6f70beed634020cfb527c82/shell-world-energy-model.pdf pg4
- ↑ Nakićenović, Nebojša; Grübler, Arnulf; McDonald, Alan (1998). Global energy: perspectives. Cambridge, New York: Cambridge University Press. ISBN 0521642000.
- ↑ "International Energy Statistics". Energy Information Administration. Retrieved 5 June 2013.
- ↑ "World Energy Intensity: Total Primary Energy Consumption per Dollar of Gross Domestic Product using Purchasing Power Parities, 1980–2004". Energy Information Administration, U.S. Department of Energy. 23 August 2006. Archived from the original (XLS) on 6 February 2007. Retrieved 3 April 2007.
- ↑ "Historical Statistics of Japan". Japan Ministry of Internal Affairs and Communications. Retrieved 3 April 2007.
- ↑ "Sluggish growth of World energy demand in 2011".
- 1 2 "Consumption by fuel, 1965–2008". Statistical Review of World Energy 2009. BP. 8 June 2009. Archived from the original (XLS) on 26 July 2013. Retrieved 24 October 2009.
- ↑ "International Energy Statistics". Missing or empty
|url=(help);|access-date=requires|url=(help) - ↑ "World Energy Statistics – Energy Supply & Demand". Enerdata.
- ↑ IEA Key energy statistics 2010 and IEA Key energy statistics 2009 oil page 11, gas p.13, hard coal (excluding brown coal) p. 15 and electricity p. 27
- ↑ Schreiber, William (May–June 2007). "Solving the Energy Problem". MIT Faculty Newsletter. Retrieved 2016-09-10.
- ↑ "IEA estimates $48tn investments till 2035 to meet global energy demands". Bloomberg News. Retrieved 4 June 2014.
- ↑ IEA World Energy Outlook 2012 Executive Summary
- ↑ Table 55, Regional energy use, 1990 and 2008 (p. 48), in "Energy in Sweden — facts and figures 2010" (PDF). Swedish Energy Agency. Archived from the original (PDF) on 14 October 2013. (see also Energy in Sweden 2011), data from IEA Energy Balances of Non-OECD countries 2010.
- ↑ "IEA Key energy statistics 2010" (PDF). IEA. 2010. p. 48. Archived from the original (PDF) on 1 March 2012.
- ↑ Energiläget 2050 by prof. Cristian Azar and Kristian Lindgren Chalmers Göteborg (in Swedish)
- ↑ State of the world 2009, Worldwatch Institute
- 1 2 "WHO - 7 million premature deaths annually linked to air pollution".
- ↑ "Ambient (outdoor) air quality and health". WHO.
- ↑ "WHO - Household air pollution and health".
- ↑ http://www.pfpi.net/wp-content/uploads/2011/04/PFPI-biomass-carbon-accounting-overview_April.pdf
- 1 2 Table 52 Global supply of coal, 1990–2009 (pp. 44-45), in "Energy in Sweden — facts and figures 2010" (PDF). Swedish Energy Agency. Archived from the original (PDF) on 14 October 2013. (see also Energy in Sweden 2011), data from IEA Energy Balances of Non-OECD countries 2010.
- ↑ Ma, Damien. "China's Coming Decade of Natural Gas". Asia's Uncertain LNG Future, NBR Special Report. November 2013. Retrieved 8 August 2014.
- ↑ Key statistics 2012, 2010 and 2006 IEA
- ↑ The True Cost of Coal 27 November 2008 pp. 66–69
- ↑ Key statistics 2012 IEA
- 1 2 Energiläget 2011 Archived 1 April 2012 at the Wayback Machine.
- 1 2 3 IEA Key World Energy Statistics 2013, 2012, 2011, 2010, 2009, 2006 IEA October, crude oil p. 11, coal p. 13, gas p. 15
- ↑ Yergin, p. 792
- ↑ "Key World Energy Statistics" (PDF). International Energy Agency. 2006. Retrieved 3 April 2007. pp. 48–57
- ↑ Yergin, p. ?
- ↑ How Much Oil Have We Used?, Science Daily, 8 May 2009. Retrieved March 2014.
- 1 2 Table 50 Global supply of gas 1990–2009 (p. 44), in "Energy in Sweden — facts and figures 2010" (PDF). Swedish Energy Agency. Archived from the original (PDF) on 14 October 2013. (see also Energy in Sweden 2011), data from IEA Energy Balances of Non-OECD countries 2010.
- ↑ World Nuclear Association, (July 1, 2016) , www.world-nuclear.org
- ↑ Trevor Findlay (2010). The Future of Nuclear Energy to 2030 and its Implications for Safety, Security and Nonproliferation: Overview Archived 12 May 2013 at the Wayback Machine., The Centre for International Governance Innovation (CIGI), Waterloo, Ontario, Canada, pp. 10–11.
- ↑ Mycle Schneider, Steve Thomas, Antony Froggatt, and Doug Koplow (August 2009). The World Nuclear Industry Status Report 2009 Archived 24 April 2011 at the Wayback Machine. Commissioned by German Federal Ministry of Environment, Nature Conservation and Reactor Safety, p. 5.
- ↑ Ipsos 2011, p. 3
- ↑ "The myth of renewable energy". Bulletin of the Atomic Scientists. 2011-11-22. Retrieved 2013-10-03.
- ↑ REN21 (2010). Renewables 2010 Global Status Report p. 15.
- ↑ REN21 (2014). "Renewables 2014: Global Status Report" (PDF). pp. 13, 17, 21, 25. Archived from the original (PDF) on 4 September 2014.
- ↑ International Energy Agency (2012). "Energy Technology Perspectives 2012" (PDF).
- ↑ "Global Trends in Sustainable Energy Investment 2007: Analysis of Trends and Issues in the Financing of Renewable Energy and Energy Efficiency in OECD and Developing Countries" (PDF). www.unep.org. United Nations Environment Programme. 2007. p. 3. Archived (PDF) from the original on 13 October 2014. Retrieved 13 October 2014.
- ↑ REN21 (2013). "Renewables global futures report 2013" (PDF).
- ↑ "Electricity generation: very different capacity factors!". 21 September 2015.
- ↑ http://www.ren21.net/wp-content/uploads/2015/06/GSR2015_Figure25.jpg
- ↑ REN21 (2011). "Renewables 2011: Global Status Report" (PDF). p. 15.
- ↑ REN21 (2012). Renewables Global Status Report 2012 Archived 15 December 2012 at the Wayback Machine. p. 17.
- ↑ "REN21 2013 Renewables Global Status Report" (PDF). Retrieved 30 January 2014.
- ↑ REN21. "Renewables 2014: Global Status Report" (PDF). Archived (PDF) from the original on 4 September 2014. Retrieved 20 January 2015.
- ↑ http://www.ren21.net/wp-content/uploads/2015/07/REN12-GSR2015_Onlinebook_low1.pdf
- ↑ Energiläget i siffror 2016 Energimyndigheten Sweden (See Renewable energy 12.3 Total energy 12.1)
- ↑ http://www.ren21.net/wp-content/uploads/2016/06/GSR_2016_Full_Report_REN21.pdf
- 1 2 "Use and Capacity of Global Hydropower Increases". Worldwatch Institute. January 2012.
- ↑ "Tethys".
- ↑ Global Wind Energy Council. "GWEC Global Statistics".
- ↑ Lars Kroldrup. Gains in Global Wind Capacity Reported Green Inc., 15 February 2010.
- ↑ REN21 (2011). "Renewables 2011: Global Status Report" (PDF). p. 15.
- ↑ Global wind energy markets continue to boom – 2006 another record year Archived 7 April 2011 at the Wayback Machine. (PDF).
- ↑ Beattie, David (18 March 2011). "Wind Power: China Picks Up Pace". Renewable Energy World.
- 1 2 3 4 "World Wind Energy Report 2010" (PDF). Report. World Wind Energy Association. February 2011. Archived from the original (PDF) on 4 September 2011. Retrieved 30 April 2011.
- ↑ "Renewables". eirgrid.com. Archived from the original on 25 August 2011. Retrieved 22 November 2010.
- 1 2 REN21 (2011). "Renewables 2011: Global Status Report" (PDF). p. 11.
- ↑ http://www.bp.com/en/global/corporate/energy-economics/statistical-review-of-world-energy/renewable-energy/wind-energy.html
- ↑ http://www.iea.org/Textbase/npsum/solar2011SUM.pdf
- ↑ http://www.bp.com/en/global/corporate/energy-economics/statistical-review-of-world-energy/renewable-energy/solar-energy.html
- 1 2 "The Future of Geothermal Energy" (PDF). MIT. Archived from the original (PDF) on 10 March 2011. Retrieved 7 February 2007.
- 1 2 3 4 "Renewables, Global Status Report 2006" (PDF). Renewable Energy Policy Network for the 21st century. 2006. Archived from the original (PDF) on 18 July 2011. Retrieved 3 April 2007.
- ↑ Fridleifsson,, Ingvar B.; Bertani, Ruggero; Huenges, Ernst; Lund, John W.; Ragnarsson, Arni; Rybach, Ladislaus (11 February 2008). O. Hohmeyer and T. Trittin, ed. "The possible role and contribution of geothermal energy to the mitigation of climate change" (PDF). Luebeck, Germany: 59–80. Archived from the original (pdf) on 22 July 2011. Retrieved 6 April 2009.
- 1 2 "World Population Prospects". United Nations. Archived from the original on 21 March 2007. Retrieved 7 February 2011.
- 1 2 3 IEA Key World Energy Statistics 2012, 2011, 2010, 2009, 2006 IEA October, crude oil p. 11, coal p. 13 gas p. 15
- ↑ IEA Key World Energy Statistics 2011, 2010, 2009, 2006 IEA October, crude oil p. 11, coal p. 13, gas p. 15
- ↑ "GWEC Global Wind Statistics 2011" (PDF). Global Wind Energy Commission. Retrieved 15 March 2012.
- ↑ "Worldwide Electricity Production From Renewable Energy Sources: Stats and Figures Series: Thirteenth Inventory – Edition 2011" (PDF). 2.2 Electricity Production From Wind Sources: Main Wind Power Producing Countries – 2010 (text & table): Observ'ER. Retrieved 29 March 2012.
- 1 2 Table F1 of "International Energy Outlook 2016" (PDF). United States Department of Energy, Washington, DC. Archived from the original on 27 July 2017.
- ↑ "Energy efficiency measures and technological improvements". e8.org. Archived from the original on 4 February 2007. Retrieved 21 January 2007. Article by group of ten leading electricity companies
- ↑ "Coal Facts 2006 Edition" (PDF). World Coal Institute. September 2006. Archived from the original (PDF) on 2016-05-17. Retrieved 8 April 2007.
- 1 2 Table 56, Total world energy use per sector 1990–2008 (pp. 48-49), in "Energy in Sweden — facts and figures 2010" (PDF). Swedish Energy Agency. Archived from the original (PDF) on 14 October 2013. (see also Energy in Sweden 2011), data from IEA Energy Balances of Non-OECD countries 2010.
- ↑ European Environmental Agency. "Final energy consumption by sector and fuel (CSI 027/ENER 016) - Assessment published Jan 2015". Retrieved 21 June 2015.
- ↑ Eva Hoos European Commission 2011. A new Directive on Energy Efficiency. Retrieved 11 October 2011.
- 1 2 3 4 5 European Commission 2011. Impact Assessment Accompanying the document Directive of the European Parliament and of the Council on energy efficiency and amending and subsequently repealing Directives 2004/8/EC and 2006/32/EC. p. 106. Retrieved 11 October 2011.
External links
- World Energy Outlook
- BP global energy outlook to 2035
- BP Statistical Review of World Energy June 2017
- Energy Statistics and News from the European Union
- Official Energy Statistics from the US government
- Annual Energy Review, by the U.S. Department of Energy's Energy Information Administration (PDF)
- International Energy Outlook 2017, by the U.S. Energy Information Administration
| Africa | |||||
|---|---|---|---|---|---|
| Asia | |||||
| Europe |
| ||||
| North America | |||||
| Oceania | |||||
| South America | |||||
| |||||
| Major topics | |
|---|---|
| Biological and related topics | |
| Human impact on the environment | |
| Literature |
|
| Publications | |
| Lists | |
Events and organizations | |
| Related topics | |
| |
| Aspects |
| ||||
|---|---|---|---|---|---|
| Issues |
| ||||
| Theories | |||||
| Notable scholars |
| ||||
| |||||