List of countries by iron ore production
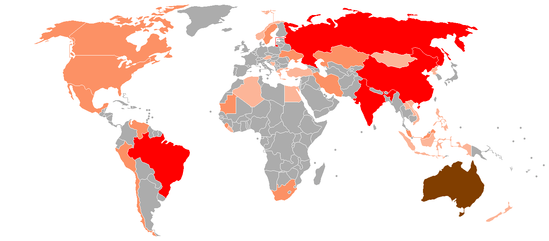
World iron ore production (thousands of tonnes) in 2013/2015:
500,000+
100,000–500,000
10,000–99,999
1,000–9,999
0–999
This is a list of countries by iron ore production based on U.S. Geological Survey data.[1] The mine production estimates for China are estimated from the National Bureau of Statistics China's crude ore statistics, rather than usable ore as reported for the other countries.[2]
List
| Rank | Country | Usable iron ore production (thousand tonnes) | Year |
|---|---|---|---|
| World | 2,280,000 | 2015 | |
| 1 | 817,000 | 2015 | |
| 2 | 397,000 | 2015 | |
| 3 | 375,000 (estimate) | 2015 | |
| 4 | 156,000 | 2015 | |
| 5 | 101,000 | 2015 | |
| 6 | 73,000 | 2015 | |
| 7 | 67,000 | 2015 | |
| 8 | 46,000 | 2015 | |
| 9 | 46,000 | 2015 | |
| 10 | 27,000 | 2015 | |
| 11 | 25,000 | 2015 | |
| 12 | 21,000 | 2015 | |
| 13 | 18,840 | 2013 | |
| 14 | 17,109 | 2013 | |
| 15 | 16,800 | 2013 | |
| 16 | 13,400 | 2013 | |
| 17 | 11,895 | 2013 | |
| 18 | 11,588 | 2013 | |
| 19 | 10,126 | 2013 | |
| 20 | 8,589 | 2013 | |
| 21 | 6,736 | 2013 | |
| 22 | 5,103 | 2013 | |
| 23 | 4,708 | 2013 | |
| 24 | 4,000 | 2013 | |
| 25 | 3,409 | 2013 | |
| 26 | 3,320 | 2013 | |
| 27 | 3,157 | 2013 | |
| 28 | 3,054 | 2013 | |
| 29 | 2,320 | 2013 | |
| 30 | 2,221 | 2013 | |
| 31 | 2,122 | 2013 | |
| 32 | 1,459 | 2013 | |
| 33 | 1,067 | 2013 | |
| 34 | 1,057 | 2013 | |
| 35 | 710 | 2013 | |
| 36 | 663 | 2013 | |
| 37 | 334 | 2013 | |
| 38 | 301 | 2013 | |
| 39 | 244 | 2013 | |
| 40 | 193 | 2013 | |
| 41 | 141 | 2013 | |
| other countries | 147 | 2013 | |
Pig iron production
This is a list of countries by pig iron production.
| Rank | Country | 1980 | 2013 | 2015 |
|---|---|---|---|---|
| World | 506 | 1,168 | 1,180 | |
| 1 | 38 | 709 | 710 | |
| 2 | 87 | 84 | 84 | |
| 3 | 8.5 | 50 | 54 | |
| 4 | n/a | 50 | 51 | |
| 5 | 5.6 | 41 | 47 | |
| 6 | 13 | 26 | 30 | |
| 7 | 36 | 27 | 28 | |
| 8 | 62 | 30 | 26 | |
| 9 | n/a | 29 | 25 | |
| 10 | 6.2 | 9.4 | 9 | |
| other countries | 246 | 91 | 101 | |
See also
References
- 1 2 "Mineral Commodity Summaries 2017" (PDF). U.S. Geological Survey. Retrieved 2017-08-21.
- 1 2 "Global iron ore production data; Clarification of reporting from the USGS" (PDF). U.S. Geological Survey. Retrieved 2017-08-21.
- ↑ USGS, Iron Ore 2014
- ↑ "World Steel Production 1980-2013" (PDF). World Steel Association. Nov 2014. Archived from the original (PDF) on 20 April 2015. Retrieved 4 April 2015.
- ↑ USGS 2016
This article is issued from
Wikipedia.
The text is licensed under Creative Commons - Attribution - Sharealike.
Additional terms may apply for the media files.