Linlithgowshire (UK Parliament constituency)
| Linlithgowshire | |
|---|---|
|
Former County constituency for the House of Commons | |
| Subdivisions of Scotland | Linlithgowshire |
| 1708–1950 | |
| Number of members | One |
| Replaced by | West Lothian |
Linlithgowshire was a county constituency of the House of Commons of the Parliament of the United Kingdom from 1708 to 1950. It elected one Member of Parliament (MP) by the first past the post voting system.
For the 1950 general election, the constituency was renamed West Lothian.
Members of Parliament
| Election | Member | Party | |
|---|---|---|---|
| 1708 | Lord Johnstone | ||
| 1708 | John Houston | ||
| 1713 | Sir James Carmichael | ||
| 1714 | John Houston | ||
| 1715 | Sir James Cunynghame | ||
| 1722 | George Dundas [1] | ||
| 1727 | Alexander Hamilton | ||
| 1741 | George Dundas | ||
| 1743 | Charles Hope-Weir | ||
| 1768 | John Hope | ||
| 1770 | James Dundas | ||
| 1774 | Sir William Cunynghame | ||
| 1790 | John Hope | Tory[2] | |
| 1800 | Sir Alexander Hope | Tory[2][3] | |
| 1834 | Conservative[2][3] | ||
| 1835 | James Hope | Conservative[2][3] | |
| 1838 | Charles Hope | Conservative[2][3] | |
| 1845 | William Baillie | Conservative[3] | |
| 1847 | George Dundas | Conservative[3] | |
| Feb. 1859 | Charles Baillie | Conservative[3] | |
| May 1859 | Walter Ferrier Hamilton | Liberal[3] | |
| 1865 | Peter McLagan | Liberal[3] | |
| 1893 | Thomas Hope | Conservative | |
| 1895 | Alexander Ure | Liberal | |
| 1913 | John Pratt | Liberal | |
| 1918 | James Kidd | Coalition Conservative | |
| 1922 | Manny Shinwell | Labour | |
| 1924 | James Kidd | Unionist | |
| 1928 | Manny Shinwell | Labour | |
| 1931 | Sir Adrian Baillie | Unionist | |
| 1935 | George Mathers | Labour | |
| 1950 | constituency abolished | ||
Election results
Elections in the 1850s
| Party | Candidate | Votes | % | ± | |
|---|---|---|---|---|---|
| Conservative | George Dundas | Unopposed | |||
| Registered electors | 502 | ||||
| Conservative hold | |||||
| Party | Candidate | Votes | % | ± | |
|---|---|---|---|---|---|
| Conservative | George Dundas | Unopposed | |||
| Registered electors | 427 | ||||
| Conservative hold | |||||
Dundas resigned upon his appointment as Lieutenant Governor of Prince Edward Island, causing a by-election.
| Party | Candidate | Votes | % | ± | |
|---|---|---|---|---|---|
| Conservative | Charles Baillie | Unopposed | |||
| Conservative hold | |||||
| Party | Candidate | Votes | % | ± | |
|---|---|---|---|---|---|
| Liberal | Walter Ferrier Hamilton | Unopposed | |||
| Registered electors | 425 | ||||
| Liberal gain from Conservative | |||||
Elections in the 1860s
| Party | Candidate | Votes | % | ± | |
|---|---|---|---|---|---|
| Liberal | Peter McLagan | Unopposed | |||
| Registered electors | 813 | ||||
| Liberal hold | |||||
| Party | Candidate | Votes | % | ± | |
|---|---|---|---|---|---|
| Liberal | Peter McLagan | 600 | 60.9 | N/A | |
| Liberal | John Pender[4] | 385 | 39.1 | N/A | |
| Majority | 215 | 21.8 | N/A | ||
| Turnout | 985 | 80.3 | N/A | ||
| Registered electors | 1,226 | ||||
| Liberal hold | |||||
Elections in the 1870s
| Party | Candidate | Votes | % | ± | |
|---|---|---|---|---|---|
| Liberal | Peter McLagan | Unopposed | |||
| Registered electors | 1,198 | ||||
| Liberal hold | |||||
Elections in the 1880s
| Party | Candidate | Votes | % | ± | |
|---|---|---|---|---|---|
| Liberal | Peter McLagan | 747 | 74.5 | N/A | |
| Conservative | James Robertson | 256 | 25.5 | N/A | |
| Majority | 491 | 49.0 | N/A | ||
| Turnout | 1,003 | 81.4 | N/A | ||
| Registered electors | 1,232 | ||||
| Liberal hold | Swing | N/A | |||
| Party | Candidate | Votes | % | ± | |
|---|---|---|---|---|---|
| Liberal | Peter McLagan | 3,801 | 70.3 | −4.2 | |
| Conservative | Thomas Hope | 1,606 | 29.7 | +4.2 | |
| Majority | 2,195 | 40.6 | −8.4 | ||
| Turnout | 5,407 | 79.4 | −2.0 | ||
| Registered electors | 6,808 | ||||
| Liberal hold | Swing | −4.2 | |||
| Party | Candidate | Votes | % | ± | |
|---|---|---|---|---|---|
| Liberal | Peter McLagan | 2,543 | 58.4 | −11.9 | |
| Conservative | Thomas Hope | 1,810 | 41.6 | +11.9 | |
| Majority | 733 | 16.8 | −23.8 | ||
| Turnout | 4,353 | 63.9 | −15.5 | ||
| Registered electors | 6,808 | ||||
| Liberal hold | Swing | −11.9 | |||
Elections in the 1890s
| Party | Candidate | Votes | % | ± | |
|---|---|---|---|---|---|
| Liberal | Peter McLagan | 2,870 | 51.4 | −7.0 | |
| Conservative | Thomas Hope | 2,709 | 48.6 | +7.0 | |
| Majority | 161 | 2.8 | −14.0 | ||
| Turnout | 5,579 | 79.2 | +15.3 | ||
| Registered electors | 7,042 | ||||
| Liberal hold | Swing | −7.0 | |||
| Party | Candidate | Votes | % | ± | |
|---|---|---|---|---|---|
| Conservative | Thomas Hope | 3,240 | 51.3 | +2.7 | |
| Liberal | Alexander Ure | 3,071 | 48.7 | −2.7 | |
| Majority | 169 | 2.6 | N/A | ||
| Turnout | 6,311 | 86.3 | +7.1 | ||
| Registered electors | 7,315 | ||||
| Conservative gain from Liberal | Swing | +2.7 | |||
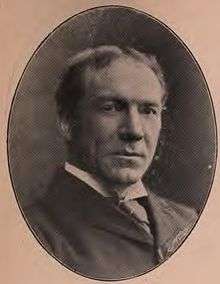
Ure
| Party | Candidate | Votes | % | ± | |
|---|---|---|---|---|---|
| Liberal | Alexander Ure | 3,760 | 54.4 | +3.0 | |
| Conservative | Thomas Hope | 3,153 | 45.6 | −3.0 | |
| Majority | 607 | 8.8 | +6.0 | ||
| Turnout | 6,913 | 88.4 | +9.2 | ||
| Registered electors | 7,823 | ||||
| Liberal hold | Swing | +3.0 | |||
Elections in the 1900s
| Party | Candidate | Votes | % | ± | |
|---|---|---|---|---|---|
| Liberal | Alexander Ure | 3,827 | 55.8 | +1.4 | |
| Conservative | David Dundas | 3,034 | 44.2 | −1.4 | |
| Majority | 793 | 11.6 | +2.8 | ||
| Turnout | 6,861 | 81.2 | −7.2 | ||
| Registered electors | 8,450 | ||||
| Liberal hold | Swing | +1.4 | |||
Ure
| Party | Candidate | Votes | % | ± | |
|---|---|---|---|---|---|
| Liberal | Alexander Ure | 5,282 | 65.7 | +9.9 | |
| Conservative | Patrick Rose-Innes | 2,761 | 34.3 | −9.9 | |
| Majority | 2,521 | 31.4 | +19.8 | ||
| Turnout | 8,043 | 78.1 | −3.1 | ||
| Registered electors | 10,301 | ||||
| Liberal hold | Swing | +9.9 | |||
Elections in the 1910s
| Party | Candidate | Votes | % | ± | |
|---|---|---|---|---|---|
| Liberal | Alexander Ure | 6,451 | 64.6 | −1.1 | |
| Liberal Unionist | William Charles Smith | 3,536 | 35.4 | +1.1 | |
| Majority | 2,915 | 29.2 | −2.2 | ||
| Turnout | 9,987 | 84.6 | +6.5 | ||
| Registered electors | 11,810 | ||||
| Liberal hold | Swing | −1.1 | |||
| Party | Candidate | Votes | % | ± | |
|---|---|---|---|---|---|
| Liberal | Alexander Ure | 5,835 | 60.8 | −3.8 | |
| Conservative | James Kidd | 3,765 | 39.2 | +3.8 | |
| Majority | 2,070 | 21.6 | −7.6 | ||
| Turnout | 9,600 | 81.1 | −3.5 | ||
| Registered electors | 11,840 | ||||
| Liberal hold | Swing | −3.8 | |||
| Party | Candidate | Votes | % | ± | |
|---|---|---|---|---|---|
| Liberal | John Pratt | 5,615 | 52.4 | −8.4 | |
| Unionist | James Kidd | 5,094 | 47.6 | +8.4 | |
| Majority | 521 | 4.8 | −16.8 | ||
| Turnout | 10,709 | 87.8 | +6.7 | ||
| Registered electors | 12,193 | ||||
| Liberal hold | Swing | −8.4 | |||
General Election 1914/15:
Another General Election was required to take place before the end of 1915. The political parties had been making preparations for an election to take place and by the July 1914, the following candidates had been selected;
- Liberal: John Pratt
- Unionist: James Kidd
- Labour: (George Dallas ?)
| Party | Candidate | Votes | % | ± | |
|---|---|---|---|---|---|
| C | Unionist | James Kidd | 12,898 | 59.7 | +20.5 |
| Labour | Manny Shinwell | 8,723 | 40.3 | N/A | |
| Majority | 4,175 | 19.4 | N/A | ||
| Turnout | 21,621 | 66.4 | −14.7 | ||
| Registered electors | 32,562 | ||||
| Unionist gain from Liberal | Swing | ||||
| C indicates candidate endorsed by the coalition government. | |||||
Elections in the 1920s
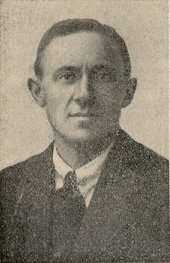
Shinwell
| Party | Candidate | Votes | % | ± | |
|---|---|---|---|---|---|
| Labour | Manny Shinwell | 12,625 | 46.4 | +6.1 | |
| Unionist | James Kidd | 8,993 | 33.0 | −29.7 | |
| Liberal | John Fraser Orr | 5,605 | 20.6 | N/A | |
| Majority | 3,632 | 13.4 | N/A | ||
| Turnout | 27,223 | 76.5 | +9.1 | ||
| Registered electors | 35,582 | ||||
| Labour gain from Unionist | Swing | +17.9 | |||
| Party | Candidate | Votes | % | ± | |
|---|---|---|---|---|---|
| Labour | Manny Shinwell | 13,304 | 50.9 | +4.5 | |
| Unionist | James Kidd | 8,149 | 31.2 | −1.8 | |
| Liberal | James Johnston | 4,691 | 17.9 | −2.7 | |
| Majority | 5,155 | 19.7 | +6.3 | ||
| Turnout | 26,144 | 71.7 | −4.8 | ||
| Registered electors | 36,459 | ||||
| Labour hold | Swing | +3.2 | |||
| Party | Candidate | Votes | % | ± | |
|---|---|---|---|---|---|
| Unionist | James Kidd | 14,765 | 51.1 | +19.9 | |
| Labour | Manny Shinwell | 14,123 | 48.9 | −2.0 | |
| Majority | 642 | 2.2 | N/A | ||
| Turnout | 28,888 | 80.0 | +8.3 | ||
| Registered electors | 36,122 | ||||
| Unionist gain from Labour | Swing | +11.0 | |||
| Party | Candidate | Votes | % | ± | |
|---|---|---|---|---|---|
| Labour | Manny Shinwell | 14,446 | 49.1 | +0.2 | |
| Unionist | Margaret Kidd | 9,268 | 31.5 | −19.6 | |
| Liberal | Douglas Young | 5,690 | 19.4 | N/A | |
| Majority | 5,178 | 17.6 | N/A | ||
| Turnout | 29,044 | 81.5 | +1.5 | ||
| Registered electors | 36,082 | ||||
| Labour gain from Unionist | Swing | +9.9 | |||
| Party | Candidate | Votes | % | ± | |
|---|---|---|---|---|---|
| Labour | Manny Shinwell | 18,063 | 51.6 | +2.7 | |
| Unionist | Adrian Baillie | 11,241 | 32.1 | −19.0 | |
| Liberal | John Fraser Orr | 5,722 | 16.3 | N/A | |
| Majority | 6,822 | 19.5 | N/A | ||
| Turnout | 35,026 | 77.9 | −3.6 | ||
| Registered electors | 44,962 | ||||
| Labour gain from Unionist | Swing | +10.9 | |||
Elections in the 1930s
| Party | Candidate | Votes | % | ± | |
|---|---|---|---|---|---|
| Unionist | Adrian Baillie | 20,476 | 54.7 | +22.6 | |
| Labour | Manny Shinwell | 16,956 | 45.3 | −6.3 | |
| Majority | 3,520 | 9.4 | N/A | ||
| Turnout | 37,432 | 82.1 | +4.2 | ||
| Registered electors | 45,612 | ||||
| Unionist gain from Labour | Swing | +14.5 | |||
| Party | Candidate | Votes | % | ± | |
|---|---|---|---|---|---|
| Labour | George Mathers | 20,905 | 54.1 | +8.8 | |
| Unionist | Adrian Baillie | 17,730 | 45.9 | −8.8 | |
| Majority | 3,175 | 8.2 | N/A | ||
| Turnout | 38,635 | 80.8 | −1.3 | ||
| Registered electors | 47,813 | ||||
| Labour gain from Unionist | Swing | +8.8 | |||
Election in the 1940s
| Party | Candidate | Votes | % | ± | |
|---|---|---|---|---|---|
| Labour | George Mathers | 24,762 | 64.1 | +10.0 | |
| Unionist | Rupert Speir | 13,871 | 35.9 | −10.0 | |
| Majority | 10,891 | 28.2 | +20.0 | ||
| Turnout | 38,633 | 73.2 | −7.6 | ||
| Registered electors | 52,752 | ||||
| Labour hold | Swing | +10.0 | |||
References
- ↑ "DUNDAS, George (1690-1762), of Dundas, Linlithgow". historyofparliamentonline.org. Retrieved 4 October 2018.
- 1 2 3 4 5 Smith, Henry Stooks (1842). The Register of Parliamentary Contested Elections (Second ed.). Simpkin, Marshall & Company. p. 207. Retrieved 14 September 2018 – via Google Books.
- 1 2 3 4 5 6 7 8 9 10 11 12 13 14 15 16 17 Craig, F. W. S., ed. (1977). British Parliamentary Election Results 1832-1885 (e-book)
|format=requires|url=(help) (1st ed.). London: Macmillan Press. ISBN 978-1-349-02349-3. - ↑ "The New Parliament". Manchester Courier and Lancashire General Advertiser. 26 November 1868. p. 6. Retrieved 25 February 2018 – via British Newspaper Archive. (Subscription required (help)).
- 1 2 3 4 5 6 7 8 9 10 British Parliamentary Election Results 1885-1918, FWS Craig
- 1 2 3 4 5 6 7 The Liberal Year Book, 1907
- ↑ Debrett's House of Commons & Judicial Bench, 1886
- ↑ Debrett's House of Commons & Judicial Bench, 1901
- ↑ Debrett's House of Commons & Judicial Bench, 1901
- ↑ Debrett's House of Commons & Judicial Bench, 1916
- ↑ Debrett's House of Commons & Judicial Bench, 1916
- ↑ Debrett's House of Commons and the Judicial Bench, 1916
- ↑ Whitaker's Almanack, 1920
- ↑ The Times, 17 November 1922
- ↑ The Times, 8 December 1923
- ↑ Oliver & Boyd's Edinburgh Almanac, 1927
- ↑ The Times, 7 April 1928
- ↑ The Times, 1 June 1929
- ↑ Whitaker's Almanack, 1934
- ↑ Whitaker's Almanack, 1939
This article is issued from
Wikipedia.
The text is licensed under Creative Commons - Attribution - Sharealike.
Additional terms may apply for the media files.