Morley and Rothwell (UK Parliament constituency)
Coordinates: 53°44′56″N 1°36′07″W / 53.749°N 1.602°W
| Morley and Rothwell | |
|---|---|
|
Former Borough constituency for the House of Commons | |
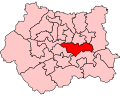 Boundary of Morley and Rothwell in West Yorkshire for the 2005 general election. | |
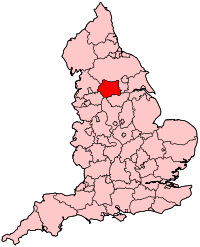 Location of West Yorkshire within England. | |
| County | West Yorkshire |
| Major settlements | Morley, Rothwell, Middleton |
| 1997–2010 | |
| Number of members | One |
| Replaced by | Elmet and Rothwell, Morley and Outwood, Leeds Central |
| Created from | Morley and Leeds South |
Morley and Rothwell was a parliamentary constituency represented in the House of Commons of the Parliament of the United Kingdom. It elected one Member of Parliament (MP) by the first past the post system of election.
History
This constituency was created in 1997 and abolished in 2010. It was held for the entire period of its existence by the Labour Party.
Boundaries
The City of Leeds wards of Middleton, Morley North, Morley South, and Rothwell.
The constituency covered the West Yorkshire towns of Morley and Rothwell, the villages that surround the towns, and the old pit village of Middleton.
Boundary review
Following their review of parliamentary representation in West Yorkshire, the Boundary Commission for England have created a number of modified constituencies as a consequence of a falling population.
A new constituency of Elmet and Rothwell has been created to move Rothwell from this seat. The successor seat to Morley and Rothwell is Morley and Outwood, which attaches wards from Wakefield to the Morley area. Middleton is being transferred to the Leeds Central seat.
Members of Parliament
| Election | Member [1] | Party | |
|---|---|---|---|
| 1997 | John Gunnell | Labour | |
| 2001 | Colin Challen | Labour | |
| 2010 | Constituency abolished: see Morley and Outwood, Elmet and Rothwell and Leeds Central | ||
Elections
| Party | Candidate | Votes | % | ± | |
|---|---|---|---|---|---|
| Labour | John Gunnell | 26,836 | 58.5 | N/A | |
| Conservative | Alan Barraclough | 12,086 | 26.3 | N/A | |
| Liberal Democrat | Mitchell Galdas | 5,087 | 11.1 | N/A | |
| Referendum | David Mitchell-Innes | 1,359 | 3.0 | N/A | |
| BNP | Roger Wood | 381 | 0.8 | N/A | |
| ProLife Alliance | Pat Sammon | 148 | 0.3 | N/A | |
| Majority | 14,750 | 32.2 | N/A | ||
| Turnout | 45,897 | 67.1 | N/A | ||
| Labour win (new seat) | |||||
| Party | Candidate | Votes | % | ± | |
|---|---|---|---|---|---|
| Labour | Colin Challen | 21,919 | 57.0 | −1.5 | |
| Conservative | David Schofield | 9,829 | 25.6 | −0.8 | |
| Liberal Democrat | Stewart Golton | 5,446 | 14.2 | +3.1 | |
| UKIP | John Bardsley | 1,248 | 3.2 | N/A | |
| Majority | 12,090 | 31.4 | |||
| Turnout | 38,442 | 53.5 | −13.5 | ||
| Labour hold | Swing | ||||
| Party | Candidate | Votes | % | ± | |
|---|---|---|---|---|---|
| Labour | Colin Challen | 20,570 | 48.4 | −8.6 | |
| Conservative | Nick Vineall | 8,227 | 19.4 | −6.2 | |
| Liberal Democrat | Stewart Golton | 6,819 | 16.0 | +1.8 | |
| Independent | Robert Finnigan | 4,608 | 10.8 | N/A | |
| BNP | Chris Beverley | 2,271 | 5.3 | N/A | |
| Majority | 12,343 | 29.0 | |||
| Turnout | 42,495 | 58.8 | +5.3 | ||
| Labour hold | Swing | ||||
See also
Notes and references
- ↑ Leigh Rayment's Historical List of MPs – Constituencies beginning with "M" (part 3)
- ↑ "Election Data 1997". Electoral Calculus. Archived from the original on 15 October 2011. Retrieved 18 October 2015.
- ↑ "Election Data 2001". Electoral Calculus. Archived from the original on 15 October 2011. Retrieved 18 October 2015.
- ↑ "Election Data 2005". Electoral Calculus. Archived from the original on 15 October 2011. Retrieved 18 October 2015.