Hypergeometric distribution
|
Probability mass function 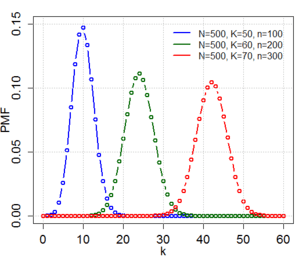 | |
|
Cumulative distribution function  | |
| Parameters | |
|---|---|
| Support | |
| pmf | |
| CDF | where is the generalized hypergeometric function |
| Mean | |
| Mode | , |
| Variance | |
| Skewness | |
| Ex. kurtosis |
|
| MGF | |
| CF | |


![{\displaystyle 1-{{{n \choose {k+1}}{{N-n} \choose {K-k-1}}} \over {N \choose K}}\,_{3}F_{2}\!\!\left[{\begin{array}{c}1,\ k+1-K,\ k+1-n\\k+2,\ N+k+2-K-n\end{array}};1\right],}](../I/m/556153b7446bc4321c995b2d8f9cc2957a0df452.svg)


![{\frac {(N-2K)(N-1)^{\frac {1}{2}}(N-2n)}{[nK(N-K)(N-n)]^{\frac {1}{2}}(N-2)}}](../I/m/f9ec1b0c28225251fa3fd794e30bffc3eb34315e.svg)


![{\displaystyle {}+6nK(N-K)(N-n)(5N-6){\Big ]}}](../I/m/046f280d3e6c514b12a25ec51c9159874d811f39.svg)


In probability theory and statistics, the hypergeometric distribution is a discrete probability distribution that describes the probability of successes (random draws for which the object drawn has a specified feature) in draws, without replacement, from a finite population of size that contains exactly objects with that feature, wherein each draw is either a success or a failure. In contrast, the binomial distribution describes the probability of successes in draws with replacement.


In statistics, the hypergeometric test uses the hypergeometric distribution to calculate the statistical significance of having drawn a specific successes (out of total draws) from the aforementioned population. The test is often used to identify which sub-populations are over- or under-represented in a sample. This test has a wide range of applications. For example, a marketing group could use the test to understand their customer base by testing a set of known customers for over-representation of various demographic subgroups (e.g., women, people under 30).
Definition
The following conditions characterize the hypergeometric distribution:
- The result of each draw (the elements of the population being sampled) can be classified into one of two mutually exclusive categories (e.g. Pass/Fail or Employed/Unemployed).
- The probability of a success changes on each draw, as each draw decreases the population (sampling without replacement from a finite population).
A random variable follows the hypergeometric distribution if its probability mass function (pmf) is given by[1]


where
- is the population size,
- is the number of success states in the population,
- is the number of draws (i.e. quantity drawn in each trial),
- is the number of observed successes,
- is a binomial coefficient.

The pmf is positive when .

A random variable distributed hypergeometrically with parameters , and is written and has probability mass function above.


Combinatorial identities
As required, we have

which essentially follows from Vandermonde's identity from combinatorics.
Also note that

which follows from the symmetry of the problem, but it can also be shown by expressing the binomial coefficients in terms of factorials and rearranging the latter.
Application and example
The classical application of the hypergeometric distribution is sampling without replacement. Think of an urn with two types of marbles, red ones and green ones. Define drawing a green marble as a success and drawing a red marble as a failure (analogous to the binomial distribution). If the variable N describes the number of all marbles in the urn (see contingency table below) and K describes the number of green marbles, then N − K corresponds to the number of red marbles. In this example, X is the random variable whose outcome is k, the number of green marbles actually drawn in the experiment. This situation is illustrated by the following contingency table:
| drawn | not drawn | total | |
|---|---|---|---|
| green marbles | k | K − k | K |
| red marbles | n − k | N + k − n − K | N − K |
| total | n | N − n | N |
Now, assume (for example) that there are 5 green and 45 red marbles in the urn. Standing next to the urn, you close your eyes and draw 10 marbles without replacement. What is the probability that exactly 4 of the 10 are green? Note that although we are looking at success/failure, the data are not accurately modeled by the binomial distribution, because the probability of success on each trial is not the same, as the size of the remaining population changes as we remove each marble.
This problem is summarized by the following contingency table:
| drawn | not drawn | total | |
|---|---|---|---|
| green marbles | k = 4 | K − k = 1 | K = 5 |
| red marbles | n − k = 6 | N + k − n − K = 39 | N − K = 45 |
| total | n = 10 | N − n = 40 | N = 50 |
The probability of drawing exactly k green marbles can be calculated by the formula

Hence, in this example calculate

Intuitively we would expect it to be even more unlikely that all 5 green marbles will be among the 10 drawn.

As expected, the probability of drawing 5 green marbles is roughly 35 times less likely than that of drawing 4.
Application to auditing elections

Election audits typically test a sample of machine-counted precincts to see if recounts by hand or machine match the original counts. Mismatches result in either a report or a larger recount. The sampling rates are usually defined by law, not statistical design, so for a legally defined sample size n, what is the probability of missing a problem which is present in K precincts, such as a hack or bug? This is the probability that k = 0. Bugs are often obscure, and a hacker can minimize detection by affecting only a few precincts, which will still affect close elections, so a plausible scenario is for K to be on the order of 5% of N. Audits typically cover 1% to 10% of precincts (often 3%),[2][3] so they have a high chance of missing a problem. For example if a problem is present in 5 of 100 precincts, a 3% sample has 86% probability that k = 0 so the problem would not be noticed, and only 14% probability of the problem appearing in the sample (positive k):
![{\displaystyle {\begin{aligned}\Pr(X=0)&={\frac {{\binom {\text{Hack}}{0}}{\binom {N-{\text{Hack}}}{n-0}}}{\binom {N}{n}}}={\frac {\binom {N-{\text{Hack}}}{n}}{\binom {N}{n}}}={\frac {\frac {(N-{\text{Hack}})!}{n!(N-{\text{Hack}}-n)!}}{\frac {N!}{n!(N-n)!}}}={\frac {\frac {(N-{\text{Hack}})!}{(N-{\text{Hack}}-n)!}}{\frac {N!}{(N-n)!}}}\\[8pt]&={\frac {\binom {100-5}{3}}{\binom {100}{3}}}={\frac {\frac {(100-5)!}{(100-5-3)!}}{\frac {100!}{(100-3)!}}}={\frac {\frac {95!}{92!}}{\frac {100!}{97!}}}={\frac {95\times 94\times 93}{100\times 99\times 98}}=86\%\end{aligned}}}](../I/m/9e813969bd02392b97eccaa83cd16fcf15359981.svg)
The sample would need 45 precincts in order to have probability under 5% that k = 0 in the sample, and thus have probability over 95% of finding the problem:

Application to Texas hold'em poker
In hold'em poker players make the best hand they can combining the two cards in their hand with the 5 cards (community cards) eventually turned up on the table. The deck has 52 and there are 13 of each suit.
For this example assume a player has 2 clubs in the hand and there are 3 cards showing on the table, 2 of which are also clubs. The player would like to know the probability of one of the next 2 cards to be shown being a club to complete the flush.
(Note that the probability calculated in this example assumes no information is known about the cards in the other players' hands; however, experienced poker players may consider how the other players place their bets (check, call, raise, or fold) in considering the probability for each scenario. Strictly speaking, the approach to calculating success probabilities outlined here is accurate in a scenario where there is just one player at the table; in a multiplayer game this probability might be adjusted somewhat based on the betting play of the opponents.)
There are 4 clubs showing so there are 9 still unseen. There are 5 cards showing (2 in the hand and 3 on the table) so there are still unseen.

The probability that one of the next two cards turned is a club can be calculated using hypergeometric with and . (about 31.6%)


The probability that both of the next two cards turned are clubs can be calculated using hypergeometric with and . (about 3.3%)

The probability that neither of the next two cards turned are clubs can be calculated using hypergeometric with and . (about 65.0%)

Symmetries
Swapping the roles of green and red marbles:

Swapping the roles of drawn and not drawn marbles:

Swapping the roles of green and drawn marbles:

Hypergeometric test
The hypergeometric test uses the hypergeometric distribution to measure the statistical significance of having drawn a sample consisting of a specific number of successes (out of total draws) from a population of size containing successes. In a test for over-representation of successes in the sample, the hypergeometric p-value is calculated as the probability of randomly drawing or more successes from the population in total draws. In a test for under-representation, the p-value is the probability of randomly drawing or fewer successes.
Relationship to Fisher's exact test
The test based on the hypergeometric distribution (hypergeometric test) is identical to the corresponding one-tailed version of Fisher's exact test[4] ). Reciprocally, the p-value of a two-sided Fisher's exact test can be calculated as the sum of two appropriate hypergeometric tests (for more information see[5] ).
Order of draws
The probability of drawing any set of green and red marbles (the hypergeometric distribution) depends only on the numbers of green and red marbles, not on the order in which they appear; i.e., it is an exchangeable distribution. As a result, the probability of drawing a green marble in the draw is[6]


This is an ex ante probability—that is, it is based on not knowing the results of the previous draws.
Related distributions
Let and .


- If then has a Bernoulli distribution with parameter .
- Let have a binomial distribution with parameters and ; this models the number of successes in the analogous sampling problem with replacement. If and are large compared to , and is not close to 0 or 1, then and have similar distributions, i.e., .
- If is large, and are large compared to , and is not close to 0 or 1, then


where is the standard normal distribution function

- If the probabilities of drawing a green or red marble are not equal (e.g. because green marbles are bigger/easier to grasp than red marbles) then has a noncentral hypergeometric distribution
- The beta-binomial distribution is a conjugate prior for the hypergeometric distribution.
The following table describes four distributions related to the number of successes in a sequence of draws:
| With replacements | No replacements | |
|---|---|---|
| Given number of draws | binomial distribution | hypergeometric distribution |
| Given number of failures | negative binomial distribution | negative hypergeometric distribution |
Tail bounds
Let and . Then we can derive the following bounds:[7]
![{\displaystyle {\begin{aligned}\Pr[X\leq (p-t)n]&\leq e^{-n{\text{D}}(p-t\parallel p)}\leq e^{-2t^{2}n}\\\Pr[X\geq (p+t)n]&\leq e^{-n{\text{D}}(p+t\parallel p)}\leq e^{-2t^{2}n}\\\end{aligned}}\!}](../I/m/c1592b043d16fd6179f3a95d97a3c38806d82cea.svg)
where

is the Kullback-Leibler divergence and it is used that .[8]

If n is larger than N/2, it can be useful to apply symmetry to "invert" the bounds, which give you the following: [8] [9]
![{\displaystyle {\begin{aligned}\Pr[X\leq (p-t)n]&\leq e^{-(N-n){\text{D}}(p+{\tfrac {tn}{N-n}}||p)}\leq e^{-2t^{2}n{\tfrac {n}{N-n}}}\\\\\Pr[X\geq (p+t)n]&\leq e^{-(N-n){\text{D}}(p-{\tfrac {tn}{N-n}}||p)}\leq e^{-2t^{2}n{\tfrac {n}{N-n}}}\\\end{aligned}}\!}](../I/m/a0fd3b1453cac4e9cd1a15a032c154bbb93b7ec4.svg)
Multivariate hypergeometric distribution
| Parameters |
|
|---|---|
| Support | |
| pmf | |
| Mean | |
| Variance |
|


The model of an urn with green and red marbles can be extended to the case where there are more than two colors of marbles. If there are Ki marbles of color i in the urn and you take n marbles at random without replacement, then the number of marbles of each color in the sample (k1,k2,...,kc) has the multivariate hypergeometric distribution. This has the same relationship to the multinomial distribution that the hypergeometric distribution has to the binomial distribution—the multinomial distribution is the "with-replacement" distribution and the multivariate hypergeometric is the "without-replacement" distribution.
The properties of this distribution are given in the adjacent table, where c is the number of different colors and is the total number of marbles.
Example
Suppose there are 5 black, 10 white, and 15 red marbles in an urn. If six marbles are chosen without replacement, the probability that exactly two of each color are chosen is

See also
Notes
- ↑ Rice, John A. (2007). Mathematical Statistics and Data Analysis (Third ed.). Duxbury Press. p. 42.
- ↑ "State Audit Laws". Verified Voting. 2017-02-10. Retrieved 2018-04-02.
- ↑ National Conference of State Legislatures. "Post-Election Audits". www.ncsl.org. Retrieved 2018-04-02.
- ↑ Rivals, I.; Personnaz, L.; Taing, L.; Potier, M.-C (2007). "Enrichment or depletion of a GO category within a class of genes: which test?". Bioinformatics. 23 (4): 401–407. doi:10.1093/bioinformatics/btl633. PMID 17182697.
- ↑ K. Preacher and N. Briggs. "Calculation for Fisher's Exact Test: An interactive calculation tool for Fisher's exact probability test for 2 x 2 tables (interactive page)".
- ↑ http://www.stat.yale.edu/~pollard/Courses/600.spring2010/Handouts/Symmetry%5BPolyaUrn%5D.pdf
- ↑ Hoeffding, Wassily (1963), "Probability inequalities for sums of bounded random variables", Journal of the American Statistical Association, 58 (301): 13–30, doi:10.2307/2282952 .
- 1 2 "Another Tail of the Hypergeometric Distribution". wordpress.com. 8 December 2015. Retrieved 19 March 2018.
- ↑ Serfling, Robert (1974), "Probability inequalities for the sum in sampling without replacement", The Annals of Statistics: 39–48 .
References
- Berkopec, Aleš (2007). "HyperQuick algorithm for discrete hypergeometric distribution". Journal of Discrete Algorithms. 5 (2): 341. doi:10.1016/j.jda.2006.01.001.
- Skala, M. (2011). "Hypergeometric tail inequalities: ending the insanity" (PDF). unpublished note