Genetic studies on Croats
Population genetics is a scientific discipline which contributes to the examination of the human evolutionary and historical migrations. Particularly useful information is provided by the research of two uniparental markers within our genome, the Y-chromosome (Y-DNA) and mitochondrial DNA (mtDNA).[1] The studied data suggests that around 3/4 of the contemporary Croatian male individuals are the descendants of Old Europeans who came here before and after the Last Glacial Maximum (LGM), while the rest of the population from those who arrived in the last 10,000 years, mostly during the Neolithic period.[1] The contemporary Croatian female individuals have genetic diversity which fits within a broader European maternal genetic landscape.[2]
There many Paleolithic period sites located in the territory of Croatia, mostly ascribed to the Mousterian phase in the Middle Paleolithic period. In the Neolithic period in Southeast Europe were founded major cultures like Vinča, Varna, Starčevo. In the Bronze Age happened symbiosis between Proto-Indo-Europeans of Kurgan culture and autochthonous populations, leading to the formation among others also of Proto-Illyrians. They gradually mixed and were assimilated by the Romans, Celts, Avars, and finally Slavs in the 6th century. An additional significant migration happened from Bosnia and Herzegovina, an expansion which was influenced by the Ottoman Empire's conquest since the 15th century, as well by Croatian immigration prior and post world wars I&II and Croatian War of Independence.[3][2]
Y chromosome DNA
Contemporary Y-DNA
Genetically, on the paternal Y chromosome line, a majority (>85%) of male Croats from Croatia belong to one of the three major European Y-DNA haplogroups - I (38%[4][5][6]-44%[7]), R1a (27%[7]-34%[4][5][6]) and R1b (12.4%[7]-15%[4][5][6]), while a minority (>15%) mostly belongs to haplogroup E (9%[7]), and others to haplgroups J (4.4%[7]), N (2%[7]), and G (1%[7]).

Haplogroup I among Croats from Croatia is divided in two major subdivisions - subclade I2 (35%), typical for the populations of eastern Adriatic and the Balkans, and I1 (9%), typical for the populations of Scandinavia.[7] From the I2 subclade, the most prevailing is I2a1 (I-P37.2) i.e. its subclade I2a1b-M423 which is typical of the South Slavic populations of south-eastern Europe, being highest in Bosnia-Herzegovina (>50%).[6] In Croatia the highest frequency is observed in Dalmatia, peaking in cities of Dubrovnik (53%) and Zadar (60%),[8] as well southern islands of Vis (44.6%),[8] Brač and Korčula (~55%), and Hvar (65%).[7] The frequency is lower in the town of Osijek (27.6%) on the banks of the river Drava, in the western mountainous Žumberak region (18.2%),[8] and in the northern islands of Cres (3%) and Krk (27%).[7][4] The highest frequency of the haplogroup is found in Bosnian-Croats from Herzegovina (73%).[7] The subclade I1 was not found in Osijek and Bosnian Croats,[7] but peaked at 8.9% in Dubrovnik.[8] The population with haplogroup I migrated to Europe from the Middle East, approximately 25,000-13,000 years ago. It represents the Paleolithic and Mesolithic population of hunter gatherers. The subclade's I-P37.2 very high frequency in the Western Balkans diminishes in all directions.[1][8]
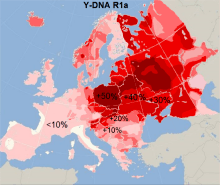
R1a1a1-M17 and Haplogroup R1b are the second (34%) and the third (15.6%) most prevailing haplogroups according to the investigation done in 2003.[4] According to the 2008 research these values are slightly smaller.[7] The haplogroup R-M17 in Croatia is mostly divided into two subclades, R-M558 (predominant) and R-M458, while R-Z282 is rare.[8] The highest frequency of R1a1a1-M17 was found in the Croats from Osijek (39%),[7] Žumberak (34.1),[8] and in the northern islands of Krk (37%) and Cres (56.5%),[4][8] being similar to the values of the other Slavs, like Slovenes, Czechs and Slovaks. The frequency is lower in Zadar (4%) and Dubrovnik (13.4%), as well on the southern islands of Hvar (8%), Vis (17%), Korčula (20%), and Brač (25%).[4][8] In Bosnian Croats, the frequency is similar to those of other South Slavs (12%).[7] The highest frequency of the haplogroup R1b, which in Croatia is divided into several subclades, was in the Croats from the island of Krk (16.2%) and Dugi Otok (25%),[4][8] in Žumberak was 11.3%,[8] while in the southern islands, city of Dubrovnik (3.9%) and in Bosnian Croats it is almost absent (1-6%),[4][7][8] or like in Osijek it was not found.[7] These two haplogroups (R1a and R1b) are connected to Proto-Indo-Europeans migration from the Eurasian area some 5,000 years ago,[1] R1a particularly to Slavic population's migration.[6][8] Their frequency show north-south gradiation and an opposite frequency distribution to the haplogroup I-P37.2,[1] and the highest frequency is observed in the northern, western and eastern Croatia.[4][7]
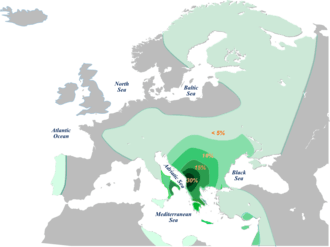
From the haplogroup E among Croats the most frequent is subclade E1b1b1a1b-V13 (6.7%), while E1b1b1a3-M149 and E1b1b1c-M123 were also found in small numbers (1.1%).[7] E-V13 it's typical of the populations of south-eastern Europe, peaking among Kosovo Albanians (44%), and is also high among the Macedonians, Greeks, Romanians, Bulgarians and Serbs.[6] The highest frequency in Croatian mainland has been found in Žumberak (18.2%)[8] and Osijek (10.3%),[7] in central islands Dugi Otok (15.9%) and Ugljan (13.2%), as well southern islands Vis (23.4%) and Mljet (15.4%).[8] In the northern islands of Cres (3%)[8] and Krk (6.8%) was similar to other southern islands (3.7-4.3%).[4] In Bosnian Croats the frequency was the same as among the Croats from Croatia (8.9%).[7] Subclades of J1 are rare in Croatia, while J2 are higher in Croats from Croatia, peaking in Croats from Osijek (10.2%) and central islands Ugljan (10.2%) and Pašman (16.6%) as well the northern island of Krk (10.8%) and Cres (14.1%),[4][7][8] than in Bosnian Croats (both 1.1%).[7] Subclade G2a-P15 both in Croatian and Bosnian Croats is found in low numbers (1.1%),[7] but peaks locally in the north-eastern town of Osijek (13.8%),[7] and the southern islands of Mljet (15.4%), Korčula (10.4%), Brač (6%) as well northern island Cres (7%).[4][8] The haplogroup E and J are related to post-LGM, Neolithic migration of a population from Anatolia who brought with them domestication of wild animals and plants. Specifically, the haplogroup E's subclade probably arose locally in the Balkan not earlier than 8,000-10,000 years ago. These haplogroups show south-north gradiation.[1] The haplogroup G could have been present in Europe during the LGM or population with some of its subclades arrived with early farmers.[1]
Haplogroup's N subclades are rare in Croatia (2.2%).[7] It is very frequent in the Far East, like Siberia and China, while in Europe in Finns (60%) and in the Baltic countries (45%). Unusually for European populations, another central Asian-Siberian haplogroup P (i.e. Q) was found in unusually high frequencies in the islands of Hvar (14%) and Korčula (6%).[4]
Prehistoric Y-DNA
In the 2014 study, of the three successfully generated SNP profiles of Neolithic Starčevo culture samples from Vinkovci, two belonged to Y-DNA haplogroup G2a-P15 and one to I2a1-P37.2, which could indicate G2a as potential representatives of the spread of farming from the Near East to Europe, while I2a as Mesolithic substratum in Europe.[9]
In the 2018 study, 10 out of 17 samples from Croatia had a successful Y-DNA sequencing; two Croatia Cardial Neolithic (6005-5786 BCE) samples from Zemunica Cave belonged to C1a2 and E1b1b1a1b1, Early-Neolithic Starčevo (5837-5659 BCE) from Beli Manastir-Popova zemlja to C, Early-Neolithic Croatia Impressa (5641-5560 BCE) from Kargadur to G2a2a1, two Middle-Neolithic Sopot (5207-4546 BCE) samples from Osijek to G2a2a1 and J2a1, Late-Neolithic Sopot (4790-4558 BCE) from Beli Manastir-Popova zemlja to I, two Vučedol (2884-2582 BCE) samples from Beli Manastir-Popova zemlja and Vucedol Tell to R1b1a1a2a2 and G2a2a1a2a, and the Early-Middle Bronze Age (1631-1521 BCE) sample from Veliki Vanik belonged to J2b2a.[10]
Abstract and data
The region of modern-day Croatia was part of a wider Balkan region which may have served as one of several refugia during the LGM, a source region for the recolonization of Europe during the post-glacial period and Holocene (10,000 years ago).[7][1] The eastern Adriatic coast was much further south.[5] The northern and the western parts of that sea were steppes and plains, while the modern Croatian islands (rich in Paleolithic archeological sites) were hills and mountains.[5][7] The region had a specific role in the structuring of European, and particularly among Slavic, paternal genetic heritage, characterized by the predominance of R1a and I, and scarcity of E lineages.[6] The contemporary insular populations genetic diversity is characterized by strong isolation and endogamy.[11]
In the table below is cited the most extensive study (2012) until now on the population in Croatia. It is a national reference DNA database of 17 loci system which acquired Y-STR haplotypes were predicted in estimated (over 90% probability) Y-SNP haplogroups.[3] The sub-populations were divided in five regions which sub-populations showed strong similarity and homogeneity of paternal genetic contribution, with exception of sub-population from southern Croatia who showed a mild difference. The sub-population from northern Croatia is closer to central European cluster (Germanic, Slavic, Hungarian), the sub-populations of eastern, western and southern Croatia are closer to southern European cluster, while the sub-population of central Croatia is positioned on the boundary between these two clusters.[3]
| Population | Samples | Source | I2a(xI2a1) | R1a | E1b1b | R1b | I1 | J2b | G2a | H | J2a1h | J1 | J2a1b | E1b1a | G2c | I2a1 | I2b1 | I2b(xI2b1) | J2a1-bh | L | N | Q | T |
|---|---|---|---|---|---|---|---|---|---|---|---|---|---|---|---|---|---|---|---|---|---|---|---|
| Overall Croatia | 1,100 | Mršić et al. (2012) | 37.7 | 22.1 | 10.6 | 7.9 | 5.8 | 3.7 | 2.7 | 1.8 | 1.2 | 1.1 | 1 | <1 | <1 | <1 | <1 | <1 | <1 | <1 | <1 | <1 | <1 |
| Central Croatia | 220 | Mršić et al. (2012) | 31.8 | 23.6 | 11.8 | 10.4 | 5 | 5 | 3.6 | 1.3 | 0.4 | 2.2 | 0.9 | 0 | 0 | 0.4 | 0.9 | 0.9 | 0 | 0.4 | 0.9 | 0 | 0 |
| North Croatia | 220 | Mršić et al. (2012) | 25.4 | 29.1 | 10.9 | 10.4 | 4.1 | 5 | 3.1 | 5 | 0.4 | 0 | 0.4 | 0.4 | 0 | 0 | 2.2 | 0.9 | 0 | 0.4 | 0.4 | 0 | 1.3 |
| East Croatia | 220 | Mršić et al. (2012) | 40 | 18.6 | 11.3 | 8.2 | 5.9 | 2.7 | 1.8 | 0.9 | 2.2 | 2.7 | 1.3 | 0 | 0 | 0 | 0.4 | 0 | 0.4 | 0 | 0.9 | 1.8 | 0.4 |
| West Croatia | 220 | Mršić et al. (2012) | 36.8 | 20 | 12.7 | 5.9 | 8.6 | 3.2 | 3.2 | 1.8 | 1.8 | 0.4 | 1.8 | 0 | 0.4 | 0 | 0.4 | 0 | 0.4 | 0 | 0.9 | 0.4 | 0.9 |
| South Croatia | 220 | Mršić et al. (2012) | 54.5 | 19.1 | 6.3 | 4.5 | 5.4 | 2.7 | 1.8 | 0.4 | 0.9 | 0 | 0.4 | 0 | 0 | 0 | 0.4 | 0 | 0.9 | 0.4 | 0 | 1.3 | 0.4 |
Mitochondrial DNA
Contemporary mtDNA
Genetically, on the maternal X chromosome line, a majority (>65%) of female Croats from Croatia (mainland and coast) belong to three of the eleven major European mtDNA haplogroups - H (45%), U (17.8-20.8%), J (3-11%), while a large minority (>35%) belongs to many other smaller haplogroups.[12]
Haplogroup H is the most frequent (45%) maternal haplogroup in Croatian mainland (continental) and coast respectively, with the highest frequency in Croatia observed in population of island Korčula (60.2%) and Mljet (73.5%),[13] while lowest frequency in islands Cres (27.7%),[14] and Hvar (27.8%).[12] It is the dominant European haplogroup.[13] The elevated frequency of subhaplogroup H1b in Mljet (30.9%), otherwise rare in other studies, is a typical example of a founder effect - migration from the nearest coastal region and micro-evolutionary expansion in the island.[13]
Haplogroup U (18.85% in 2014)[2] is mostly represented by its subclade U5 which is the second most frequenct haplogroup, with 11.6% in the mainland and 10.4% in the coast, with similar frequencies in the islands of Brač (8.6%), Krk (11.3%), and Hvar (14.8%), while lowest in Korčula (2%).[12] Overall the haplogroup U, including its subclades like U5, is the most frequent in the city of Dubrovnik (19.9%) and islands Lastovo (23.5%) and Cres (29.4%).[14][13] It is the oldest European haplogroup (coalescence age circa 50,000 YBP) and its subclade U5 makes the majority of the haplogroup diversity in Europe. The high frequency of U4 in Lastovo (11.8%) indicates founder effect.[13]
Haplogroup J is the third most frequent haplogroup, with 11.9% in the mainland but only 3.1% in the coast, however the islands had higher frequencies than the coastal population Korčula (6.1%), Brač (8.6%), Krk (9%), Hvar (9.3%),[12] peak in Žumberak (12.34%)[2] and Lastovo (19.6%),[13] while in Cres is almost totally absent.[14]
Haplogroup T's subclade T2 has similar frequency of 3.1-5.8% in both the coastal and mainland as well insular population, with exceptional peak in island Hvar (12%),[12][14] however the overall haplogroup T has lower frequency in Mljet (1.5%), Lastovo (3.9%) and Dubrovnik (2.3).[13]
Haplogroup K has average frequency of 3.6% in the mainland and 6.3% in the coast, it is absent in Lastovo[13] and it has lowest frequency in the islands Cres (3.36%)[14] and Hvar (3.7%), while highest in the island Brač (9.5%).[12]
Haplogroup V (under HV > HV0) is a younger sister clade of haplogroup H,[13] and has almost the same minimum and maximum frequency (4-5.7%) in both continental and insular populations, with exception in Korčula (8.2%),[12] as well lower freuency in Mljet (1.5%), Lastovo (2%) and Dubrovnik (3.3%).[13]
Haplogroup W frequency in the mainland and coastal population is between 2.2-4.2%, while between insular populations 1.9-3.1%, with exception in Krk (7.5%),[12] and Cres (12.6%).[14] In islands Mljet and Lastovo is between 4.4-5.9%, while in Dubrovnik is almost absent (0.6%).[13]
Other mtDNA haplogroup with notable local peaks are: HV subclades with low frequencies in the mainland and coast (0.4-2.1%) but average (4.1-4.6) in islands, and high in Dubrovnik (7.7%)[13] and Brač (10.5%).[12] Haplogroup N1a in Cres (9.24%) is the northernmost finding till now of this branch in Europe, and haplotypes indicate a relatively recent founder effect.[14] It is a characteristic haplogroup of the early farmers.[9] Haplogroup F which is almost absent (only 0.2-0.4% in the mainland), but peaks at 8.3% in Hvar.[12][2] Haplogroup I in Krk (11.3%), which subhaplogroups separated around the LGM.[15]
Medieval mtDNA
The 2011 mtDNA study on 27 early medieval skeletal remains in Naklice near Omiš in Southern Dalmatia showed that 67% belonged to haplogroup H, 18% to J, 11% to U5, and 4% to HV.[16] The 2015 mtDNA study on medieval skeletal remains in Šopot (14th-15th century) and Ostrovica (9th century) in Northern Dalmatia confirmed that profiles inherited by the maternal line differed neither between Ostrovica and Šopot site nor between medieval and modern populations, showing the same haplogroup prevalence (H, J, U) in both medieval and contemporary populations.[17] The 2014 study of a male skeleton found in Split from Late Roman Period (dated 1760±80 YBP) showed that belonged to haplogroup H.[18]
Prehistoric mtDNA
In the 2014 Y-DNA and mtDNA study, one Mesolithic sample dated 6080-6020 BCE from Vela Spila near Vela Luka on island Korčula belonged to mtDNA haplogroup U5b2a5 common in hunter-gatherer communities, while other eleven Neolithic Starčevo culture samples dated circa 6000–5400 BCE from Vinkovci were assigned haplogroups J1c, K1a, T2b, HV0, K, V, V6, which reveal similar mtDNA diversity and shared ancestry in early farming populations from the Pannonian Basin and the populations of the Central European LBK, accompanied by a reduction of the Mesolithic mtDNA substratum.[9]
Preliminary results from 2016 mtDNA study, which will approximately include 30 samples from Neolithic and 5 samples from Early to Late Bronze Age, on 5 ancient Croatian petrous bones (3 Neolithic Cardial Impresso from Zemunica Cave near Bisko, 1 Middle Neolithic Danilo culture from Zidana Cave near Staničići Žumberački, 1 Mid/Late Bronze Age from Jazinka Cave near Nečven) indicated mtDNA haplogroups K2 and K1b1a, H1e/H41, H1b for Neolithic samples similar to Early European Farmers and modern Sardinians and Southern Europeans, while haplogroup HV or H4 for Bronze Age sample similar to modern day Croatian and Balkan population, but without clear evidence for connection with the Indo-European migration.[19]
The 2018 study which included 17 samples from Croatia; Mesolithic (7308-7027 BCE) from Vela Spila to U5b2b, three Croatia Cardial Neolithic (6005-5751 BCE) samples from Zemunica Cave to H1, K1b1a and N1a1, Early-Neolithic Starčevo (5837-5659 BCE) from Beli Manastir-Popova zemlja to U8b1b1, two Early-Neolithic Croatia Impressa (5670-5560 BCE) samples from Kargadur to H5a and H7c, two Middle-Neolithic Sopot (5207-4546 BCE) samples from Osijek to U5a1a2 and H10, two Late-Neolithic Sopot (4790-4536 BCE) samples from Beli Manastir-Popova zemlja to U5b2b and N1a1, Eneolithic (3710-3360 BCE) from Radovanci to J1c2, three Vučedol (3000-2582 BCE) samples from Beli Manastir-Popova zemlja and Vucedol Tell to T2e, T2c2 and U4a, Early-Middle Bronze Age (1631-1521 BCE) from Veliki Vanik to I1a1, and the Late Bronze Age (805-761 BCE) sample from Jazinka Cave belonged to HV0e.[10]
Abstract and data
For decades the Croatian insular populations have been studied because of their isolation which can trace micro-evolutionary processes and understand evolutionary forces, like genetic drift (specific genetic expression), founder effect and population bottlenecks (reduction of population size) which shaped the contemporary population. The results until now indicate that the genetic flow and influx of women to the islands was limited.[13] A moderate genetic isolate can also be considered for the continental population of mountainous region Žumberak because they had a loose affinity with Uskoks's proposed region of origin (Bosnians, Herzegovinians, southern Croatians) or to their current closest neighbors (northern Croatians and Slovenians).[2] On the example of population of the island of Krk, the high-resoluton mtDNA analysis showed evidence that settlements Omišalj, Vrbnik, and Dobrinj are related in a joint cluster of early Slavic settlements, while Poljica and Dubašnica regions a separate cluster founded by Slavic and Romanian (called Vlachs or Morlachs) migrants from the Velebit hinterland who arrived in the 15th century.[15] On the example of population of the island of Mljet can be perceived demographic and historical events like the island's use for quarantine station, while along Vis and Lastovo consanguinity practice and inbreeding due to lack of genetic diversity, being suitable for genetic-epidemiological research.[13]
In the 2004 mtDNA analysis, one cluster was formed by populations from islands Hvar, Krk and Brač, and second cluster included Croatian mainland and Croatian coast, while the island of Korčula was distinguished due to exceptionally high frequency of haplogroup H.[12] In the 2009 mtDNA interpopulation PCA analysis of subhaplogroups, insular populations from Krk, Ugljan, Korčula, Brač, Hvar were clustered together implying to have close maternal lineages, with Vis close to them, but Cres (prevalence U2, W, N1a) and Rab (U4, H6, J1c) had separate outlying positions from both the cluster and each other.[14] In the 2014 mtDNA PCA analysis, the populations from eastern and southern Croatia clustered together with Bosnia and Herzegovina, while western and northern Croatia with Slovenia. As Slovenian population does not form Southeast Europe cluster it is considered a possible input from different migration waves of Slavs in the Middle Ages.[2]
| Population | Samples | Source | H | HV | J | T | K | U* | U1 | U2 | U3 | U4 | U5 | U6 | U7 | U8 | R | N | I | W | X | Other |
|---|---|---|---|---|---|---|---|---|---|---|---|---|---|---|---|---|---|---|---|---|---|---|
| Croatia | 488 | Šarac et al. (2014) | 45.29 | 4.07 | 9.83 | 5.98 | 4.30 | 0 | 1.23 | 2.66 | 1.43 | 2.66 | 10.06 | 0.20 | 0.41 | 0.20 | 0 | 0.82 | 2.61 | 1.84 | 1.84 | 4.29 |
| East Croatia | 61 | Šarac et al. (2014) | 49.18 | 11.48 | 9.84 | 3.28 | 4.92 | 0 | 0 | 0 | 1.64 | 1.64 | 9.84 | 0 | 0 | 0 | 0 | 1.64 | 0 | 4.92 | 1.64 | 0 |
| North Croatia | 155 | Šarac et al. (2014) | 41.77 | 5.06 | 14.56 | 10.76 | 3.16 | 0 | 0.63 | 1.90 | 0.63 | 3.16 | 11.39 | 0.63 | 0 | 0.63 | 0 | 0 | 1.27 | 2.53 | 0.63 | 0.63 |
| West Croatia | 209 | Šarac et al. (2014) | 46.41 | 11.48 | 6.70 | 2.39 | 5.74 | 0 | 2.39 | 4.31 | 1.91 | 2.39 | 6.22 | 0 | 0.96 | 0 | 0 | 0.96 | 4.78 | 0 | 2.39 | 0 |
| South Croatia | 63 | Šarac et al. (2014) | 49.21 | 3.17 | 7.94 | 9.52 | 3.17 | 0 | 0 | 1.59 | 1.59 | 3.17 | 12.70 | 0 | 0 | 0 | 0 | 1.59 | 1.59 | 1.59 | 3.17 | 0 |
Autosomal DNA
According to 2014 autosomal analysis of Western Balkan, with 20 samples from Croatia, the Croatian population shows genetic uniformity with other South Slavic populations. The Croatians and Bosnians were more close to East European populations and largely overlapped with Hungarians from Central Europe.[20]
According to 2016 whole exome sequencing of 176 individuals from the island of Vis it was confirmed isolate status of the island's population, and revealed the "pattern of loss-of-function mutations, which resembles the trails of adaptive evolution".[21]
See also
Notes
- 1 2 3 4 5 6 7 8 Primorac et al. 2011.
- 1 2 3 4 5 6 7 Šarac et al. 2014.
- 1 2 3 Mršić et al. 2012.
- 1 2 3 4 5 6 7 8 9 10 11 12 13 14 Barać et al. 2003.
- 1 2 3 4 5 Rootsi et al. 2004.
- 1 2 3 4 5 6 7 Peričić et al. 2005.
- 1 2 3 4 5 6 7 8 9 10 11 12 13 14 15 16 17 18 19 20 21 22 23 24 25 26 27 28 Battaglia et al. 2008.
- 1 2 3 4 5 6 7 8 9 10 11 12 13 14 15 16 17 18 Šarac et al. 2016.
- 1 2 3 Szécsényi-Nagy et al. 2015.
- 1 2 Mathieson et al. 2018.
- ↑ Vitart et al. 2006.
- 1 2 3 4 5 6 7 8 9 10 11 Cvjetan et al. 2004.
- 1 2 3 4 5 6 7 8 9 10 11 12 13 14 Šarac et al. 2012.
- 1 2 3 4 5 6 7 8 Jeran et al. 2009.
- 1 2 Havaš Auguštin et al. 2012.
- ↑ Ljubković et al. 2011.
- ↑ Bašić et al. 2015.
- ↑ Sutlović et al. 2014.
- ↑ Fernandes et al. 2016.
- ↑ Kovačević et al. 2014.
- ↑ Jeroncic et al. 2016.
References
- Y-DNA
- L. Barać; et al. (2003). "Y chromosomal heritage of Croatian population and its island isolates" (PDF). European Journal of Human Genetics. 11 (7): 535–42. doi:10.1038/sj.ejhg.5200992. PMID 12825075.
- S. Rootsi; et al. (2004). "Phylogeography of Y-Chromosome Haplogroup I Reveals Distinct Domains of Prehistoric Gene Flow in Europe" (PDF). American Journal of Human Genetics. 75 (1): 128–137. doi:10.1086/422196. PMC 1181996. PMID 15162323.
- M. Peričić; et al. (2005). "High-resolution phylogenetic analysis of southeastern Europe traces major episodes of paternal gene flow among Slavic populations". Molecular Biology and Evolution. 22 (10): 1964–75. doi:10.1093/molbev/msi185. PMID 15944443.
- V. Vitart; et al. (2006). "3000 years of solitude: extreme differentiation in the island isolates of Dalmatia, Croatia". European Journal of Human Genetics. 14: 478–487. doi:10.1038/sj.ejhg.5201589.
- V. Battaglia; et al. (2008). "Y-chromosomal evidence of the cultural diffusion of agriculture in southeast Europe". European Journal of Human Genetics. 17 (6): 820–830. doi:10.1038/ejhg.2008.249. PMC 2947100. PMID 19107149.
- D. Primorac; et al. (2011). "Croatian genetic heritage: Y-chromosome story". Croatian Medical Journal. 52 (3): 225–234. doi:10.3325/cmj.2011.52.225. PMC 3118711. PMID 21674820.
- G. Mršić; et al. (2012). "Croatian national reference Y-STR haplotype database". Molecular Biology Reports. 39 (7): 7727–41. doi:10.1007/s11033-012-1610-3. PMID 22391654.
- A. Szécsényi-Nagy; et al. (2015). "Tracing the genetic origin of Europe's first farmers reveals insights into their social organization". Proceedings of the Royal Society B. 282 (1805): 20150339. doi:10.1098/rspb.2015.0339.
- J. Šarac; et al. (2016). "Genetic heritage of Croatians in the Southeastern European gene pool—Y chromosome analysis of the Croatian continental and Island population". Molecular Biology Reports. 39 (7): 7727–41. doi:10.1007/s11033-012-1610-3. PMID 22391654.
- I. Mathieson; et al. (2018). "The genomic history of southeastern Europe". Nature. 555 (7695): 197–203. doi:10.1038/nature25778. PMID 29466330.
- mtDNA
- S. Cvjetan; et al. (2004). "Frequencies of mtDNA Haplogroups in Southeastern Europe-Croatians, Bosnians and Herzegovinians, Serbians, Macedonians and Macedonian Romani". Collegium Antropologicum. 28 (1).
- N. Jeran; et al. (2011). "Mitochondrial DNA heritage of Cres Islanders - example of Croatian genetic outliers". Collegium Antropologicum.
- J. Ljubković; et al. (2011). "Characteristics of early medieval inhabitants of Naklice (Southern Croatia) revealed by mitochondrial DNA analysis" (PDF). Book of proceedings of the 7th ISABS conference in forensic, anthropologic and medical genetics and Mayo Clinic lectures in tranlational medicine: 157.
- J. Šarac; et al. (2012). "Influence of evolutionary forces and demographic processes on the genetic structure of three Croatian populations: A maternal perspective". Annals of Human Biology. 39 (2): 143–155. doi:10.3109/03014460.2012.660194.
- D. Havaš Auguštin; et al. (2012). "Maternal Genetic Legacy of the Eastern Adriatic Island of Krk - An Interplay of Evolutionary Forces and Island's Historical Events in Shaping the Genetic Structure of Contemporary Island Population". Collegium Antropologicum. 36 (2).
- J. Šarac; et al. (2014). "Maternal Genetic Heritage of Southeastern Europe Reveals a New Croatian Isolate and a Novel, Local Sub-Branching in the X2 Haplogroup". Annals of Human Genetics. 78 (3): 178–194. doi:10.1111/ahg.12056.
- D. Sutlović; et al. (2014). "Skeletal Remains from Late Roman Period: As Old as Diocletian's Palace". Collegium antropologicum. 38 (2): 749–754.
- Ž. Bašić; et al. (2015). "Cultural inter-population differences do not reflect biological distances: an example of interdisciplinary analysis of populations from Eastern Adriatic coast". Croatian Medical Journal. 56 (3): 230–238. doi:10.3325/cmj.2015.56.230. PMC 4500963. PMID 26088847.
- D. Fernandes; et al. (2016). "Preliminary results of a prehistoric human ancient DNA time series from coastal and hinterland Croatia". IUAES. doi:10.13140/RG.2.1.2555.9920.
- atDNA
- L. Kovačević; et al. (2014). "Standing at the Gateway to Europe - The Genetic Structure of Western Balkan Populations Based on Autosomal and Haploid Markers". PLOS. 9 (8): e105090. doi:10.1371/journal.pone.0105090. PMC 4141785. PMID 25148043.
- A. Jeroncic; et al. (2016). "Whole-exome sequencing in an isolated population from the Dalmatian island of Vis". European Journal of Human Genetics. 24: 1479–1487. doi:10.1038/ejhg.2016.23.
External links
- The Croatian DNA Project at Family Tree DNA
- The 10.001 Dalmatians - Croatian biobank at University of Split School of Medicine