Ecological footprint
.svg.png)
.svg.png)
|
x ≤ -9
-9 < x ≤ -8
-8 < x ≤ -7
-7 < x ≤ -6
-6 < x ≤ -5 |
-5 < x ≤ -4
-4 < x ≤ -3
-3 < x ≤ -2
-2 < x ≤ -1
-1 < x < 0 |
0 ≤ x < 2
2 ≤ x < 4
4 ≤ x < 6
6 ≤ x < 8
8 ≤ x |
The ecological footprint measures human demand on nature, i.e., the quantity of nature it takes to support people or an economy. It tracks this demand through an ecological accounting system. The accounts contrast the biologically productive area people use for their consumption to the biologically productive area available within a region or the world (biocapacity - the productive area that can regenerate what people demand from nature). In short, it is a measure of human impact on Earth's ecosystem and reveals the dependence of the human economy on natural capital.
The ecological footprint is defined as the biologically productive area needed to provide for everything people use: fruits and vegetables, fish, wood, fibers, absorption of carbon dioxide from fossil fuel use, and space for buildings and roads.
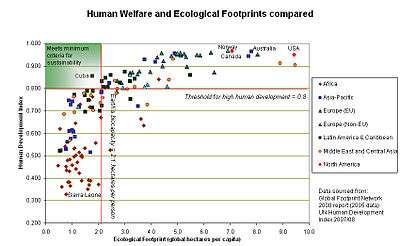
Footprint and biocapacity can be compared at the individual, regional, national or global scale. Both footprint and biocapacity change every year with number of people, per person consumption, efficiency of production, and productivity of ecosystems. At a global scale, footprint assessments show how big humanity's demand is compared to what planet Earth can renew. Since 2003, Global Footprint Network has calculated the ecological footprint from UN data sources for the world as a whole and for over 200 nations (known as the National Footprint Accounts). Every year the calculations are updated with the newest data. The time series are recalculated with every update since UN statistics also change historical data sets. As shown in Lin et al (2018)[2] the time trends for countries and the world have stayed consistent despite data updates. Also, a recent study by the Swiss Ministry of Environment independently recalculated the Swiss trends and reproduced them within 1-4% for the time period that they studied (1996-2015)[3]. Global Footprint Network estimates that, as of 2014, humanity has been using natural capital 1.7 times as fast as Earth can renew it.[4][2][5] This means humanity's ecological footprint corresponds to 1.7 planet Earths.
Ecological footprint analysis is widely used around the Earth in support of sustainability assessments.[6] It enables people to measure and manage the use of resources throughout the economy and explore the sustainability of individual lifestyles, goods and services, organizations, industry sectors, neighborhoods, cities, regions and nations.[7] Since 2006, a first set of ecological footprint standards exist that detail both communication and calculation procedures. The latest version are the updated standards from 2009.[8]
Footprint measurements and methodology
For 2014, Global Footprint Network estimated humanity's ecological footprint as 1.7 planet Earths. This means that, according to their calculations, humanity's demands were 1.7 times faster than what the planet's ecosystems renewed.[2][9]
Ecological footprints can be calculated at any scale: for an activity, a person, a community, a city, a town, a region, a nation, or humanity as a whole. Cities, due to their population concentration, have large ecological footprints and have become ground zero for footprint reduction.[10]
The ecological footprint accounting method at the national level is described on the web page of Global Footprint Network [11] or in greater detail in academic papers, including Borucke et al.[12]
The National Accounts Review Committee has also published a research agenda on how to improve the accounts.[13]
Overview
The first academic publication about ecological footprints was by William Rees in 1992.[14] The ecological footprint concept and calculation method was developed as the PhD dissertation of Mathis Wackernagel, under Rees' supervision at the University of British Columbia in Vancouver, Canada, from 1990–1994.[15] Originally, Wackernagel and Rees called the concept "appropriated carrying capacity".[16] To make the idea more accessible, Rees came up with the term "ecological footprint", inspired by a computer technician who praised his new computer's "small footprint on the desk".[17] In early 1996, Wackernagel and Rees published the book Our Ecological Footprint: Reducing Human Impact on the Earth with illustrations by Phil Testemale.[18]
Footprint values at the end of a survey are categorized for Carbon, Food, Housing, and Goods and Services as well as the total footprint number of Earths needed to sustain the world's population at that level of consumption. This approach can also be applied to an activity such as the manufacturing of a product or driving of a car. This resource accounting is similar to life-cycle analysis wherein the consumption of energy, biomass (food, fiber), building material, water and other resources are converted into a normalized measure of land area called global hectares (gha).
Per capita ecological footprint (EF), or ecological footprint analysis (EFA), is a means of comparing consumption and lifestyles, and checking this against nature's ability to provide for this consumption. The tool can inform policy by examining to what extent a nation uses more (or less) than is available within its territory, or to what extent the nation's lifestyle would be replicable worldwide. The footprint can also be a useful tool to educate people about carrying capacity and overconsumption, with the aim of altering personal behavior. Ecological footprints may be used to argue that many current lifestyles are not sustainable. Such a global comparison also clearly shows the inequalities of resource use on this planet at the beginning of the twenty-first century.
In 2007, the average biologically productive area per person worldwide was approximately 1.8 global hectares (gha) per capita. The U.S. footprint per capita was 9.0 gha, and that of Switzerland was 5.6 gha, while China's was 1.8 gha.[19][20] The WWF claims that the human footprint has exceeded the biocapacity (the available supply of natural resources) of the planet by 20%.[21] Wackernagel and Rees originally estimated that the available biological capacity for the 6 billion people on Earth at that time was about 1.3 hectares per person, which is smaller than the 1.8 global hectares published for 2006, because the initial studies neither used global hectares nor included bioproductive marine areas.[18]
A number of NGOs offer ecological footprint calculators (see Footprint Calculator, below).
Studies in the United Kingdom
The UK's average ecological footprint is 5.45 global hectares per capita (gha) with variations between regions ranging from 4.80 gha (Wales) to 5.56 gha (East England).[20]
Two recent studies have examined relatively low-impact small communities. BedZED, a 96-home mixed-income housing development in South London, was designed by Bill Dunster Architects and sustainability consultants BioRegional for the Peabody Trust. Despite being populated by relatively "mainstream" home-buyers, BedZED was found to have a footprint of 3.20 gha due to on-site renewable energy production, energy-efficient architecture, and an extensive green lifestyles program that included on-site London's first carsharing club. The report did not measure the added footprint of the 15,000 visitors who have toured BedZED since its completion in 2002. Findhorn Ecovillage, a rural intentional community in Moray, Scotland, had a total footprint of 2.56 gha, including both the many guests and visitors who travel to the community to undertake residential courses there and the nearby campus of Cluny Hill College. However, the residents alone have a footprint of 2.71 gha, a little over half the UK national average and one of the lowest ecological footprints of any community measured so far in the industrialized world.[22][23] Keveral Farm, an organic farming community in Cornwall, was found to have a footprint of 2.4 gha, though with substantial differences in footprints among community members.[24]
Ecological footprint at the individual level
In a 2012 study of consumers acting "green" vs. "brown" (where green people are «expected to have significantly lower ecological impact than “brown” consumers»), the conclusion was "the research found no significant difference between the carbon footprints of green and brown consumers".[25][26] A 2013 study concluded the same.[27][28]
A 2017 study published in Environmental Research Letters posited that the most significant way individuals could reduce their own carbon footprint is to have fewer children, followed by living without a vehicle, forgoing air travel and adopting a plant-based diet.[29]
Reviews and critiques
Early criticism was published by van den Bergh and Verbruggen in 1999,[30] which was updated in 2014.[31] Another criticism was published in 2008.[32] A more complete review commissioned by the Directorate-General for the Environment (European Commission) was published in June 2008. The review found Ecological Footprint "a useful indicator for assessing progress on the EU’s Resource Strategy" the authors noted that Ecological Footprint analysis was unique "in its ability to relate resource use to the concept of carrying capacity." The review noted that further improvements in data quality, methodologies and assumptions were needed.[33]
A recent critique of the concept is due to Blomqvist et al., 2013a,[34] with a reply from Rees and Wackernagel, 2013,[35] and a rejoinder by Blomqvist et al., 2013b.[36]
An additional strand of critique is due to Giampietro and Saltelli (2014a),[37] with a reply from Goldfinger et al., 2014,[38] a rejoinder by Giampietro and Saltelli (2014a),[39] and additional comments from van den Bergh and Grazi (2015).[40]
A number of countries have engaged in research collaborations to test the validity of the method. This includes Switzerland, Germany, United Arab Emirates, and Belgium.[41]
Grazi et al. (2007) have performed a systematic comparison of the ecological footprint method with spatial welfare analysis that includes environmental externalities, agglomeration effects and trade advantages.[42] They find that the two methods can lead to very distinct, and even opposite, rankings of different spatial patterns of economic activity. However this should not be surprising, since the two methods address different research questions.
Newman (2006) has argued that the ecological footprint concept may have an anti-urban bias, as it does not consider the opportunities created by urban growth.[43] Calculating the ecological footprint for densely populated areas, such as a city or small country with a comparatively large population — e.g. New York and Singapore respectively — may lead to the perception of these populations as "parasitic". This is because these communities have little intrinsic biocapacity, and instead must rely upon large hinterlands. Critics argue that this is a dubious characterization since mechanized rural farmers in developed nations may easily consume more resources than urban inhabitants, due to transportation requirements and the unavailability of economies of scale. Furthermore, such moral conclusions seem to be an argument for autarky. Some even take this train of thought a step further, claiming that the Footprint denies the benefits of trade. Therefore, the critics argue that the Footprint can only be applied globally.[44]
The method seems to reward the replacement of original ecosystems with high-productivity agricultural monocultures by assigning a higher biocapacity to such regions. For example, replacing ancient woodlands or tropical forests with monoculture forests or plantations may improve the ecological footprint. Similarly, if organic farming yields were lower than those of conventional methods, this could result in the former being "penalized" with a larger ecological footprint.[45] Of course, this insight, while valid, stems from the idea of using the footprint as one's only metric. If the use of ecological footprints are complemented with other indicators, such as one for biodiversity, the problem might be solved. Indeed, WWF's Living Planet Report complements the biennial Footprint calculations with the Living Planet Index of biodiversity.[46] Manfred Lenzen and Shauna Murray have created a modified Ecological Footprint that takes biodiversity into account for use in Australia.[47]
Although the ecological footprint model prior to 2008 treated nuclear power in the same manner as coal power,[48] the actual real world effects of the two are radically different. A life cycle analysis centered on the Swedish Forsmark Nuclear Power Plant estimated carbon dioxide emissions at 3.10 g/kW⋅h[49] and 5.05 g/kW⋅h in 2002 for the Torness Nuclear Power Station.[50] This compares to 11 g/kW⋅h for hydroelectric power, 950 g/kW⋅h for installed coal, 900 g/kW⋅h for oil and 600 g/kW⋅h for natural gas generation in the United States in 1999.[51] Figures released by Mark Hertsgaard, however, show that because of the delays in building nuclear plants and the costs involved, investments in energy efficiency and renewable energies have seven times the return on investment of investments in nuclear energy.[52]
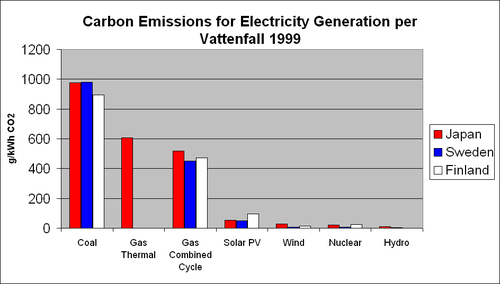
The Swedish utility Vattenfall did a study of full life-cycle greenhouse-gas emissions of energy sources the utility uses to produce electricity, namely: Nuclear, Hydro, Coal, Gas, Solar Cell, Peat and Wind. The net result of the study was that nuclear power produced 3.3 grams of carbon dioxide per kW⋅h of produced power. This compares to 400 for natural gas and 700 for coal (according to this study). The study also concluded that nuclear power produced the smallest amount of CO2 of any of their electricity sources.[53]
Claims exist that the problems of nuclear waste do not come anywhere close to approaching the problems of fossil fuel waste.[54][55] A 2004 article from the BBC states: "The World Health Organization (WHO) says 3 million people are killed worldwide by outdoor air pollution annually from vehicles and industrial emissions, and 1.6 million indoors through using solid fuel."[56] In the U.S. alone, fossil fuel waste kills 20,000 people each year.[57] A coal power plant releases 100 times as much radiation as a nuclear power plant of the same wattage.[58] It is estimated that during 1982, US coal burning released 155 times as much radioactivity into the atmosphere as the Three Mile Island incident.[59] In addition, fossil fuel waste causes global warming, which leads to increased deaths from hurricanes, flooding, and other weather events. The World Nuclear Association provides a comparison of deaths due to accidents among different forms of energy production. In their comparison, deaths per TW-yr of electricity produced (in UK and USA) from 1970 to 1992 are quoted as 885 for hydropower, 342 for coal, 85 for natural gas, and 8 for nuclear.[60]
The Western Australian government State of the Environment Report included an Ecological Footprint measure for the average Western Australian seven times the average footprint per person on the planet in 2007, a total of about 15 hectares.[61]
Footprint by country
The world-average ecological footprint in 2013 was 2.8 global hectares per person.[2] The average per country ranges from over 10 to under 1 global hectares per person. There is also a high variation within countries, based on individual lifestyle and economic possibilities.[62]
The GHG footprint or the more narrow carbon footprint are a component of the ecological footprint. Often, when only the carbon footprint is reported, it is expressed in weight of CO2 (or CO2e representing GHG warming potential (GGWP)), but it can also be expressed in land areas like ecological footprints. Both can be applied to products, people or whole societies.[63]
Implications
. . . the average world citizen has an eco-footprint of about 2.7 global average hectares while there are only 2.1 global hectare of bioproductive land and water per capita on earth. This means that humanity has already overshot global biocapacity by 30% and now lives unsustainabily by depleting stocks of "natural capital"[64]
See also
Related concepts
- Carbon footprint
- Dependency theory
- Earth Overshoot Day formerly also called Ecological Debt Day
- Ecological economics
- Ecosystem valuation
- Environmental impact assessment
- Greenhouse debt
- Greenhouse gas emissions accounting
- Happy Planet Index
- Human overpopulation
- Individual action on climate change
- Life cycle assessment
- List of environmental issues
- Netherlands fallacy
- Our Common Future
- Overshoot (population)
- Physical balance of trade
- Simon–Ehrlich wager
- Social metabolism
- The Limits to Growth
- The Population Bomb
- Water footprint
- World Scientists' Warning to Humanity
Since the 1950s, a new geological epoch called the Anthropocene has been proposed to distinguish the period of major human impact.[65]
Further reading
- Rees, W. E. (October 1992). "Ecological footprints and appropriated carrying capacity: what urban economics leaves out". Environment and Urbanisation. 4 (2): 121–130. doi:10.1177/095624789200400212.
- Rees, W. E. and M. Wackernagel (1994) Ecological footprints and appropriated carrying capacity: Measuring the natural capital requirements of the human economy, in Jansson, A. et al.. Investing in Natural Capital: The Ecological Economics Approach to Sustainability. Washington D.C.:Island Press. ISBN 1-55963-316-6
- Wackernagel, M. (1994). Ecological Footprint and Appropriated Carrying Capacity: A Tool for Planning Toward Sustainability (PDF) (PhD thesis). Vancouver, Canada: School of Community and Regional Planning. The University of British Columbia. OCLC 41839429.
- Wackernagel, M. and W. Rees. 1996. Our Ecological Footprint: Reducing Human Impact on the Earth. Gabriola Island, BC: New Society Publishers. ISBN 0-86571-312-X.
- Wackernagel, M; Schulz, NB; Deumling, D; Linares, AC; Jenkins, M; Kapos, V; Monfreda, C; Loh, J; et al. (2002). "Tracking the ecological overshoot of the human economy" (PDF). Proc. Natl. Acad. Sci. U.S.A. 99 (14): 9266–71. doi:10.1073/pnas.142033699. PMC 123129. PMID 12089326.
- WWF, Global Footprint Network, Zoological Society of London (2006) Living Planet Report 2006. WWF Gland, Switzerland. (downloadable in 11 languages via https://web.archive.org/web/20070808043056/http://www.footprintnetwork.org/newsletters/gfn_blast_0610.html)
- Lenzen, M. and Murray, S. A. 2003. 'The Ecological Footprint – Issues and Trends.' ISA Research Paper 01-03
- Chambers, N., Simmons, C. and Wackernagel, M. (2000), Sharing Nature's Interest: Ecological Footprints as an Indicator of Sustainability. Earthscan, London ISBN 1-85383-739-3 (see also http://www.ecologicalfootprint.com)
- Raudsepp-Hearne C, Peterson GD, Tengö M, Bennett EM, Holland T, Benessaiah K, MacDonald GM, Pfeifer L (2010). "Untangling the Environmentalist's Paradox: Why is Human Well-Being Increasing as Ecosystem Services Degrade?". BioScience. 60 (8): 576–589. doi:10.1525/bio.2010.60.8.4.
- J.C.J.M. van den Bergh; H. Verbruggen (1999). "Spatial sustainability, trade and indicators: an evaluation of the 'ecological footprint'" (PDF). Ecological Economics. 29 (1): 63–74. doi:10.1016/s0921-8009(99)00032-4. Archived from the original (PDF) on 2007-10-09.
- F. Grazi; J.C.J.M. van den Bergh; P. Rietveld (2007). "Welfare economics versus ecological footprint: modeling agglomeration, externalities and trade". Environmental and Resource Economics. 38 (1): 135–153. doi:10.1007/s10640-006-9067-2.
- Ohl, B.; Wolf, S.; & Anderson, W. (2008). "A modest proposal: global rationalization of ecological footprint to eliminate ecological debt". Sustainability: Science, Practice, & Policy. 4 (1): 5–16. Archived from the original on 2009-01-24. Retrieved 2009-03-11.
References
- ↑ "Open Data Platform". data.footprintnetwork.org. Retrieved 2018-03-30.
- 1 2 3 4 Lin, D; Hanscom, L; Murthy, A; Galli, A; Evans, M; Neill, E; Mancini, MS; Martindill, J; Medouar, F-Z; Huang, S; Wackernagel, M. (2018). "Ecological Footprint Accounting for Countries: Updates and Results of the National Footprint Accounts, 2012–2018". Resources. 7(3): 58. https://doi.org/10.3390/resources7030058
- ↑ Environmental Footprints of Switzerland. Federal Office for the Environment. 2018. p. 87.
- ↑ "Data Sources". Global Footprint Network. 2017-04-17. Retrieved 2017-04-16.
- ↑ "Open Data Platform". data.footprintnetwork.org. Retrieved 2018-10-10.
- ↑ Lyndhurst, Brook (June 2003). "London's Ecological Footprint A review" (PDF). Mayor of London. Greater London Authority (commissioned by GLA Economics).
- ↑ Global Footprint Network "Ecological Footprint: Overview." Retrieved on April 16, 2017.
- ↑ Global Footprint Network. "Ecological Footprint Standards 2009". Global Footprint Network. Retrieved 16 July 2018.
- ↑ "Open Data Platform". data.footprintnetwork.org. Retrieved 2018-10-10.
- ↑ "Most poignantly... cities in the Anthropocene will remain the 'ground zero'". academia.edu.
- ↑ "Methodology and Data". Global Footprint Network. Retrieved 15 July 2018.
- ↑ Borucke, M; Moore, D; Cranston, G; Gracey, K; Lazarus, E; Morales, J.C.; Wackernagel, M. (2013). "Accounting for demand and supply of the biosphere's regenerative capacity: The National Footprint Accounts' underlying methodology and framework". Ecological Indicators. 24: 518–533. doi:10.1016/j.ecolind.2012.08.005.
- ↑ A Research Agenda for Improving National Ecological Footprint Accounts Retrieved: 2007-11-11 Archived November 28, 2007, at the Wayback Machine.
- ↑ Rees, William E. (October 1992). "Ecological footprints and appropriated carrying capacity: what urban economics leaves out". Environment and Urbanisation. 4 (2): 121–130. doi:10.1177/095624789200400212.
- ↑ Wackernagel, M. (1994). Ecological Footprint and Appropriated Carrying Capacity: A Tool for Planning Toward Sustainability (PDF) (PhD thesis). Vancouver, Canada: School of Community and Regional Planning. The University of British Columbia. OCLC 41839429.
- ↑ Wackernagel, Mathis, 1991. "Land Use: Measuring a Community's Appropriated Carrying Capacity as an Indicator for Sustainability"; and "Using Appropriated Carrying Capacity as an Indicator, Measuring the Sustainability of a Community." Report I & II to the UBC Task Force on Healthy and Sustainable Communities, Vancouver.
- ↑ William Safire, On Language: Footprint, New York Times Magazine, February 17, 2008
- 1 2 Wackernagel, Mathis & Rees, William (1996)"Our Ecological Footprint" (New Society Press)
- ↑ or Archived 2009-01-29 at the Wayback Machine. Living Planet Report 2008 outlines scenarios for humanity's future. Global Footprint Network. Retrieved: 2009-02-15
- 1 2 Chambers, N. et al. (2004) Scotland’s Footprint. Best Foot Forward. ISBN 0-9546042-0-2.
- ↑ Global ecosystems 'face collapse' BBC News. Retrieved: 2007-05-18.
- ↑ Findhorn eco-footprint is ‘world’s smallest’ Archived 2009-01-23 at the Wayback Machine. Sunday Herald, August 11, 2008. "A new expert study says the multinational community's ecological footprint is half the UK average. This means Findhorn uses 50% fewer resources and creates 50% less waste than normal."
- ↑ Tinsley, S. and George, H. (2006) Ecological Footprint of the Findhorn Foundation and Community. Moray. Sustainable Development Research Centre, UHI Millennium Institute.
- ↑ Radical Routes (2006) How to work out your Ecological Footprint. Leeds. Radical Routes Ltd. Available to order or download on the Radical Routes web site
- ↑ Alden Wicker (1 March 2017). "Conscious consumerism is a lie. Here's a better way to help save the world". Quartz. Retrieved 13 February 2018.
A 2012 study compared footprints of “green” consumers who try to make eco-friendly choices to the footprints of regular consumers. And they found no meaningful difference between the two.
- ↑ Csutora, M. "The ecological footprint of green and brown consumers. Introducing the behaviour-impact-gap (BIG) problem" (PDF). European Round Table on Sustainable Consumption and Production (ERSCP) 2012. 15th European Roundtable on Sustainable Consumption and Production. Retrieved 13 February 2018.
The research found no significant difference between the carbon footprints of green and brown consumers suggesting that individual environmental behaviour does not always modify consumption patterns significantly.
- ↑ David Roberts (1 December 2017). "Wealthier people produce more carbon pollution — even the "green" ones". Vox. Retrieved 13 February 2018.
Environmental identity will lead to some relatively low-impact (high-signaling) pro-environmental behaviors, but it rarely drives serious reductions in the biggest sources of lifestyle emissions. Environmental self-identification rises with income, but so do emissions. (A 2012 study and a 2013 study, both based on a survey in Hungary, found roughly the same thing.)
- ↑ Tabi, Andrea. "Does pro-environmental behaviour affect carbon emissions?". Energy Policy. Elsevier. 63: 972–981. Retrieved 13 February 2018.
no significant difference is found between the impacts of environmentally aware and environmentally unaware consumers, i.e. both ‘Brown’ and ‘Supergreen’ consumers consume approximately the same amount of energy and produce approximately the same amount of carbon emissions
- ↑ Perkins, Sid (July 11, 2017). "The best way to reduce your carbon footprint is one the government isn't telling you about". Science. Retrieved April 8, 2018.
- ↑ J.C.J.M. van den Bergh; H. Verbruggen (1999). "Spatial sustainability, trade and indicators: an evaluation of the 'ecological footprint'" (PDF). Ecological Economics. 29 (1): 63–74. doi:10.1016/s0921-8009(99)00032-4. Archived from the original (PDF) on 2007-10-09.
- ↑ van den Bergh, Jeroen C.J.M; Grazi, Fabio (2014). "Ecological Footprint Policy? Land Use as an Environmental Indicator". Journal of Industrial Ecology. 18 (1): 10–19. doi:10.1111/jiec.12045. ISSN 1088-1980. This paper and others were described and responded to by the Global Footprint Network on their website in June 2014: Common Criticisms Archived 2015-03-20 at the Wayback Machine.
- ↑ Fiala, N. (2008). "Measuring sustainability: Why the ecological footprint is bad economics and bad environmental science". Ecological Economics. 67 (4): 519–525. doi:10.1016/j.ecolecon.2008.07.023.
- ↑ Analysis of the potential of the Ecological Footprint and related assessment tools for use in the EU’s Thematic Strategy on the Sustainable Use of Natural Resources is available at: http://ec.europa.eu/environment/natres/studies.htm
- ↑ Blomqvist, L.; Brook, B.W.; Ellis, E.C.; Kareiva, P.M.; Nordhaus, T.; Shellenberger, M. (2013). "Does the shoe fit? Real versus imagined ecological footprints". PLoS Biol. 11 (11): e1001700. doi:10.1371/journal.pbio.1001700.
- ↑ Rees, W.E.; Wackernagel, M. (2013). "The Shoe Fits, but the Footprint is Largerthan Earth". PLoS Biology. 11 (11): e1001701. doi:10.1371/journal.pbio.1001701. PMC 3818166. PMID 24223518.
- ↑ Blomqvist, L.; Brook, B.W.; Ellis, E.C.; Kareiva, P.M.; Nordhaus, T.; et al. (2013b). "The ecological footprint remains a misleading metric of global sustainability". PLoS Biol. 11 (11): e1001702. doi:10.1371/journal.pbio.1001702.
- ↑ Giampietro, M. Saltelli A. (2014a): Footprint to nowhere, Ecological Indicators 46: 610–621.
- ↑ Goldfinger; Wackernagel, S. M.; Galli, A.; Lazarus, E.; Lin, D. (2014). "Footprint facts and fallacies: A response to Giampietro and Saltelli (2014) "Footprints to Nowhere"". Ecological Indicators. 46: 622–632. doi:10.1016/j.ecolind.2014.04.025.
- ↑ Giampietro, M.; Saltelli, A.; et al. (2014b). "Footworking in circles: Reply to Goldfinger et al. (2014) "Footprint Facts and Fallacies: A Response to Giampietro and Saltelli (2014) Footprints to nowhere"". Ecological Indicators. 46: 260–263.
- ↑ Van; den Bergh, J.; Grazi, Fabio (2015). "Reply to the first systematic response by the Global Footprint Network to criticism: A real debate finally?". Ecological Indicators. 58: 458–463. doi:10.1016/j.ecolind.2015.05.007.
- ↑ http://www.footprintnetwork.org/en/index.php/GFN/page/national_reviews Archived 2009-02-24 at the Wayback Machine.. More specifically, reviews by nations include Switzerland – http://www.bfs.admin.ch/bfs/portal/en/index/themen/21/03/blank/blank/01.html (technical and descriptive report). Eurostat – http://epp.eurostat.ec.europa.eu/cache/ITY_OFFPUB/KS-AU-06-001/EN/KS-AU-06-001-EN.PDF Archived 2011-04-09 at the Wayback Machine. Germany – http://www.umweltdaten.de/publikationen/fpdf-l/3489.pdf Archived 2011-06-10 at the Wayback Machine. Ireland – http://erc.epa.ie/safer/iso19115/displayISO19115.jsp?isoID=56#files DG Environment – June 2008: "Potential of the Ecological Footprint for monitoring environmental impact from natural resource use" available at http://ec.europa.eu/environment/natres/studies.htm United Arab Emirates – Al Basama Al Beeiya Initiative http://www.agedi.ae/ecofootprintuae/default.aspx Archived 2010-05-28 at the Wayback Machine.
- ↑ F. Grazi; J.C.J.M. van den Bergh; P. Rietveld (2007). "Welfare economics versus ecological footprint: modeling agglomeration, externalities and trade". Environmental and Resource Economics. 38 (1): 135–153. doi:10.1007/s10640-006-9067-2.
- ↑ Newman, Peter (October 2006). "The environmental impact of cities". Environment and Urbanization. 18 (2): 275–295. doi:10.1177/0956247806069599. ISSN 0956-2478.
- ↑ "Planning and Markets: Peter Gordon and Harry W. Richardson". Pam.usc.edu. Retrieved 2012-11-08.
- ↑ Lenzen, M., C. Borgstrom Hansson and S. Bond (2006) On the bioproductivity and land-disturbance metrics of the Ecological Footprint. University of Sydney, ISA Research Paper, June, 06, in collaboration with WWF. Retrieved: 2007-06-04.
- ↑ Loh, J., R. Green, T. Ricketts, J. Lamoreux, M. Jenkins, V. Kapos and J. Randers (2005). "The Living Planet Index: using species population time series to track trends in biodiversity" (PDF). Philosophical Transactions of the Royal Society. 360 (1454): 289–295. doi:10.1098/rstb.2004.1584. PMC 1569448. PMID 15814346.
- ↑ Lenzen, Manfred; Murray Shauna A. (2001). "A modified ecological footprint method and its application to Australia". Ecological Economics. 37 (2): 229–255. doi:10.1016/S0921-8009(00)00275-5.
- ↑ Questions and Answers, Global Footprint Network
- ↑ Vattenfall 2004, Forsmark EPD for 2002 and SwedPower LCA data 2005.
- ↑ Energy Analysis of Power Systems Archived 2008-03-03 at the Wayback Machine. accessed 20 October 2007
- ↑ Electric Power Industry CO2 Emissions accessed 20 October 2007
- ↑ Hertsgaard, Mark (2011) "Hot: Living Through the Next Fifty Years on Earth" (Houghton Mifflin Harcourt)
- ↑ nuclearinfo.net. Greenhouse Emissions of Nuclear Power
- ↑ David Bodansky (June 2001). "The Environmental Paradox of Nuclear Power". Environmental Practice. 3 (2): 86–8. doi:10.1017/S1466046600002234. Archived from the original on 2008-01-27.
(reprinted by the American Physical Society)
- ↑ "Some Amazing Facts about Nuclear Power". August 2002. Retrieved 2008-01-31.
- ↑ Alex Kirby (13 December 2004). "Pollution: A life and death issue". BBC News. Retrieved 2008-01-31.
- ↑ Don Hopey (June 29, 2005). "State sues utility for U.S. pollution violations". Pittsburgh Post-Gazette. Retrieved 2008-01-31.
- ↑ Alex Gabbard. "Coal Combustion: Nuclear Resource or Danger". Oak Ridge National Laboratory. Archived from the original on 2007-02-05. Retrieved 2008-01-31.
- ↑ Nuclear proliferation through coal burning Archived 2009-03-27 at the Wayback Machine. — Gordon J. Aubrecht, II, Ohio State University
- ↑ "Safety of Nuclear Power Reactors".
- ↑ Report identifies population and consumption as an environmental priority Archived 2016-10-18 at the Wayback Machine., accessed 6 March 2016.
- ↑ "Humanity Now Demanding 1.6 Earths". Global Footprint Network. Retrieved 16 April 2017.
- ↑ Benn, Hilary; Milliband, Ed. "Guidance on how to measure and report your greenhouse gas emissions" (PDF). GOV.UK. Department for Environment, Food and Rural Affairs (UK). Retrieved 9 November 2016.
- ↑ "The Human Nature of Unsustainability". Retrieved 29 July 2016.
- ↑ "Anthropocene: Age of Man - Pictures, More From National Geographic Magazine". Retrieved 29 July 2016.
External links
- Global Footprint Network Ecological Footprint : Overview
- Footprint data portal, open data platform with all national results from 1961 to today, calculated by Global Footprint Network
- Earth Overshoot Day, the official website of Earth Overshoot Day
- WWF "Living Planet Report", a biannual calculation of national and global footprints
- GreenScore City Index, a city index measuring footprints of 50 Canadian cities
- Life Cycle Assessment, introduction
- US Environmental Footprint Factsheet
- Interview with Bill Rees
| Fields | 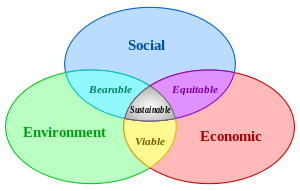 | |
|---|---|---|
| Related |
| |
| Applied |
| |
| ||