Greenhouse gas footprint
The Greenhouse gas footprint, or GHG footprint, refers to the amount of greenhouse gases that are emitted during the creation of products or services.
Human activities are one of the main causes of greenhouse gas. These increase the earth's temperature and are emitted from fossil fuel usage in electricity and other byproducts of manufacturing. The major effects mainly consist of climate changes, such as extreme precipitation and acidification and warming of oceans. Climate change has been occurring since the start of the Industrial Revolution in the 1820s. Due to humans' heavy reliance on fossil fuels, energy usage, and constant deforestation, the amount of greenhouse gas in the atmosphere is increasing, which makes reducing a greenhouse gas footprint harder to achieve. However, there are several ways to reduce one's greenhouse gas footprint, such as using more energy efficient household appliances, increase usage of fuel efficient cars, and saving electricity.
Definition

Greenhouse gases (GHGs) are gases that increase the temperature of the Earth due to their absorption of infrared radiation.[1] Although some emissions are natural, the rate of which they are being produced has increased because of humans. These gases are emitted from fossil fuel usage in electricity, in heat and transportation, as well as being emitted as byproducts of manufacturing. The most common GHGs are carbon dioxide (CO2), methane (CH4), nitrous oxide (N2O), and many fluorinated gases.[2] A greenhouse gas footprint is the numerical quantity of these gases that a single entity emits. The calculations can be computed ranging from a single person to the entire world. A GHG footprint can be calculated on the US Environmental Protection Agency’s (EPA) website. After entering data, a number with units of pounds of CO2 will be given. The EPA use pounds of CO2 equivalence to determine the greenhouse gas footprint.[3]
History

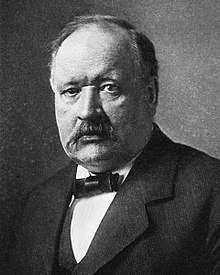
As early as the 1820s the investigation on climate change was in full swing. Joseph Fourier believed that light from the sun can enter the atmosphere, but cannot leave nearly as easily. He sought to prove that air can absorb the infrared radiation and will be given back to the Earth’s surface. Later in 1859, John Tyndall discovered that water vapor and CO2 trap heat waves given by the sun. In 1896, Svante Arrhenius tried to prove that it would take thousands of years for the industrial production of CO2 to raise the Earth’s temperature 5-6°C. But this idea was met with much skepticism throughout the early 20th century because it was oversimplified. In the mid 20th century, it was concluded that there was a 10% increase in carbon dioxide in the atmosphere over the 19th century, which resulted in slight warming. It was at this time that people believed the emissions of CO2 will increase exponentially in the future and the oceans would absorb any surplus of greenhouse gases. In 1956, Gilbert N. Plass concluded that greenhouse gas emissions will have an effect on the Earth’s temperature and argued that dismissing GHG emissions would be a mistake. Soon after, scientists from all sectors began to work together to figure out the mystery of GHG emissions and their effects. As technology advanced, it was in the 1980s that there was proof of a rise in CO2 levels. An ice core, captured through drilling, provided clear evidence that carbon dioxide levels have risen.[4]
Causes
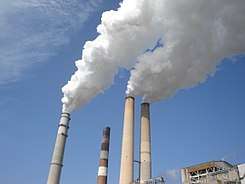
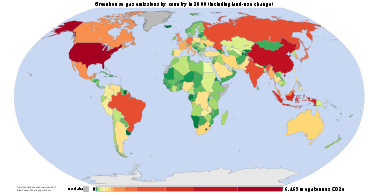
Although some production of greenhouse gases is natural, human activity has increased the production substantially. Major industrial sources of greenhouse gasses are power plants, residential buildings, and road transportation, as well as energy industry processes and losses, iron and steel manufacturing, coal mining, and chemical and petrochemical industries.[5] Changes in the environment also contribute the increase in greenhouse gas emission such as, deforestation, forest degradation and land use, livestock, agricultural soils and water, and wastewater. China is the largest contributor of greenhouse gas, causing up 30% of the total emissions. The United States contributes 15%, followed by the EU with 9%, then India with 7%, Russia with 5%, Japan with 4% , and other miscellaneous countries making up the remaining 30%.[6]
Although carbon dioxide (CO2) is the most prevalent gas, it is not the most damaging. Carbon dioxide is essential to life because animals release it during cellular respiration when they breathe and plants use it for photosynthesis. Carbon dioxide is released naturally by decomposition, ocean release and respiration. Humans contribute an increase of carbon dioxide emissions by burning fossil fuels, deforestation, and cement production.
Methane (CH4) is largely released by coal, oil, and natural gas industries. Although methane is not mass produced like carbon dioxide, it is still very prevalent. Methane is more harmful than carbon dioxide because it traps heat better than CO2. Methane is a main component in natural gas. Recently industries as well as consumers have been using natural gas because they believe that it is better for the environment since it contains less CO2. However, this is not the case because methane is actually more harmful to the environment.[7]
Nitrous oxide (N2O) is released by fuel combustion, most of which comes from coal fired power plants, agricultural and industrial activities.
Fluorinated gases include hydroflucarbons (HFCs), perfluorocarbons (PFCs), sulfur hexafluoride (SF6), and nitrogen trifluoride (NF3). These gases have no natural source and are solely products of human activity. The biggest cause of these sources is the usage of ozone depleting substances; such as refrigerants, aerosol, propellants, foam blowing agents, solvents, and fire retardants.[2]
The production of all of these gases contributes to one's GHG footprint. The more that these gases are produced, the higher the GHG footprint.
Rise in greenhouse gas over time
.png)
Since the Industrial Revolution, greenhouse gas emissions have increased immensely. As of 2017, the carbon dioxide (CO2) levels are 142%, of what they were pre-industrial revolution. Methane is up 253% and nitrous oxide is 121% of pre-industrial levels. The energy driven consumption of fossil fuels has made GHG emissions rapidly increase, causing the Earth's temperature to rise. In the past 250 years, human activity such as, burning fossil fuels and cutting down carbon-absorbing forests, have contributed greatly to this increase. In the last 25 years alone, emissions have increased by more than 33%, most of which comes from carbon dioxide, accounting for three-fourths of this increase.[8][9][10]
Lifespan of greenhouse gases
Different GHGs last different amounts of time in the atmosphere. For example, fluorinated gases can last from a few weeks to a few thousand years in the atmosphere, whereas nitrous oxide can last for over a century. However, methane is somewhere in the middle, lasting a little over a decade. Carbon dioxide's lifespan cannot be calculated exactly because it does not disappear, but is either used by plants or absorbed by the ocean. There is a possibility that some greenhouse gases have been in the atmosphere since the beginning of the twentieth century, when the first signs of an increase of these gases arose.[11]
Impacts
Greenhouse gases may cause severe and irreversible impacts on people and ecosystems. The warming caused by GHG emissions is effectively irreversible over multi-century time scales. Risks of GHG footprints are evaluated based on the interaction of projected damages in an earth system climate change effected by choice of emission scenarios. A lot of the effects are extreme weather changes, which include, cold winter extremes, increase in annual mean precipitation, and year round reductions in arctic sea ice. There are a lot of key risks that span over sectors and regions. This includes severe ill-health and disrupted livelihoods, breaking down of infrastructure, and risk loss of ecosystems. The disrupted livelihoods and severe ill-health includes storm surges and coastal and inland flooding. The breaking down of infrastructure includes the networks and critical services. There is also a risk of loss of biodiversity, ecosystem goods, functions, and services.[12]
Changes of weather
It is likely that heat waves will occur more often and last longer as a result of climate change and an increase of the carbon cycle. Climate change and the carbon cycle will be amplified because of GHG emissions. Extreme precipitation events will become more intense and frequent. The global mean surface temperature change per trillion tonnes of carbon emitted as CO2 is likely in range of .8 to 2.5 degrees Celsius. This is known as a transient climate response to cumulative carbon emissions (TCRE).[12]

Changes to the oceans
The extreme precipitation will cause the oceans to warm and acidify. The southern ocean will increase the most in temperature. The global mean sea levels will rise due to the extreme precipitation. Near-surface permafrost in high northern latitudes will reduce resulting in sea level rise not being uniform across regions. There will be a rise in about 95% of ocean area. The sea level rise depends on the pathway of CO2 emissions not only the cumulative total. In some regions, the future sea level will be at an extreme by 2100. 70 percent of coastlines are projected to have sea level change within more or less than 20 percent of global mean.[12]
Solutions

How to reduce GHGs
Reduction of carbon dioxide
In order to decrease CO2 emissions, the reliance of fossil fuels must be lowered. These fuels are producing lots of CO2 across all forms of their usage. Alternatively, renewable sources are cleaner for the environment. Capturing CO2 from power plants will also reduce emissions.[2]
Household energy conservation measures include increasing insulation in construction, using fuel-efficient vehicles and ENERGY STAR appliances, and unplugging electrical items when not in use.
Reduction of methane
Reducing methane emissions can be accomplished in several ways. Capturing CH4 emissions from coal mines and landfills, are two ways of reducing these emissions. Manure management and livestock operations is another possible solution. Motor vehicles use fossil fuels, which produces CO2, but fossil fuels also produce CH4 as a byproduct. Thus, better technology for these vehicles to avoid leakage would be very beneficial.[2]
Reduction of nitrous oxide
Nitrous oxide (N2O) is often given off as a byproduct in various ways. Nylon production and fossil fuel usage are two ways that N2O is given off as a byproduct. Thus, improving technology for nylon production and the gathering of fossil fuels would greatly reduce nitrous oxide emissions. Also, many fertilizers have a nitrogenous base. A decrease in usage of these fertilizers, or changing their components, are more ways to reduce N2O emissions.[2]
Reduction of fluorinated gases
Although fluorinated gases are not produced on a massive scale, they have the worst effect on the environment. A reduction of fluorinated gas emissions can be done in many ways. Many industries that emit these gases can capture or recycle them. These same industries can also invest in more advanced technology that will not produce these gases. A reduction of leakage within power grids and motor vehicles will also decrease the emissions of fluorinated gases. There are also many air conditioning systems that emit fluorinated gases, thus an update in technology would decrease these emissions.[2]
Everyday life changes
There are many simple changes that can be made to the everyday lifestyle of a person that would reduce their GHG footprint. Reducing energy consumption within a household can include lowering one’s dependence on air conditioning and heating, using CFL light bulbs, choosing ENERGY STAR appliances, recycling, using cold water to wash clothes, and avoiding a dryer. Another adjustment would be to use a motor vehicle that is fuel-efficient as well as reducing reliance on motor vehicles. Motor vehicles produce many GHGs, thus an adjustment to one’s usage will greatly affect a GHG footprint.[3]
Citations
- ↑ Snyder, C. S.; Bruulsema, T. W.; Jensen, T. L.; Fixen, P. E. (2009-10-01). "Review of greenhouse gas emissions from crop production systems and fertilizer management effects". Agriculture, Ecosystems & Environment. Reactive nitrogen in agroecosystems: Integration with greenhouse gas interactions. 133 (3): 247–266. doi:10.1016/j.agee.2009.04.021.
- 1 2 3 4 5 6 EPA,OA, US. "Overview of Greenhouse Gases | US EPA". US EPA. Retrieved 2017-11-01.
- 1 2 Division, US EPA, Office of Air and Radiation, Office of Atmospheric Programs, Climate Change. "Household Carbon Footprint Calculator". www3.epa.gov. Retrieved 2017-11-01.
- ↑ "The Carbon Dioxide Greenhouse Effect". history.aip.org. Retrieved 2017-11-01.
- ↑ "15 sources of greenhouse gases - About us | Allianz". www.allianz.com. Retrieved 2017-11-03.
- ↑ EPA,OA, US. "Global Greenhouse Gas Emissions Data | US EPA". US EPA. Retrieved 2017-11-03.
- ↑ Howarth, Robert W. (2014-06-01). "A bridge to nowhere: methane emissions and the greenhouse gas footprint of natural gas". Energy Science & Engineering. 2 (2): 47–60. doi:10.1002/ese3.35. ISSN 2050-0505.
- ↑ Holli, Riebeek, (2010-06-03). "Global Warming : Feature Articles". earthobservatory.nasa.gov. Retrieved 2017-11-03.
- ↑ "CO₂ and other Greenhouse Gas Emissions". Our World in Data. Retrieved 2017-11-03.
- ↑ Association, Press (2014-09-09). "Greenhouse gas emissions rise at fastest rate for 30 years". The Guardian. ISSN 0261-3077. Retrieved 2017-11-03.
- ↑ EPA,OA, US. "Climate Change Indicators: Greenhouse Gases | US EPA". US EPA. Retrieved 2017-11-08.
- 1 2 3 Climate change 2014. (2015). Retrieved from INTERGOVERNMENTAL PANEL website: http://www.ipcc.ch/pdf/assessment-report/ar5/syr/SYR_AR5_FINAL_full_wcover.pdf
References
- Association, Press (2014-09-09). "Greenhouse gas emissions rise at fastest rate for 30 years". The Guardian. ISSN 0261-3077. Retrieved 2017-11-03.
- Climate change 2014. (2015). Retrieved from INTERGOVERNMENTAL PANEL website: http://www.ipcc.ch/pdf/assessment-report/ar5/syr/SYR_AR5_FINAL_full_wcover.pdf
- "CO₂ and other Greenhouse Gas Emissions". Our World in Data. Retrieved 2017-11-03.
- Division, US EPA, Office of Air and Radiation, Office of Atmospheric Programs, Climate Change. "Household Carbon Footprint Calculator". www3.epa.gov. Retrieved 2017-11-01
- EPA,OA, US. "Climate Change Indicators: Greenhouse Gases | US EPA". US EPA. Retrieved 2017-11-08
- EPA,OA, US. "Global Greenhouse Gas Emissions Data | US EPA". US EPA. Retrieved 2017-11-03.
- EPA,OA, US. "Overview of Greenhouse Gases | US EPA". US EPA. Retrieved 2017-11-01
- Holli, Riebeek, (2010-06-03). "Global Warming : Feature Articles". earthobservatory.nasa.gov. Retrieved 2017-11-03.
- Howarth, Robert W. (2014-06-01). "A bridge to nowhere: methane emissions and the greenhouse gas footprint of natural gas". Energy Science & Engineering. 2 (2): 47–60. doi:10.1002/ese3.35. ISSN 2050-0505
- Snyder, C. S.; Bruulsema, T. W.; Jensen, T. L.; Fixen, P. E. (2009-10-01). "Review of greenhouse gas emissions from crop production systems and fertilizer management effects". Agriculture, Ecosystems & Environment. Reactive nitrogen in agroecosystems: Integration with greenhouse gas interactions. 133 (3): 247–266. doi:10.1016/j.agee.2009.04.021..
- "The Carbon Dioxide Greenhouse Effect". history.aip.org. Retrieved 2017-11-01.
- 15 sources of greenhouse gases - About us | Allianz". www.allianz.com. Retrieved 2017-11-03.