Adur District Council election, 2018
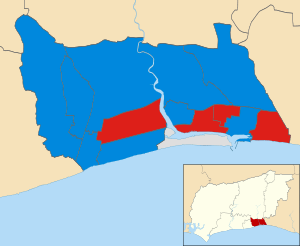
Map of the results of the 2018 Adur District Council council election. Conservatives in blue, Labour in red and Independent in grey.
The 2018 Adur District Council elections took place on 3 May 2018 to elect members of Adur District Council in West Sussex, England. The election saw half of the Council's 29 seats up for election, and resulted in the Conservative Party retaining their majority on the council. Labour gained 4 seats to replace UKIP as the official opposition on the Council, who lost all the seats they were defending from 2014.
Results
| Party | Seats | Gains | Losses | Net gain/loss | Seats % | Votes % | Votes | +/− | |
|---|---|---|---|---|---|---|---|---|---|
| Conservative | 9 | +2 | -2 | 0 | 64.3 | 44.0 | 7,322 | +7.8% | |
| Labour | 4 | 4 | 0 | +4 | 28.6 | 34.4 | 5,718 | +18.6% | |
| Liberal Democrat | 0 | 0 | 0 | 0 | 0.0 | 6.9 | 1,152 | -3.0% | |
| UKIP | 0 | 0 | 4 | -4 | 0.0 | 5.3 | 876 | -23.9% | |
| Green | 0 | 0 | 0 | 0 | 0.0 | 5.3 | 852 | +0.5% | |
| Shoreham Beach Residents' Association | 1 | 0 | 0 | 0 | 7.1 | 4.4 | 726 | +0.4% | |
By ward
| Party | Candidate | Votes | % | ± | |
|---|---|---|---|---|---|
| Conservative | Emma Evans | 634 | 56.5 | +3.0 | |
| Labour | Carol O'Neal | 315 | 28.0 | +14.5 | |
| Green | Jane Mott | 105 | 9.3 | +1.3 | |
| Liberal Democrat | Elisa Vaughan | 67 | 6.0 | +0.7 | |
| Majority | 319 | 28.4 | -5.5 | ||
| Turnout | 1,123 | 35.7 | -4.8 | ||
| Conservative hold | Swing | 5.8% Con to Lab | |||
| Party | Candidate | Votes | % | ± | |
|---|---|---|---|---|---|
| Conservative | Pat Beresford | 444 | 44.9 | -2.6 | |
| Labour | Christopher Allinson | 270 | 27.3 | +27.3 | |
| Liberal Democrat | Steve Creed | 151 | 15.3 | -1.0 | |
| UKIP | Gloria Eveleigh | 117 | 11.8 | -24.4 | |
| Majority | 174 | 17.6 | +6.3 | ||
| Turnout | 988 | 28.7 | -10.0 | ||
| Conservative hold | Swing | 15% Con to Lab | |||
| Party | Candidate | Votes | % | ± | |
|---|---|---|---|---|---|
| Conservative | Paul Mansfield | 575 | 52.6 | +28.6 | |
| Labour | Michael Thornton | 381 | 34.8 | +17.8 | |
| UKIP | David Bamber | 55 | 5.0 | -29.5 | |
| Liberal Democrat | Stephen Male | 51 | 5.0 | -19.3 | |
| Green | Christopher Davis | 28 | 2.6 | +2.6 | |
| Majority | 194 | 17.7 | +17.7 | ||
| Turnout | 1,094 | 32.0 | -6.4 | ||
| Conservative gain from UKIP | Swing | 29.1% UKIP to Con | |||
| Party | Candidate | Votes | % | ± | |
|---|---|---|---|---|---|
| Labour | David Balfe | 590 | 48.8 | +27.6 | |
| Conservative | James Funnell | 538 | 44.5 | +9.8 | |
| Green | Patrick Ginnelly | 40 | 3.3 | -3.3 | |
| Liberal Democrat | Raj Dooraree | 36 | 3.0 | -8.2 | |
| Majority | 52 | 4.3 | +4.3 | ||
| Turnout | 1,209 | 34.9 | -1.4 | ||
| Labour gain from Conservative | Swing | 8.9% Con to Lab | |||
| Party | Candidate | Votes | % | ± | |
|---|---|---|---|---|---|
| Conservative | David Simmons | 652 | 62.3 | +20.6 | |
| Labour | Stephen Gilbert | 290 | 27.7 | +10.8 | |
| Green | Julian Shinn | 69 | 6.6 | +1.5 | |
| Liberal Democrat | Nilda Dooraree | 33 | 3.2 | -1.4 | |
| Majority | 362 | 34.6 | +24.6 | ||
| Turnout | 1,047 | 30.4 | -7.0 | ||
| Conservative hold | Swing | 4.9% Lab to Con | |||
| Party | Candidate | Votes | % | ± | |
|---|---|---|---|---|---|
| Conservative | Carol Albury | 687 | 59.4 | +14.9 | |
| Labour | Douglas Bradley | 245 | 21.2 | +8.5 | |
| UKIP | Lionel Parsons | 97 | 8.4 | -25.4 | |
| Liberal Democrat | Peter Barnes | 67 | 5.8 | -3.2 | |
| Green | Margaret Rumble | 58 | 5.0 | +5.0 | |
| Majority | 442 | 38.2 | +27.5 | ||
| Turnout | 1,156 | 35.0 | -5.9 | ||
| Conservative hold | Swing | 20.2% UKIP to Con | |||
| Party | Candidate | Votes | % | ± | |
|---|---|---|---|---|---|
| Shoreham Beach Residents Association | David Collins | 726 | 52.7 | -3.5 | |
| Labour | Melanie Jenner | 340 | 24.7 | +15.0 | |
| Green | Andrew Bradbury | 250 | 18.2 | +8.5 | |
| UKIP | Peter Harvey | 55 | 4.0 | -14.8 | |
| Majority | 386 | 28.0 | -9.5 | ||
| Turnout | 1,377 | 38.0 | +1.3 | ||
| Shoreham Beach Residents Association hold | Swing | 9.3% SBRA to Lab | |||
| Party | Candidate | Votes | % | ± | |
|---|---|---|---|---|---|
| Labour | Lee Cowan | 535 | 49.0 | +40.9 | |
| Conservative | Joe Pannell | 309 | 28.3 | +5.7 | |
| Liberal Democrat | Doris Martin | 128 | 11.7 | -13.1 | |
| UKIP | Amanda Jones | 103 | 9.4 | -35.2 | |
| Green | Peter Groves | 15 | 1.4 | +1.4 | |
| Majority | 226 | 20.7 | +20.7 | ||
| Turnout | 1,092 | 32.1 | |||
| Labour gain from UKIP | Swing | 38.1% UKIP to Lab | |||
| Party | Candidate | Votes | % | ± | |
|---|---|---|---|---|---|
| Conservative | Brian Boggis | 562 | 57.2 | +18.1 | |
| Labour | Sylvia Knight | 250 | 25.5 | +5.8 | |
| UKIP | David Lewis | 81 | 8.2 | -26.8 | |
| Liberal Democrat | Diane Male | 81 | 8.2 | +1.8 | |
| Majority | 312 | 31.8 | +27.7 | ||
| Turnout | 982 | 28.5 | -6.3 | ||
| Conservative hold | Swing | 22.5% UKIP to Con | |||
| Party | Candidate | Votes | % | ± | |
|---|---|---|---|---|---|
| Labour | Lavinia O'Connor | 425 | 41.7 | +18.5 | |
| Conservative | Tony Nicklen | 414 | 40.7 | +8.0 | |
| Liberal Democrat | Keith Humphrey | 69 | 6.8 | +1.7 | |
| Green | Leslie Groves | 57 | 5.6 | +1.0 | |
| UKIP | Jean Turner | 52 | 5.1 | -29.3 | |
| Majority | 11 | 1.1 | +1.1 | ||
| Turnout | 1,018 | 32.1 | -4.5 | ||
| Labour gain from UKIP | Swing | 23.9% UKIP to Lab | |||
| Party | Candidate | Votes | % | ± | |
|---|---|---|---|---|---|
| Conservative | Stephen Chipp | 652 | 52.4 | +7.2 | |
| Labour | Sophie Brown | 468 | 37.6 | +18.8 | |
| Liberal Democrat | Ross Dowsett | 117 | 9.4 | +2.6 | |
| Majority | 184 | 14.8 | -9.6 | ||
| Turnout | 1,244 | 35.7 | -1.3 | ||
| Conservative hold | Swing | 5.8% Con to Lab | |||
| Party | Candidate | Votes | % | ± | |
|---|---|---|---|---|---|
| Labour | Catherine Arnold | 757 | 53.3 | +30.7 | |
| Conservative | Colin Head | 453 | 31.9 | -5.2 | |
| Green | Lynn Finnigan | 85 | 6.0 | -6.7 | |
| Liberal Democrat | David Batchelor | 79 | 5.6 | -0.8 | |
| UKIP | Darren Compton | 45 | 3.2 | -17.9 | |
| Majority | 304 | 21.4 | +21.4 | ||
| Turnout | 1,420 | 37.9 | +1.4 | ||
| Labour gain from Conservative | Swing | 18% Con to Lab | |||
| Party | Candidate | Votes | % | ± | |
|---|---|---|---|---|---|
| Conservative | Neil Parkin | 662 | 47.4 | -1.4 | |
| Labour | Adrienne Lowe | 440 | 31.5 | +16.2 | |
| Green | Louise Miller | 145 | 10.4 | -2.1 | |
| Liberal Democrat | Andrew Tinsley | 113 | 8.1 | +0.7 | |
| UKIP | Mike Henn | 35 | 2.5 | -13.5 | |
| Majority | 222 | 15.9 | -16.9 | ||
| Turnout | 1,398 | 44.7 | -0.6 | ||
| Conservative hold | Swing | 8.8% Con to Lab | |||
| Party | Candidate | Votes | % | ± | |
|---|---|---|---|---|---|
| Conservative | Andy McGregor | 740 | 47.6 | +13.1 | |
| Labour | Richard Aulton | 412 | 26.5 | +8.7 | |
| UKIP | Geoff Patmore | 236 | 15.2 | -24.2 | |
| Liberal Democrat | Sue Barnes | 160 | 10.3 | +2.0 | |
| Majority | 328 | 21.1 | +21.1 | ||
| Turnout | 1,553 | 33.0 | -5.1 | ||
| Conservative gain from UKIP | Swing | 18.7% UKIP to Con | |||
References
| West Sussex County Council | |
|---|---|
| Adur District Council | |
| Arun District Council | |
| Chichester District Council | |
| Crawley Borough Council | |
| Horsham District Council |
|
| Mid Sussex District Council | |
| Worthing Borough Council | |
| |
This article is issued from
Wikipedia.
The text is licensed under Creative Commons - Attribution - Sharealike.
Additional terms may apply for the media files.