New York gubernatorial elections
There have been 90 gubernatorial elections in the state of New York since 1777. The next one will be held on November 3, 2022.
| Elections in New York State | ||||||||||||
|---|---|---|---|---|---|---|---|---|---|---|---|---|
 | ||||||||||||
|
||||||||||||
|
|
||||||||||||
|
||||||||||||
General information
Originally the term was three years long and began on July 1, the election being held in the last week of April or May 1. In 1817, following the resignation of Daniel D. Tompkins after serving only eight months of his term, there was a new election, since the 1777 Constitution did not give the Lt. Gov. the right to succeed to the governor's office, and DeWitt Clinton was elected for a whole three-year-term. The New York State Constitutional Convention of 1821 reduced the term to two years – beginning on January 1 and ending on December 31 – and moved the election to the Tuesday after the first Monday in November. Due to this measure, DeWitt Clinton's own second term was cut short by half a year. Beginning with the election in 1876, the term was increased to three years again, beginning with the election in 1894 reduced to two years, and since the election in 1938 has its present duration of four years.
Although the candidates for Lieutenant Governor have always run on tickets with the governor's candidates, until the election of 1950 they were elected on separate ballots, so on several occasions (1826, 1846, 1850, 1906, and 1924) the governor and his lieutenant were elected of opposing tickets.
In only 15 of the total 89 elections the incumbent ran and was defeated.
The elected candidates are shown in bold face in the tables below.
Recent elections
2018
2014
| Party | Candidate | Votes | % | |
|---|---|---|---|---|
| Democratic | Andrew Cuomo | 2,069,480 | 54.2 | |
| Republican | Rob Astorino | 1,536,879 | 40.2 | |
| Green | Howie Hawkins | 184,419 | 4.9 | |
| Libertarian | Michael McDermott | 16,967 | 0.4 | |
| Sapient | Steven Cohn | 4,963 | 0.1 | |
| Scattering | 6,378 | 0.1 | ||
| Total votes | 3,930,310 | 100.0 | ||
2010
| Party | Candidate | Votes | % | |
|---|---|---|---|---|
| Democratic | Andrew Cuomo | 2,910,876 | 62.5 | |
| Republican | Carl Paladino | 1,547,757 | 33.2 | |
| Green | Howie Hawkins | 59,906 | 1.3 | |
| Libertarian | Warren Redlich | 48,359 | 1.0 | |
| Rent Is Too Damn High | Jimmy McMillan | 41,129 | 0.9 | |
| Freedom | Charles Barron | 24,571 | 0.5 | |
| Anti-Prohibition | Kristin M. Davis | 20,421 | 0.5 | |
| Scattering | 4,836 | 0.1 | ||
| Majority | 1,363,019 | 29.3 | ||
| Total votes | 4,616,836 | 100.0 | ||
2006

| Party | Candidate | Votes | % | |
|---|---|---|---|---|
| Democratic | Elliot Spitzer | 3,086,709 | 65.7 | |
| Republican | John Faso | 1,274,335 | 27.1 | |
| Green | Malachy McCourt | 42,166 | 0.9 | |
| Libertarian | John Clifton | 14,736 | 0.3 | |
| Rent Is Too Damn High | Jimmy McMillan | 13,355 | 0.3 | |
| Socialist Workers | Maura DeLuca | 5,919 | 0.1 | |
| Scattering | 116,622 | 5.6 | ||
| Total votes | 4,697,867 | 100.0 | ||
2002

| Party | Candidate | Votes | % | |
|---|---|---|---|---|
| Republican | George Pataki | 2,262,255 | 49.4 | |
| Democratic | Carl McCall | 1,534,064 | 33.5 | |
| Independence | B. Thomas Golisano | 654,016 | 14.3 | |
| Right to Life | Gerard J. Cronin | 44,195 | 1.0 | |
| Green | Stanley Aronowitz | 41,797 | 0.9 | |
| Marijuana Reform | Thomas K. Leighton | 21,977 | 0.5 | |
| Liberal | Andrew M. Cuomo | 15,761 | 0.3 | |
| Libertarian | Scott Jeffrey | 5,013 | 0.1 | |
| Total votes | 4,579,078 | 100.0 | ||
Older elections
1966-1998
Gubernatorial elections under the State Constitution of 1938. The term is four years.
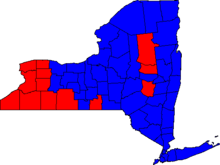
| Governor candidate | Running mate | Party | Votes |  In red are counties carried by Pataki and in blue are those carried by Vallone. The blue patch is NYC except Staten Island. | |
|---|---|---|---|---|---|
| George E. Pataki | Mary O. Donohue | Republican, Conservative |
2,571,991 | 54.32% | |
| Peter F. Vallone, Sr. | Sandra Frankel | Democrat, Working Families |
1,570,317 | 33.16% | |
| B. Thomas Golisano | Laureen Oliver | Independence | 364,056 | 7.69% | |
| Betsy McCaughey Ross | Jonathan C. Reiter | Liberal | 77,915 | 1.65% | |
| Michael Reynolds | Karen Prior | Right to Life | 56,683 | 1.20% | |
| Al Lewis | Alice Green | Green | 52,533 | 1.11% | |
| Thomas K. Leighton | Jeffrey C. Wright | Marijuana Reform | 24,788 | 0.52% | |
| Mary Alice France | Unity Party | 9,692 | 0.20% | ||
| Chris Garvey | Don Silberger | Libertarian | 4,722 | 0.10% | |
| Al Duncan | Ruth Robinett | Socialist Workers | 2,539 | 0.05% | |
Note: 4,985,932 ballots were cast in this election. Out of them, 250,696 were declared blank, void or missing.
| Governor candidate | Running mate | Party | Votes | |
|---|---|---|---|---|
| George E. Pataki | Betsy McCaughey Ross | Republican, Conservative, Tax Cut Now |
2,538,702 | 48.8% |
| Mario M. Cuomo | Stan Lundine | Democratic, Liberal |
2,364,904 | 45.4% |
| B. Thomas Golisano | Dominick Fusco | Independence Fusion | 217,490 | 4.1% |
| Robert T. Walsh | Virginia E. Sutton | Right to Life | 67,750 | 1.3% |
| Robert L. Schulz | Stan Dworkin | Libertarian | 9,506 | 0.2% |
| Lawrence Lane | May Nell Bockman | Socialist Workers | 5,410 | 0.1% |
| Governor candidate | Running mate | Party | Votes | |
|---|---|---|---|---|
| Mario M. Cuomo | Stan Lundine | Democratic, Liberal |
2,157,087 | 53.17% |
| Pierre Rinfret | George Yancey, Jr. | Republican | 865,948 | 21.35% |
| Herbert London | Anthony DiPerna | Conservative | 827,614 | 20.40% |
| Louis P. Wein | Gertrude G. Manning | Right to Life | 137,804 | 3.40% |
| Lenora Fulani | Ada I. Vazquez | New Alliance | 31,089 | 0.77% |
| W. Gary Johnson | Dottie Lou Brokaw | Libertarian | 24,611 | 0.61% |
| Craig Gannon | Susan Anmuth | Socialist Workers | 12,743 | 0.31% |
| Governor candidate | Running mate | Party | Votes | |
|---|---|---|---|---|
| Mario M. Cuomo | Stan Lundine | Democratic, Liberal |
2,775,045 | 64.63% |
| Andrew O'Rourke | E. Michael Kavanagh | Republican, Conservative |
1,363,968 | 31.77% |
| Denis Dillon | Thomas E. Drolesky | Right to Life | 130,827 | 3.05% |
| Lenora Fulani | Rafael Méndez | New Alliance | 24,135 | 0.56% |
| Governor candidate | Running mate | Party | Votes | |
|---|---|---|---|---|
| Mario M. Cuomo | Alfred DelBello | Democratic, Liberal |
2,675,213 | 50.91% |
| Lewis Lehrman | James L. Emery | Republican, Conservative, |
2,494,827 | 47.48% |
| Robert J. Bohner | Paul Callahan | Right to Life | 52,356 | 1.00% |
| John H. Northrup | David Hoesley | Libertarian | 16,913 | 0.32% |
| Jane Benedict | Angela M. Gilliam | Unity | 6,353 | 0.12% |
| Nancy Ross | Lenora Fulani | New Alliance | 5,277 | 0.10% |
| Diane Wang | Peter A. Thierjung | Socialist Workers | 3,766 | 0.07% |
| Governor candidate | Running mate | Party | Votes | |
|---|---|---|---|---|
| Hugh Carey | Mario M. Cuomo | Democratic, Liberal |
2,429,272 | 50.95% |
| Perry Duryea, Jr. | Bruce Caputo | Republican, Conservative |
2,156,404 | 45.22% |
| Mary Jane Tobin | Ellen McCormack | Right to Life | 130,193 | 2.73% |
| Gary Greenberg | James Franz | Libertarian | 18,990 | 0.40% |
| Dianne M. Feeley | Kevin E. Kellogg | Socialist Workers | 12,987 | 0.27% |
| Jarvis Tyner | Grace Mora-Newman | Communist | 11,400 | 0.24% |
| Paul Gallagher | J. Philip Rubinstein | Labor | 9,073 | 0.19% |
| Governor candidate | Running mate | Party | Votes | |
|---|---|---|---|---|
| Hugh Carey | Mary Anne Krupsak | Democratic, Liberal |
3,028,503 | 57.22% |
| Malcolm Wilson | Ralph G. Caso | Republican Conservative |
2,219,667 | 41.94% |
| Wayne S. Amato | Charles R. Schanger | Courage | 12,459 | 0.24% |
| Jerry Tuccille | Louis J. Sicilia | Free Libertarian | 10,503 | 0.20% |
| Derrick Morrison | James Mendietta | Socialist Workers | 8,857 | 0.17% |
| Jose A. Ristorucci | Carol A. Twigg | Communist | 5,232 | 0.10% |
| John Emanuel | (none) | Socialist Labor | 4,574 | 0.09% |
| Anton Chaitkin | Victoria Staton | Labor | 3,151 | 0.06% |
| Governor candidate | Running mate | Party | Votes | |
|---|---|---|---|---|
| Nelson A. Rockefeller | Malcolm Wilson | Republican, Civil Service Independent |
3,151,432 | 52.41% |
| Arthur Goldberg | Basil Paterson | Democratic, Liberal |
2,421,426 | 40.27% |
| Paul L. Adams | Edward F. Leonard | Conservative | 422,514 | 7.03% |
| Rasheed Storey | Grace Mora-Newman | Communist | 7,760 | 0.13% |
| Clifton DeBerry | Jonathan Rothschild | Socialist Workers | 5,766 | 0.10% |
| Stephen Emery | Arnold Babel | Socialist Labor | 3,963 | 0.07% |
Note: Prior to 2018, this election had the highest number of votes ever received by any Governor of NY.
| Governor candidate | Running mate | Party | Votes | |
|---|---|---|---|---|
| Nelson A. Rockefeller | Malcolm Wilson | Republican | 2,690,626 | 44.61% |
| Frank D. O'Connor | Howard J. Samuels | Democratic | 2,298,363 | 38.11% |
| Paul L. Adams | Kieran O'Doherty | Conservative | 510,023 | 8.46% |
| Franklin D. Roosevelt, Jr. | Donald S. Harrington | Liberal | 507,234 | 8.41% |
| Milton Herder | Doris Ballantyne | Socialist Labor | 12,730 | 0.21% |
| Judith White | Richard Garza | Socialist Workers | 12,506 | 0.21% |
1938-1962
| Governor candidate | Running mate | Party | Votes | |
|---|---|---|---|---|
| Nelson A. Rockefeller | Malcolm Wilson | Republican | 3,081587 | 53.08% |
| Robert M. Morgenthau | John J. Burns | Democratic, Liberal |
2,552,418 | 43.97% |
| David H. Jaquith | E. Vernon Carbonara | Conservative | 141,877 | 2.44% |
| Richard Garza | Sylvia Weinstein | Socialist Workers | 19,698 | 0.34% |
| Eric Hass | John Emanuel | Socialist Labor | 9,762 | 0.17% |
| Governor candidate | Running mate | Party | Votes | |
|---|---|---|---|---|
| Nelson A. Rockefeller | Malcolm Wilson | Republican | 3,126,929 | |
| W. Averell Harriman | George DeLuca | Democratic, Liberal |
2,553,895 | |
| John T. McManus | Annette T. Rubinstein | Independent-Socialist | 31,658 | |
| Eric Hass | John Emanuel | Socialist Labor | ||
| Governor candidate | Running mate | Party | Votes | |
|---|---|---|---|---|
| W. Averell Harriman | George DeLuca | Democratic, Liberal |
2,560,738 | 49.61% |
| Irving Ives | J. Raymond McGovern | Republican | 2,549,613 | 49.40% |
| John T. McManus | Karen Morley | American Labor | 46,886 | 0.91% |
| David L. Weiss | Dorothy Haines | Socialist Workers | 2,617 | 0.05% |
| Nathan Karp | Stephen Emery | Industrial Government | 1,720 | 0.03% |
| Governor candidate | Running mate | Party | Votes | |
|---|---|---|---|---|
| Thomas E. Dewey | Frank C. Moore | Republican | 2,819,523 | 53.11% |
| Walter A. Lynch | Richard H. Balch | Democratic, Liberal |
2,246,855 | 42.32% |
| John T. McManus | Clementina J. Paolone | American Labor | 221,966 | 4.18% |
| Michael Bartell | Gladys Barker | Socialist Workers | 13,274 | 0.25% |
| Eric Hass | Nathan Karp | Industrial Government | 7,254 | 0.14% |
| Governor candidate | Running mate | Party | Votes | |
|---|---|---|---|---|
| Thomas E. Dewey | Joe R. Hanley | Republican | 2,825,633 | 56.92% |
| James M. Mead | Erastus Corning 2nd | Democratic, Liberal, American Labor |
2,138,482 | 43.08% |
| Lieutenant Governor candidate | Party | Votes | |
|---|---|---|---|
| Joe R. Hanley | Republican | 1,846,314 | 55.29% |
| William N. Haskell | Democratic | 1,493,082 | 44.71% |
| Governor candidate | Running mate | Party | Votes | |
|---|---|---|---|---|
| Thomas E. Dewey | Thomas W. Wallace | Republican | 2,148,546 | 52.10% |
| John J. Bennett, Jr. | Charles Poletti | Democratic | 1,501,039 | 36.40% |
| Dean Alfange | Charles Poletti | American Labor | 403,626 | 9.79% |
| Israel Amter | (none) | Communist | 45,220 | 1.10% |
| Coleman B. Cheney | Samuel H. Friedman | Socialist | 21,911 | 0.53% |
| Aaron M. Orange | Bronko Papadopolos | Industrial Government | 3,496 | 0.08% |
| Governor candidate | Running mate | Party | Votes | |
|---|---|---|---|---|
| Herbert H. Lehman | Charles Poletti | Democratic, American Labor |
2,391,286 | 50.38% |
| Thomas E. Dewey | Frederic Holdrege Bontecou | Republican, Independent Progressive |
2,326,682 | 49.02% |
| Norman Thomas | George W. Hartmann | Socialist | 24,980 | 0.53% |
| Aaron M. Orange | Jacob Berlin | Industrial Government | 3,516 | 0.07% |
1894-1936
Gubernatorial elections under the State Constitution of 1894. The term was two years.
| Governor candidate | Running mate | Party | Votes | |
|---|---|---|---|---|
| Herbert H. Lehman | M. William Bray | Democratic, American Labor |
2,970,575 | 53.45% |
| William F. Bleakley | Ralph K. Robertson | Republican | 2,450,104 | 44.09% |
| Harry W. Laidler | Herman J. Hahn | Socialist | 96,233 | 1.73% |
| Robert Minor | Julian S. Sawyer | Communist | 40,406 | 0.73% |
| Governor candidate | Running mate | Party | Votes | |
|---|---|---|---|---|
| Herbert H. Lehman | M. William Bray | Democratic | 2,201,729 | 58.01% |
| Robert Moses | Fred James Douglas | Republican | 1,393,638 | 36.72% |
| Charles Solomon | Herman Kobbe | Socialist | 126,580 | 3.34% |
| Israel Amter | William J. Burroughs | Communist | 45,878 | 1.21% |
| William F. Varney | James F. Luckey | Law Preservation | 20,449 | 0.54% |
| Aaron M. Orange | Emil F. Teichert | Socialist Labor | 7,225 | 0.19% |
| Governor candidate | Running mate | Party | Votes | |
|---|---|---|---|---|
| Herbert H. Lehman | M. William Bray | Democratic | 2,659,519 | 56.69% |
| William J. Donovan | F. Trubee Davison | Republican | 1,812,080 | 38.62% |
| Louis Waldman | Charles W. Noonan | Socialist | 102,959 | 2.19% |
| John F. Vichert | H. Westlake Coon | Law Preservation | 83,452 | 1.78% |
| Israel Amter | Henry Shepard | Communist | 26,407 | 0.56% |
| Aaron M. Orange | Emil F. Teichert | Socialist Labor | 7,233 | 0.15% |
| Governor candidate | Running mate | Party | Votes | |
|---|---|---|---|---|
| Franklin D. Roosevelt | Herbert H. Lehman | Democratic | 1,770,342 | 56.49% |
| Charles H. Tuttle | Caleb Howard Baumes | Republican | 1,045,341 | 33.36% |
| Robert Paris Carroll | (none) | Law Preservation | 190,666 | 6.08% |
| Louis Waldman | Elizabeth C. Roth | Socialist | 100,444 | 3.21% |
| William Z. Foster | J. Louis Engdahl | Communist | 18,034 | 0.58% |
| Jeremiah D. Crowley | Charles M. Carlson | Socialist Labor | 9,096 | 0.29% |
| Governor candidate | Running mate | Party | Votes | |
|---|---|---|---|---|
| Franklin D. Roosevelt | Herbert H. Lehman | Democratic | 2,130,193 | 48.96% |
| Albert Ottinger | Charles C. Lockwood | Republican | 2,104,129 | 48.36% |
| Louis Waldman | Herman J. Hahn | Socialist | 101,859 | 2.34% |
| William F. Dunne | Franklin P. Brill | Workers | 10,741 | 0.25% |
| Charles H. Corregan | John E. DeLee | Socialist Labor | 4,213 | 0.10% |
| Governor candidate | Running mate | Party | Votes | |
|---|---|---|---|---|
| Alfred E. Smith | Edwin Corning | Democratic | 1,523,813 | 52.13% |
| Ogden L. Mills | Seymour Lowman | Republican | 1,276,137 | 43.80% |
| Jacob Panken | August Claessens | Socialist | 83,481 | 2.87% |
| Charles E. Manierre | Ella L. McCarthy | Prohibition | 21,285 | 0.73% |
| Benjamin Gitlow | Franklin P. Brill | Workers | 5,507 | 0.19% |
| Jeremiah D. Crowley | John E. DeLee | Socialist Labor | 3,553 | 0.12% |
| Governor candidate | Running mate | Party | Votes | |
|---|---|---|---|---|
| Alfred E. Smith | George R. Lunn | Democratic | 1,627,111 | 49.96% |
| Theodore Roosevelt, Jr. | Seymour Lowman | Republican | 1,518,552 | 46.63% |
| Norman Mattoon Thomas | Charles Solomon | Socialist | 99,854 | 3.07% |
| James P. Cannon | Franklin P. Brill | Workers | 6,395 | 0.20% |
| Frank E. Passanno | Milton Weinberger | Socialist Labor | 4,931 | 0.15% |
Note: This was the last time the running mate of the elected governor was defeated, Democrat Smith having Republican Lowman as lieutenant for the duration of this term.
| Governor candidate | Running mate | Party | Votes | |
|---|---|---|---|---|
| Alfred E. Smith | George R. Lunn | Democratic | 1,397,670 | 55.22% |
| Nathan L. Miller | William J. Donovan | Republican | 1,011,725 | 39.98% |
| Edward F. Cassidy | Theresa B. Wiley | Socialist, Farmer–Labor |
108,136 | 4.27% |
| George K. Hinds | William C. Ramsdell | Prohibition | 9,561 | 0.38% |
| Jeremiah D. Crowley | John E. DeLee | Socialist Labor | 3,799 | 0.15% |
| Governor candidate | Running mate | Party | Votes | |
|---|---|---|---|---|
| Nathan L. Miller | Jeremiah Wood | Republican | 1,335,878 | 46.58% |
| Alfred E. Smith | George R. Fitts | Democratic | 1,261,812 | 44.00% |
| Joseph D. Cannon | Jessie Wallace Hughan | Socialist | 159,804 | 5.57% |
| Dudley Field Malone | Robert E. Haffey | Farmer–Labor | 69,908 | 2.44% |
| George F. Thompson | Edward G. Dietrich | Prohibition | 35,509 | 1.24% |
| John P. Quinn | Jeremiah D. Crowley | Social Labor | 5,015 | 0.17% |
Notes:
| Governor candidate | Running mate | Party | Votes | |
|---|---|---|---|---|
| Alfred E. Smith | Harry C. Walker | Democratic | 1,009,936 | 47.37% |
| Charles S. Whitman | Edward Schoeneck (Republican), Mamie W. Colvin (Prohibition) |
Republican, Prohibition |
995,094 | 46.68% |
| Charles Wesley Ervin | Ella Reeve Bloor | Socialist | 121,705 | 5.71% |
| Olive M. Johnson | August Gillhaus | Socialist Labor | 5,183 | 0.24% |
Notes:
- This was the first time women voted for governor of New York, and Alfred E. Smith was the first governor elected with more than 1 million votes.
- Election result in NYT on December 31, 1918
| Governor candidate | Running mate | Party | Votes | |
|---|---|---|---|---|
| Charles S. Whitman | Edward Schoeneck (Republican), L. Bradley Dorr (Progressive), Thomas J. Kreuzer (American) |
Republican, Progressive, American |
850,020 | 52.63% |
| Samuel Seabury | Thomas J. Kreuzer | Democratic | 686.862 | 42.53% |
| Algernon Lee | Stephen J. Mahoney | Socialist | 52,560 | 3.25% |
| Charles E. Welch | Clarence Z. Spriggs | Prohibition | 21,773 | 1.35% |
| Jeremiah D. Crowley | Boris Reinstein | Socialist Labor | 3,847 | 0.24% |
| Governor candidate | Running mate | Party | Votes | |
|---|---|---|---|---|
| Charles S. Whitman | Edward Schoeneck | Republican | 686,701 | 47.69% |
| Martin H. Glynn | Thomas B. Lockwood | Democratic, Independence League |
541,269 | 37.59% |
| William Sulzer | Charles E. Welch | American, Prohibition |
126,270 | 8.77% |
| Frederick Morgan Davenport | Chauncey J. Hamlin | Progressive | 45,586 | 3.17% |
| Gustave Adolph Strebel | Stephen J. Mahoney | Socialist | 37,793 | 2.62% |
| James F. Hunter | Jeremiah D. Crowley | Socialist Labor | 2,350 | 0.16% |
Note: William Sulzer had been elected governor as a Democrat at the previous election, but was impeached. Martin Glynn had been elected Lt. Gov and succeeded to the governorship upon Sulzer's impeachment.
| Governor candidate | Running mate | Party | Votes | |
|---|---|---|---|---|
| William Sulzer | Martin H. Glynn | Democratic | 649,559 | 41.46% |
| Job E. Hedges | James W. Wadsworth, Jr. | Republican | 444,105 | 28.35% |
| Oscar Solomon Straus | Frederick Morgan Davenport | Independence League, Progressive |
393,183 | 25.10% |
| Charles Edward Russell | Gustave A. Strebel | Socialist | 56,917 | 3.63% |
| T. Alexander MacNicholl | Clark Allis | Prohibition | 18,990 | 1.21% |
| John Hall | Jeremiah D. Crowley | Socialist Labor | 3,792 | 0.24% |
| Governor candidate | Running mate | Party | Votes | |
|---|---|---|---|---|
| John Alden Dix | Thomas F. Conway | Democratic | 689,700 | 48.00% |
| Henry L. Stimson | Edward Schoeneck | Republican | 622,299 | 43.31% |
| Charles Edward Russell | Gustave A. Strebel | Socialist | 48,529 | 3.38% |
| John J. Hopper | William Randolph Hearst | Independence League | 48,470 | 3.37% |
| T. Alexander MacNicholl | Calvin McCarthy | Prohibition | 22,295 | 1.55% |
| Frank E. Passanno | James F. Hunter | Socialist Labor | 5,717 | 0.40% |
Note: election result, in NYT on December 16, 1910
| Governor candidate | Running mate | Party | Votes | |
|---|---|---|---|---|
| Charles Evans Hughes | Horace White | Republican | 804,651 | 49.08% |
| Lewis S. Chanler | John Alden Dix | Democratic | 735,189 | 44.84% |
| Clarence J. Shearn | Daniel W. Finnimore | Independence League | 43,212 | 2.64% |
| Joshua Wanhope | Gustave A. Strebel | Socialist | 33,994 | 2.07% |
| George E. Stockwell | Marshall A. Hudson | Prohibition | 18,802 | 1.15% |
| Leander A. Armstrong | Frank E. Passanno | Socialist Labor | 3,655 | 0.22% |
| Governor candidate | Running mate | Party | Votes | |
|---|---|---|---|---|
| Charles Evans Hughes | M. Linn Bruce | Republican | 749,002 | 50.52% |
| William Randolph Hearst | Lewis S. Chanler | Democratic, Independence League |
691,105 | 46.62% |
| John C. Chase | Gustave A. Strebel | Socialist | 21,751 | 1.47% |
| Henry M. Randall | Freeman H. Bettys | Prohibition | 15,985 | 1.08% |
| Thomas H. Jackson | Frank E. Passanno | Socialist Labor | 4,624 | 0.31% |
| Governor candidate | Running mate | Party | Votes | |
|---|---|---|---|---|
| Frank W. Higgins | M. Linn Bruce | Republican | 813,264 | 50.27% |
| D. Cady Herrick | Francis B. Harrison | Democratic | 732,704 | 45.29% |
| Thomas Pendergast | Charles R. Bach | Social Democratic | 36,259 | 2.24% |
| John McKee | Alden W. Young | Prohibition | 20,568 | 1.27% |
| Daniel De Leon | Boris Reinstein | Socialist Labor | 8,976 | 0.55% |
| Alfred J. Boulton | Charles Spaulding | People's Party | 6,015 | 0.37% |
| Governor candidate | Running mate | Party | Votes | |
|---|---|---|---|---|
| Benjamin B. Odell, Jr. | Frank W. Higgins | Republican | 665,150 | 48.09% |
| Bird Sim Coler | Charles N. Bulger | Democratic | 656,347 | 47.45% |
| Benjamin Hanford | William Thurston Brown | Social Democratic | 23,400 | 1.69% |
| Alfred Lee Manierre | John A. Hartman | Prohibition | 20,490 | 1.48% |
| Daniel De Leon | Socialist Labor | 15,886 | 1.15% | |
| Edgar Lee Ryder | J. C. Corbin | Liberal Democratic | 1,894 | 0.14% |
| Governor candidate | Running mate | Party | Votes | |
|---|---|---|---|---|
| Benjamin B. Odell, Jr. | Timothy L. Woodruff | Republican | 804,859 | 51.97% |
| John B. Stanchfield | William F. Mackey | Democratic | 693,733 | 44.80% |
| William T. Wardwell | Albert J. Rumsey | Prohibition | 22,704 | 1.47% |
| Charles H. Corregan | Leander A. Armstrong | Socialist Labor | 13,762 | 0.89% |
| Benjamin Hanford | William Butscher | Social Democratic | 13,493 | 0.87% |
| Governor candidate | Running mate | Party | Votes | |
|---|---|---|---|---|
| Theodore Roosevelt | Timothy L. Woodruff | Republican | 661,707 | 49.02% |
| Augustus Van Wyck | Elliott Danforth | Democratic | 643,921 | 47.70% |
| Benjamin Hanford | Leander A. Armstrong | Socialist Labor | 23,860 | 1.77% |
| John Kline | John A. Sayles | Prohibition | 18,383 | 1.36% |
| Theodore Bacon | Thomas M. Osborne | Citizens Union | 2,103 | 0.16% |
| Governor candidate | Running mate | Party | Votes | |
|---|---|---|---|---|
| Frank S. Black | Timothy L. Woodruff | Republican | 787,516 | 52.63% |
| Wilbur F. Porter | Frederick C. Schraub | Democratic, People's |
574,524 | 40.33% |
| Daniel G. Griffin | Frederick W. Hinrichs | National Democratic | 26,698 | 1.87% |
| Howard Balkam | Frederick Bennets | Socialist Labor | 18,362 | 1.29% |
| William W. Smith | Charles E. Latimer | Prohibition | 17,419 | 1.22% |
Note: The majority faction of the Democratic Party were then known as "Silver Democrats", and the "National Democrats" were the "Gold Democrats".[5]
| Governor candidate | Running mate | Party | Votes | |
|---|---|---|---|---|
| Levi P. Morton | Charles T. Saxton | Republican | 673,818 | 47.69% |
| David B. Hill | Daniel N. Lockwood | Democratic | 517,710 | 40.79% |
| Everett P. Wheeler | Daniel N. Lockwood | Democratic Reform | 27,202 | 2.14% |
| Francis E. Baldwin | Justus Miller | Prohibition | 23,525 | 1.85% |
| Charles H. Matchett | William F. Steer | Socialist Labor | 15,868 | 1.25% |
| Charles B. Matthews | Robert C. Hewson | People's | 11,049 | 0.87% |
Notes:
- Wheeler was nominated by the "Democratic Reform Association of Brooklyn" who were opposed to the regular Democrats led by Hugh McLaughlin.
- Election result in NYT on December 15, 1894
1876-1891
Gubernatorial elections under the State Constitution of 1846, amended in 1874. The term was three years.
| Governor candidate | Running mate | Party | Votes | |
|---|---|---|---|---|
| Roswell P. Flower | William F. Sheehan | Democratic | 582,893 | 50.13% |
| Jacob S. Fassett | John W. Vrooman | Republican | 534,956 | 46.00% |
| Joseph W. Bruce | George W. Hallock (d. 1895)[6] | Prohibition | 30,353 | 2.61% |
| Daniel DeLeon | Frank Gesser | Socialist Labor | 14,651 | 1.26% |
| Governor candidate | Running mate | Party | Votes | |
|---|---|---|---|---|
| David B. Hill | Edward F. Jones | Democratic | 650,464 | 49.45% |
| Warner Miller | Stephen Van Rensselaer Cruger (Republican), John H. Blakeney (United Labor);[7][8] |
Republican, United Labor Party |
631,293 | 48.00% |
| W. Martin Jones | George F. Powell | Prohibition | 30,215 | 2.30% |
| J. Edward Hall | Christian Pattberg | Socialist Labor[9] | 3,348 | 0.25% |
| Governor candidate | Running mate | Party | Votes | |
|---|---|---|---|---|
| David B. Hill | Edward F. Jones | Democratic | 501,465 | 48.93% |
| Ira Davenport | Joseph Bradford Carr | Republican | 490,331 | 47.85% |
| Henry Clay Bascom | W. Jennings Demorest | Prohibition | 30,867 | 3.01% |
| George O. Jones | Lyman W. Gage | National Greenback-Labor | 2,130 | 0.21% |
| Governor candidate | Running mate | Party | Votes | |
|---|---|---|---|---|
| Grover Cleveland | David B. Hill | Democratic | 535,318 | 58.47% |
| Charles J. Folger | B. Platt Carpenter | Republican | 342,464 | 37.41% |
| Alphonso A. Hopkins | William H. Boole | Prohibition | 25,783 | 2.82% |
| Epenetus Howe | James Allen | National Greenback-Labor | 11,974 | 1.31% |
| Governor candidate | Running mate | Party | Votes | |
|---|---|---|---|---|
| Alonzo B. Cornell | George Gilbert Hoskins | Republican | 418,567 | |
| Lucius Robinson | Clarkson N. Potter | Democratic | 375,790 | |
| John Kelly | Clarkson N. Potter (Tammany Hall), John M. Wieting (Working Men), Robert W. Hume (Jeffersonian Democratic) |
Tammany Hall, Working Men, Jeffersonian Democratic |
77,566 | |
| Harris Lewis | John M. Wieting | Greenback-Labor | 20,286 | |
| John W. Mears | James H. Bronson | Prohibition | 4,437 | |
| Caleb Pink | Osborne Ward | Socialist Labor | ||
| Governor candidate | Running mate | Party | Votes | |
|---|---|---|---|---|
| Lucius Robinson | William Dorsheimer | Democratic | 519,831 | 51.97% |
| Edwin D. Morgan | Sherman S. Rogers | Republican | 489,371 | 48.26% |
| William J. Groo | Albert F. Brown | Prohibition | 3,412 | 0.34% |
| Richard Montgomery Griffin [10] | Thomas Armstrong [11] | Greenback | 1,436 | 0.14% |
1847-1874
Gubernatorial elections under the State Constitution of 1846. The term was two years.
| Governor candidate | Running mate | Party | Votes | |
|---|---|---|---|---|
| Samuel Jones Tilden | William Dorsheimer | Democratic | 416,391 | 52.43% |
| John Adams Dix | John Cleveland Robinson | Republican | 366,074 | 46.09% |
| Myron Holley Clark | James L. Bagg [12] | Prohibition | 11,768 | 1.48% |
| Governor candidate | Running mate | Party | Votes | |
|---|---|---|---|---|
| John Adams Dix | John Cleveland Robinson | Republican | 445,801 | 53.19% |
| Francis Kernan | Chauncey M. Depew | Democratic, Liberal Republican |
392,350 | 46.81% |
| Governor candidate | Running mate | Party | Votes | |
|---|---|---|---|---|
| John Thompson Hoffman | Allen C. Beach | Democratic | 399,490 | 52.19% |
| Stewart L. Woodford | Sigismund Kaufman | Republican | 366,424 | 47.84% |
The tickets: in NYT on October 30, 1870
| Governor candidate | Running mate | Party | Votes | |
|---|---|---|---|---|
| John Thompson Hoffman | Allen C. Beach | Democratic | 439,301 | 51.64% |
| John Augustus Griswold | Alonzo B. Cornell | Republican | 48.36% | |
| Governor candidate | Running mate | Party | Votes | |
|---|---|---|---|---|
| Reuben E. Fenton | Stewart L. Woodford | Republican | 366,315 | 50.96% |
| John Thompson Hoffman | Robert H. Pruyn | Conservative Union | 352,526 | 49.04% |
Note: John T. Hoffman was a Democrat, Robert H. Pruyn a Republican. The "Conservative Union" ticket was nominated by the Democrats in an attempt to attract Republicans, especially Democrats who had joined the Republican Union and remained Republicans after the Civil War, to return to the Democratic Party.[13]
| Governor candidate | Running mate | Party | Votes | |
|---|---|---|---|---|
| Reuben E. Fenton | Thomas G. Alvord | Republican Union | 369,557 | 50.57% |
| Horatio Seymour | David R. Floyd-Jones | Democratic | 361,264 | 49.43% |
| Governor candidate | Running mate | Party | Votes | |
|---|---|---|---|---|
| Horatio Seymour | David R. Floyd-Jones | Democratic | 306,649 | 50.89% |
| James S. Wadsworth | Lyman Tremain | Republican Union | 295,897 | 49.11% |
Note:
- Horatio Seymour was the candidate of the Democratic Party that wanted to end the war.[14]
- James Wadsworth was a Republican, Lyman Tremain a pre-war Democrat, nominated by the Republican Union in which the Republican Party was joined by the War Democrats who supported Lincoln and the Union.
- The total of ballots cast were more than 70,000 less than in the previous election because the soldiers in the field were not allowed to vote.
| Governor candidate | Running mate | Party | Votes | |
|---|---|---|---|---|
| Edwin D. Morgan | Robert Campbell | Republican | 358,272 | 53.24% |
| William Kelly | William C. Crain | Douglas Democracy | 294,812 | 43.81% |
| James T. Brady | Henry K. Viele | Breckinridge Democracy | 19,841 | 2.95% |
Note:
- William Kelly was the candidate of the majority faction of the Democratic Party which supported Stephen A. Douglas for President.[15]
- James T. Brady was a member of Tammany Hall, nominated by the minority faction of the Democratic Party which supported John C. Breckinridge for President.[16]
| Governor candidate | Running mate | Party | Votes | |
|---|---|---|---|---|
| Edwin D. Morgan | Robert Campbell | Republican | 257,953 | 45.49% |
| Amasa J. Parker | John J. Taylor | Democratic | 230,513 | 42.29% |
| Lorenzo Burrows | Nathaniel S. Benton | American | 61,137 | 11.22% |
| Gerrit Smith | Sidney A. Beers | Abolitionist[17] | 5,470 | 1.00% |
| Governor candidate | Running mate | Party | Votes | |
|---|---|---|---|---|
| John Alsop King | Henry R. Selden | Republican | 264,400 | 44.52% |
| Amasa J. Parker | John Vanderbilt | Democratic | 198,616 | 33.44% |
| Erastus Brooks | Lyman Odell | American | 130,870 | 22.04% |
| Governor candidate | Running mate | Party | Votes | |
|---|---|---|---|---|
| Myron H. Clark | Henry J. Raymond (Whig, Anti-Nebraska, Temperance), Bradford R. Wood (Anti-Rent, Free Democratic) |
Whig, Anti-Nebraska, Anti-Rent, Free Democratic, Temperance |
156,804 | 33.38% |
| Horatio Seymour | William H. Ludlow | Democratic (Soft) | 156,495 | 33.32% |
| Daniel Ullmann | Gustavus Adolphus Scroggs | American | 122,282 | 26.03% |
| Greene C. Bronson | Elijah Ford | Democratic (Hard) | 33,850 | 7.21% |
| William Goodell | Austin Ward | Liberty | 289 | 0.06% |
Notes:
- Result: Official State Canvass in NYT on December 21, 1854 (William Goodell's votes were counted among the "scattering votes").
- Myron H. Clark won this election with the lowest percentage ever in NY Gov. elections, nominated by the Whigs (of which party he was a member), and endorsed by the Anti-Nebraska Party [18] (which merged in 1855 with the Whigs to form the Republican Party), the Anti-Rent Party,[19] the "Free Democrats" [20] (the remnants of the Free-Soil Party with radical anti-slavery Democrats), and the supporters of Temperance.[21]
- The "Soft" or "Soft-shell" candidate was the choice of the majority faction of the Democratic Party.
- The American Party was called "Know Nothing" in contemporaneous newspapers.
- The "National Democracy" (a faction of the Democratic Party) were called "Hards" or "Hard-shells" by contemporaneous newspapers.
- Liberty Party convention in NYT on September 29, 1854
| Governor candidate | Running mate | Party | Votes | |
|---|---|---|---|---|
| Horatio Seymour | Sanford E. Church | Democratic | 264,121 | 50.31% |
| Washington Hunt | William Kent | Whig | 241,525 | 46.01% |
| Minthorne Tompkins | Seth Merrill Gates | Free Democratic | 19,296 | 3.68% |
| Governor candidate | Running mate | Party | Votes | |
|---|---|---|---|---|
| Washington Hunt | George J. Cornell (Whig) Sanford E. Church (Anti-Rent) |
Whig, Anti-Rent |
214,614 | 49.64% |
| Horatio Seymour | Sanford E. Church | Democratic | 214,352 | 49.57% |
| William L. Chaplin | Joseph Plumb 1791–1870) | Liberty | 3,416 | 0.79% |
| Governor candidate | Running mate | Party | Votes | |
|---|---|---|---|---|
| Hamilton Fish | George Washington Patterson | Whig | 218,776 | 47.56% |
| John Adams Dix | Seth Merrill Gates | Democratic (Barnburner), Free Soil |
122,811 | 26.70% |
| Reuben H. Walworth | Charles O'Conor | Democratic (Hunker) | 116,811 | 25.39% |
| William Goodell | Robert Anderson | Liberty | 1,593 | 0.35% |
| Lieutenant Governor candidate | Party | Votes | |
|---|---|---|---|
| Hamilton Fish | Whig | 170,072 | 52.63% |
| Nathan Dayton | Democratic | 139,623 | 43.21% |
| Charles O. Shepard | Liberty, Anti-Rent |
13,429 | 4.16% |
Note:
- At the first judicial election under the Constitution of 1846, Addison Gardiner was elected in June 1847 to the Court of Appeals, to take office on July 1, 1847. To fill the vacancy, on September 27, a special election was scheduled by the State Legislature to be held at the annual state election.[22]
- Result Manual of the Corporation of the City of New York (1852)
1822-1846
Gubernatorial elections under the State Constitution of 1821. The term was two years. Until 1840, elections were held during three days beginning on the first Monday in November. Since 1841, until today, all regular elections have been held on the Tuesday after the first Monday in November. The elected candidate takes office on January 1 of the following calendar year.
| Governor candidate | Running mate | Party | Votes | |
|---|---|---|---|---|
| John Young | Hamilton Fish (Whig) Addison Gardiner (Anti-Rent) |
Whig, Anti-Rent |
198,878 | 49.07% |
| Silas Wright | Addison Gardiner | Democratic | 187,306 | 46.21% |
| Henry Bradley | William L. Chaplin | Liberty, National Reform |
12,844 | 3.17% |
| Ogden Edwards | George Folsom | Native American | 6,305 | 1.56% |
| Governor candidate | Running mate | Party | Votes | |
|---|---|---|---|---|
| Silas Wright | Addison Gardiner | Democratic | 241,090 | 49.48% |
| Millard Fillmore | Samuel J. Wilkin | Whig | 231,057 | 47.42% |
| Alvan Stewart | Charles O. Shepard | Liberty | 15,136 | 3.11% |
| Governor candidate | Running mate | Party | Votes | |
|---|---|---|---|---|
| William C. Bouck | Daniel S. Dickinson | Democratic | 208,072 | 51.83% |
| Luther Bradish | Gabriel Furman | Whig | 186,091 | 46.36% |
| Alvan Stewart | Charles O. Shepard | Liberty | 7,263 | 1.81% |
| Governor candidate | Running mate | Party | Votes | |
|---|---|---|---|---|
| William H. Seward | Luther Bradish | Whig | 222,011 | 50.29% |
| William C. Bouck | Daniel S. Dickinson | Democratic | 216,808 | 49.11% |
| Gerrit Smith | Charles O. Shepard | Liberty | 2,662 | 0.60% |
| Governor candidate | Running mate | Party | Votes | |
|---|---|---|---|---|
| William H. Seward | Luther Bradish | Whig | 192,882 | 51.39% |
| William L. Marcy | John Tracy | Democratic | 182,461 | 48.61% |
| Governor candidate | Running mate | Party | Votes | |
|---|---|---|---|---|
| William L. Marcy | John Tracy | Democratic | 166,122 | 54.24% |
| Jesse Buel | Gamaliel H. Barstow | Whig | 136,648 | 44.62% |
| Isaac S. Smith | Moses Jaques | Equal Rights | 3,496 | 1.14% |
- Result Manual of the Corporation of the City of New York 1852) (giving wrong number of votes for Smith, "2496" is a typo)
- see also The History of the Loco-foco, Or Equal Rights Party: Its Movements, Conventions and Proceedings by Fitzwilliam Byrdsall (Clement & Packard, 1842)
| Governor candidate | Running mate | Party | Votes | |
|---|---|---|---|---|
| William L. Marcy | John Tracy | Democratic | 181,905 | 51.84% |
| William H. Seward | Silas M. Stilwell | Whig | 168,969 | 48.16% |
| Governor candidate | Running mate | Party | Votes | |
|---|---|---|---|---|
| William L. Marcy | John Tracy | Democratic | 166,410 | 51.51% |
| Francis Granger | Samuel Stevens | Anti-Masonic, National Republican |
156,672 | 48.49% |
| Governor candidate | Running mate | Party | Votes | |
|---|---|---|---|---|
| Enos T. Throop | Edward Philip Livingston | Democratic | 128,842 | 51.22% |
| Francis Granger | Samuel Stevens | Anti-Masonic, National Republican |
120,361 | 47.85% |
| Ezekiel Williams | Isaac S. Smith | Workingmen's | 2,332 | 0.93% |
| Governor candidate | Running mate | Party | Votes | |
|---|---|---|---|---|
| Martin Van Buren | Enos T. Throop | Democratic | 136,794 | 49.46% |
| Smith Thompson | Francis Granger | National Republican | 106,444 | 38.49% |
| Solomon Southwick | John Crary | Anti-Masonic | 33,345 | 12.06% |
| Governor candidate | Running mate | Party | Votes | |
|---|---|---|---|---|
| DeWitt Clinton | Henry Huntington | Democratic-Republican (Clintonian) | 99,785 | 50.93% |
| William B. Rochester | Nathaniel Pitcher | Democratic-Republican (Bucktails) | 96,135 | 49.07% |
| Governor candidate | Running mate | Party | Votes | |
|---|---|---|---|---|
| DeWitt Clinton | James Tallmadge, Jr. | People's | 103,452 | 54.29% |
| Samuel Young | Erastus Root | Democratic-Republican | 87,093 | 45.71% |
| Governor candidate | Running mate | Party | Votes | |
|---|---|---|---|---|
| Joseph C. Yates | Erastus Root (Bucktails), Henry Huntingto (Clintonian)[23] |
Democratic-Republican | 128,293 | 97.78% |
| Solomon Southwick | (none) | Independent | 2,913 | 2.22% |
- Result: The New Annual Register, Or General Repository of History, Politics, and Literature, for the Year 1823 by Andrew Kippis, William Godwin, George Robinson, G. G. and J. Robinson (Paternoster Row, London, England, 1824)
1777-1820
Gubernatorial elections under the State Constitution of 1777. The term was three years, the election held in the last week of April or on May 1.
| Governor candidate | Running mate | Party | Votes | |
|---|---|---|---|---|
| DeWitt Clinton | John Tayler | Democratic-Republican (Clintonian) | 47,445 | 50.78% |
| Daniel D. Tompkins | Benjamin Mooers | Democratic-Republican (Bucktails) | 45,990 | 49.22% |
Note:
- Tompkins was the sitting US Vice President.
- DeWitt Clinton was legislated out of office on December 31, 1822.
| Governor candidate | Running mate | Party | Votes | |
|---|---|---|---|---|
| DeWitt Clinton | John Tayler | Democratic-Republican | 43,310 | 96.70% |
| Peter Buell Porter | (none) | Tammany Hall[24] | 1,479 | 3.30% |
Note: Governor Tompkins was elected US Vice President in November 1816, and he resigned in February 1817. Article XVII of the New York State Constitution of 1777 said that "...as often as the seat of government shall become vacant, a wise and descreet freeholder of this State shall be, by ballot, elected governor,... which elections shall be always held at the times and places of choosing representatives in assembly..." This meant that, whenever a vacancy occurred, the Lt. Gov. did not succeed to the governor's office but administrated the state only until the end of the yearly term of the New York State Assembly on June 30, the successor being elected in April.
| Governor candidate | Running mate | Party | Votes | |
|---|---|---|---|---|
| Daniel D. Tompkins | John Tayler | Democratic-Republican | 45,412 | 54.02% |
| Rufus King | George Tibbits | Federalist | 38,647 | 45.98% |
| Governor candidate | Running mate | Party | Votes | |
|---|---|---|---|---|
| Daniel D. Tompkins | John Tayler | Democratic-Republican | 43,324 | 52.17% |
| Stephen Van Rensselaer | George Huntington | Federalist | 39,718 | 47.83% |
| Lieutenant Governor candidate | Party | Votes | |
|---|---|---|---|
| DeWitt Clinton | Democratic-Republican | 32,747 | 50.37% |
| Nicholas Fish | Federalist | 29,046 | 44.68% |
| Marinus Willett | Tammany Hall | 3,218 | 4.95% |
Note: Lt. Gov. Broome died in August 1810, and the 1777 Constitution provided for new elections if a vacancy occurred either in the Governor's or the Lieutenant Governor's office. See 1817 general election.
| Governor candidate | Running mate | Party | Votes | |
|---|---|---|---|---|
| Daniel D. Tompkins | John Broome | Democratic-Republican | 43,094 | 54.15% |
| Jonas Platt | Nicholas Fish | Federalist | 36,484 | 45.85% |
| Governor candidate | Running mate | Party | Votes | |
|---|---|---|---|---|
| Daniel D. Tompkins | John Broome | Democratic-Republican (Clintonian) | 35,074 | 53.09% |
| Morgan Lewis | Thomas Storm | Democratic-Republican (Lewisites) | 30,989 | 46.91% |
| Governor candidate | Running mate | Party | Votes | |
|---|---|---|---|---|
| Morgan Lewis | John Broome | Democratic-Republican (Clintonian) | 30,829 | 58.20% |
| Aaron Burr | Oliver Phelps | Democratic-Republican (Tammany Hall) Federalist |
22,139 | 41.80% |
Note: Aaron Burr was the sitting US Vice President.
| Governor candidate | Running mate | Party | Votes | |
|---|---|---|---|---|
| George Clinton | Jeremiah Van Rensselaer | Democratic-Republican | 24,808 | 54.34% |
| Stephen Van Rensselaer | James Watson | Federalist | 20,843 | 45.66% |
| Governor candidate | Running mate | Party | Votes | |
|---|---|---|---|---|
| John Jay | Stephen Van Rensselaer | Federalist | 16,012 | 54.01% |
| Robert R. Livingston | Stephen Van Rensselaer | Democratic-Republican | 13,632 | 45.99% |
| Governor candidate | Running mate | Party | Votes | |
|---|---|---|---|---|
| John Jay | Stephen Van Rensselaer | Federalist | 13,479 | 53.14% |
| Robert Yates | William Floyd | Democratic-Republican | 11,884 | 46.86% |
| Governor candidate | Running mate | Party | Votes | |
|---|---|---|---|---|
| George Clinton | Pierre Van Cortlandt | Democratic-Republican | 8,440 | 50.32% |
| John Jay | Stephen Van Rensselaer | Federalist | 8,332 | 49.68% |
Note: John Jay received more votes than George Clinton, but on technicalities the votes of Otsego, Tioga and Clinton counties were disqualified and not counted, giving Clinton a slight majority. Under the Constitution of 1777, the votes were canvassed by a joint committee of the state legislature, six members each from the assembly and the senate. The members were David Gelston, Thomas Tillotson, Melancton Smith, David Graham, Pierre Van Cortlandt, Jr., David McCarty, Jonathan N. Havens, Samuel Jones, Isaac Roosevelt, Leonard Gansevoort, and Joshua Sands. The state constitution said that the cast votes shall be delivered to the secretary of state "by the sheriff or his deputy". The ballots from Otsego County were forwarded to the secretary of state by Sheriff Smith who was holding over in office until the appointment of a successor after his term had expired. The ballot box from Clinton County was delivered to the secretary of state's office by a person without deputation who had received the box from the sheriff. The ballot box from Tioga County was delivered to the secretary of state by the clerk of the special deputy appointed by the sheriff. The canvass committee disagreed on whether to allow these ballots to be counted. The question was referred to the U.S. Senators from New York, Federalist Rufus King and Dem.-Rep. Aaron Burr, for arbitration. King said all votes ought to be canvassed. Burr said that the ballots from Clinton County ought to be allowed, and the ones from Otsego and Tioga Counties should be rejected. Thereupon, a majority of the canvass committee (Gelston, Tillotson, Smith, Graham, Van Cortlandt, McCarty, and Havens) rejected the ballots from all three counties and declared George Clinton duly elected governor by a majority of 108 votes. The minority (Jones, Roosevelt, Gansevoort, and Sands) protested in writing. In Otsego County, John Jay had a majority of about 400, and discounting the small majorities for Clinton in Tioga and Clinton Counties, would have won the election. Clinton was accused by the Federalists of usurpation and the canvass committee of having made a partisan decision against the wishes of the electorate.[25]
| Governor candidate | Running mate | Party | Votes | |
|---|---|---|---|---|
| George Clinton | Pierre Van Cortlandt | Democratic-Republican | 6,391 | 51.74% |
| Robert Yates | Pierre Van Cortlandt | Federalist | 5,962 | 48.26% |
| Governor candidate | Running mate | Votes | |
|---|---|---|---|
| George Clinton | Pierre Van Cortlandt | 100% | |
Note: Clinton and Van Cortlandt were re-elected unopposed.
| Governor candidate | Running mate | Votes | |
|---|---|---|---|
| George Clinton | Pierre Van Cortlandt | 3,584 | 75.50% |
| Philip Schuyler | 643 | 13.55% | |
| Ephraim Paine | 520 | 10.95% | |
| Governor candidate | Running mate | Votes | |
|---|---|---|---|
| George Clinton | Pierre Van Cortlandt | 3,624 | 100% |
Note: Clinton and Van Cortlandt were re-elected unopposed.
| Lieutenant Governor candidate | Votes | |
|---|---|---|
| Pierre Van Cortlandt | ||
| Governor candidate | Votes | Lieutenant Governor candidate | Votes | ||
|---|---|---|---|---|---|
| George Clinton | 1,828 | 48.44% | George Clinton | 1,647 | 47.15% |
| Philip Schuyler | 1,199 | 31.77% | Pierre Van Cortlandt | 1,098 | 31.43% |
| John Morin Scott | 368 | 9.75% | Abraham Ten Broeck | 748 | 21.41% |
| John Jay | 367 | 9.72% | |||
| Robert R. Livingston | 7 | 0.19% | |||
| Philip Livingston | 5 | 0.13% | |||
Notes:
- The election began on June 1, but due to the Revolutionary War it took some time to collect and count the votes, and the official result was announced on July 9. George Clinton accepted the office of Governor on July 11 and assumed its duties immediately, pending taking the oath as soon as he could safely leave his military command.
- There were no parties yet; the Democratic-Republican and Federalist Parties appeared only in 1789, and until then the candidacies were personal. Besides, the candidates for Governor and Lieutenant Governor were not "running mates"; all candidates were voted for independently.
- The Committee of Safety (the governing body of the State of New York after the Constitutional Convention adjourned) endorsed Philip Schuyler for Governor and George Clinton for Lieutenant Governor, which led to Clinton's receiving votes for both offices and actually winning both. Clinton formally resigned the lieutenant governorship and Pierre Van Cortlandt was elected lieutenant governor in a special election in 1778.[26]
See also
- New York Attorney General elections
- New York Comptroller elections
- New York state elections
References
- "NYS Board of Elections Unofficial Election Night Results". New York State Board of Elections. Archived from the original on 7 November 2013. Retrieved 17 December 2014.
- "General Election Results". New York State Board of Elections. December 13, 2010. Retrieved December 14, 2010.
- http://www.elections.ny.gov/NYSBOE/elections/2006/general/2006_gov.pdf
- http://www.elections.ny.gov/NYSBOE/elections/2002/general/2002_gov.pdf
- The candidates for state offices, in NYT on November 1, 1896
- death notice in NYT on February 11, 1895
- United Labor nomination in NYT on September 21, 1888 (name given erroneously as James H. Blakely)
- Appleton's Cyclopedia 1889) (giving John H. Blakeney)
- Socialist Labor ticket in NYT on October 22, 1888 (giving erroneously "Edward J. Hall")
- Death notice in NYT on September 24, 1899
- His life and his will, in NYT on December 1, 1899
- Obit in NYT on February 13, 1901
- The Conservative Union state convention opens in NYT on September 11, 1866
- The Democratic state convention in NYT on September 11, 1862
- The Democratic candidate accepts in NYT on September 11, 1860
- The Breckinridge and Lane Democratic state convention in NYT on August 9, 1860
- Smith was nominated by a "State Convention of the Friends of Gerrit Smith" in NYT on August 6, 1858
- The Anti-Nebraska state convention in NYT on October 30, 1854
- The Anti-Rent state convention in NYT on October 27, 1854
- The Free-Soil Democratic state convention opens in NYT on September 26, 1854
- The Temperance state convention in NYT on September 28, 1854
- Google Book The New York Civil List compiled by Franklin Benjamin Hough (page 32; Weed, Parsons and Co., 1858)]
- De Witt Clinton and the Rise of the People's Men by Craig Hanyan, Mary L. Hanyan (McGill-Queen's Press – MQUP, 1996, ISBN 0-7735-1434-1, ISBN 978-0-7735-1434-8, page 42)
- History of Political Parties in the State of New-York by John Stilwell Jenkins (Alden & Markham, Auburn NY, 1846; page 195)
- History of Political Parties in the State of New-York by John S. Jenkins (pages 43ff; Alden & Markham, Auburn NY, 1846)
- George Clinton: Yeoman Politician of the New Republic by John P. Kaminski, New York State Commission on the Bicentennial of the United States Constitution, University of Wisconsin-Madison Center for the Study of the American Constitution (Rowman & Littlefield, 1993, ISBN 0-945612-17-6, ISBN 978-0-945612-17-9, page 24)