Ontario County, New York
Ontario County is a county in the U.S. State of New York. As of the 2010 census, the population was 107,931.[1] The county seat is Canandaigua.[2]
Ontario County | |
|---|---|
 Ontario County Courthouse in Canandaigua, 2014 | |
 Seal | |
 Location within the U.S. state of New York | |
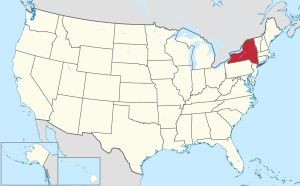 New York's location within the U.S. | |
| Coordinates: 42°51′N 77°17′W | |
| Country | |
| State | |
| Founded | 1789 |
| Named for | Lake Ontario |
| Seat | Canandaigua |
| Largest city | Geneva |
| Area | |
| • Total | 663 sq mi (1,720 km2) |
| • Land | 644 sq mi (1,670 km2) |
| • Water | 18 sq mi (50 km2) 2.8% |
| Population (2010) | |
| • Total | 107,931 |
| • Density | 168/sq mi (65/km2) |
| Time zone | UTC−5 (Eastern) |
| • Summer (DST) | UTC−4 (EDT) |
| Congressional districts | 23rd, 27th |
| Website | www |
Ontario County is part of the Rochester, NY Metropolitan Statistical Area.
In 2006, Progressive Farmer rated Ontario County as the "Best Place to Live" in the U.S., for its "great schools, low crime, excellent health care" and its proximity to Rochester.
History
This area was long controlled by the Seneca people, one of the Five Nations of the Iroquois Confederacy, or Haudenosaunee. They were forced to cede most of their land to the United States after the American Revolutionary War.
When the English established counties in New York Province in 1683, they designated Albany County as including all the northern part of New York State, the present State of Vermont, and, in theory, extending westward to the Pacific Ocean. On July 3, 1766 Cumberland County was organized, and on March 16, 1770 Gloucester County was founded, both containing territory now included in the state of Vermont. The English claims were their assertion; the Five and then Six Nations of the Iroquois occupied and controlled most of the territory in central and western New York until after the Revolutionary War.
As New York was more heavily settled in the 18th century, the colonial government organized additional counties, but European settlement did not proceed very far west past Little Falls, New York, about halfway through the Mohawk Valley, until after the revolutionary war. This area was ostsenibly part of Montgomery County, renamed after the war for an American officer. Seth Reed, a Colonel in the Battle of Bunker Hill, moved here with his family as a pioneer between 1787 and 1795. See also Geneva (town), New York[3]
Land-hungry settlers from New England swept into upstate and western New York after the Revolution, as nearly five million acres of new lands were available for purchase since the Iroquois were forced to cede most of their territories to the United States. Four tribes had allied with the British and were mostly resettled in Canada: the Mohawk, Onondaga, Seneca and Cayuga.
Transfer of what is now Ontario County to New York formally took effect in 1789, when native title was extinguished and the county was formally established to govern the lands of the Phelps and Gorham Purchase the year prior. The territory first organized as Ontario County was much larger than at present and ran south from the shore of Lake Ontario. As the area was settled, new counties were organized. The following counties were rapidly organized from this territory in the first decades after the war: Allegany, Cattaraugus, Chautauqua, Erie, Genesee, Livingston, Monroe, Niagara, Orleans, Steuben, Wyoming, and Yates counties, and parts of Schuyler and Wayne counties.
In 1796, Ontario County was divided and Steuben County was organized. In 1802, Ontario County was reduced when Genesee County was split off. The new county was originally very large, including the present Allegany, Cattaraugus, Chautauqua, Erie, Niagara, Orleans and Wyoming Counties and parts of Livingston and Monroe counties.
In 1821, portions of Genesee County were combined with portions of Ontario County to create Livingston and Monroe counties.
In 1823, a portion of Seneca County was combined with a portion of Ontario County to create Wayne County. The same year, a portion of Steuben County was combined with a portion of Ontario County to create Yates County.
Great Awakening
This frontier area was part of the evangelistic activities during the Second Great Awakening of the early 19th century, when Baptist, Methodist and Congregational preachers traveled and organized revivals and camp meetings. In addition, independent sects developed in central and western New York during this period, including the Church of Latter Day Saints, the Shakers and the Universal Friends.
Latter Day Saint movement
Joseph Smith, founder of the Latter Day Saint movement, lived in Manchester in the 1820s on the border with Palmyra. Several events in the early history of the movement occurred in Ontario County. Hill Cumorah in Manchester is where Smith said he discovered the Golden plates said to contain the writings later known as the Book of Mormon. Smith visited the hill each year on the fall equinox (September 22) between 1823 and 1827, and claimed to be instructed by the Angel Moroni. Smith said he was finally permitted to take the record on September 22, 1827. He published the Book of Mormon in Palmyra in 1830. The 110-foot (34 m) hill (which was then unnamed) is on the main road toward Canandaigua from Palmyra to Manchester (modern State Route 21); it was a few miles from Joseph Smith's home.
Since the 1930s The Church of Jesus Christ of Latter-day Saints has held the Hill Cumorah Pageant annually here. It regularly attracts thousands to its performances.[4] The church also maintains a visitors' center at the hill, the Palmyra New York Temple, and the former Smith property and homes. The latter property straddles the border between Ontario and Wayne counties.
Geography
According to the U.S. Census Bureau, the county has a total area of 663 square miles (1,720 km2), of which 644 square miles (1,670 km2) is land and 18 square miles (47 km2) (2.8%) is water.[5]
Ontario County is in western New York State, east of Buffalo, southeast of Rochester, and northwest of Ithaca. The county is within the Finger Lakes Region of the state.
Adjacent counties
- Wayne County - north
- Seneca County - east
- Yates County - south
- Steuben County - southwest
- Livingston County - west
- Monroe County - northwest
Major highways

.svg.png)

.svg.png)


Government and politics
| Year | Republican | Democratic | Third parties |
|---|---|---|---|
| 2016 | 49.6% 26,029 | 42.3% 22,233 | 8.1% 4,265 |
| 2012 | 49.8% 23,820 | 48.3% 23,087 | 2.0% 946 |
| 2008 | 49.3% 25,171 | 49.2% 25,103 | 1.5% 746 |
| 2004 | 55.9% 27,999 | 42.2% 21,166 | 1.9% 945 |
| 2000 | 52.0% 23,885 | 43.0% 19,761 | 5.0% 2,303 |
| 1996 | 41.6% 17,237 | 46.2% 19,156 | 12.2% 5,046 |
| 1992 | 42.3% 18,995 | 35.8% 16,064 | 21.9% 9,830 |
| 1988 | 55.2% 21,780 | 44.0% 17,341 | 0.8% 314 |
| 1984 | 65.4% 24,507 | 34.3% 12,844 | 0.4% 143 |
| 1980 | 48.0% 17,036 | 40.8% 14,477 | 11.2% 3,993 |
| 1976 | 59.6% 21,118 | 39.6% 14,044 | 0.8% 279 |
| 1972 | 68.2% 23,828 | 31.5% 11,012 | 0.2% 81 |
| 1968 | 56.9% 17,114 | 38.9% 11,719 | 4.2% 1,265 |
| 1964 | 35.2% 10,847 | 64.7% 19,922 | 0.1% 15 |
| 1960 | 61.6% 19,654 | 38.4% 12,251 | 0.1% 26 |
| 1956 | 74.3% 22,317 | 25.7% 7,719 | |
| 1952 | 71.2% 21,659 | 28.8% 8,763 | 0.1% 18 |
| 1948 | 63.5% 16,156 | 34.8% 8,852 | 1.7% 431 |
| 1944 | 64.0% 16,859 | 35.8% 9,437 | 0.3% 68 |
| 1940 | 67.2% 18,932 | 32.4% 9,110 | 0.4% 120 |
| 1936 | 65.5% 17,812 | 32.3% 8,787 | 2.3% 616 |
| 1932 | 61.7% 15,624 | 36.6% 9,273 | 1.7% 423 |
| 1928 | 65.3% 17,769 | 31.2% 8,491 | 3.5% 965 |
| 1924 | 66.7% 15,013 | 26.3% 5,933 | 7.0% 1,577 |
| 1920 | 66.2% 13,361 | 28.1% 5,678 | 5.7% 1,145 |
| 1916 | 56.8% 7,491 | 40.1% 5,286 | 3.1% 406 |
| 1912 | 39.9% 4,897 | 38.6% 4,734 | 21.6% 2,648 |
| 1908 | 58.7% 8,245 | 39.1% 5,484 | 2.2% 311 |
| 1904 | 59.4% 8,184 | 38.3% 5,283 | 2.3% 321 |
| 1900 | 56.5% 7,707 | 41.3% 5,641 | 2.2% 302 |
| 1896 | 56.3% 7,506 | 41.1% 5,485 | 2.6% 341 |
| 1892 | 50.1% 6,319 | 42.6% 5,376 | 7.3% 919 |
| 1888 | 53.2% 6,957 | 44.0% 5,753 | 2.9% 379 |
| 1884 | 51.5% 6,382 | 45.6% 5,643 | 2.9% 361 |
The county is governed by an elected Board of Supervisors, and uses the Board-Administrator system, hiring a professional County Administrator. The Board of Supervisors has twenty-one members: one is elected from each Town, two from the city of Canandaigua and three from the city of Geneva. As of 2004, the county government has over 800 full-time employees (augmented by another 360 seasonal or available part-time workers), and a budget of $136 million. The county is similar in its politics to much of the rest of rural upstate New York; its voters have tended to support Republican presidential candidates ever since that party was formed, and before that they supported the Whig Party.
However, in 1996, Ontario County voted for the Democratic presidential candidate for the first time since 1964 and only the second time since the Whig Party contested its first presidential election in 1836. In 2008, John McCain narrowly edged a victory over Barack Obama by less than one percent, while in 2012 Obama narrowly lost the county to Republican nominee Mitt Romney by a margin of 1.5 percent. In 2016, Republican nominee Donald Trump of New York City won the county by 7.3% over Democratic nominee and former United States Secretary of State / former Senator from New York Hillary Clinton of Chappaqua, New York.
State and federal government
| Office | District | Area of the county | Officeholder | Party | First took office | Residence |
|---|---|---|---|---|---|---|
| Congressman | New York's 23rd congressional district | Roughly, the east half of the county (Towns of Geneva, Gorham, Hopewell, Manchester, Naples (part), Phelps, Seneca)[7] | Thomas W. Reed II | Republican | 2010 | Corning, Steuben County |
| Congressman | New York's 27th congressional district | Roughly, the west half of the county (Towns of Bristol, Canadice, Canandaigua, East Bloomfield, Farmington, Naples (part), Richmond, South Bristol, Victor, West Bloomfield)[8] | Christopher C. Collins | Republican | 2013 | Clarence, Erie County |
| State Senator | 54th State Senate District | Roughly, the northeast corner of the county (Towns of Canandaigua, Farmington, Geneva, Gorham, Hopewell, Manchester, Phelps, Seneca)[9] | Pam Helming | Republican | 2017 | Canandaigua, Ontario County |
| State Senator | 55th State Senate District | All of the county not covered by the 54th district (Towns of Bristol, Canadice, East Bloomfield, Naples, Richmond, South Bristol, Victor, West Bloomfield)[10] | Rich Funke | Republican | 2015 | Fairport, Monroe County |
| State Assemblyman | 131st State Assembly District | All[11] | Brian M. Kolb | Republican | 2000 | Canandaigua, Ontario County |
Ontario County is part of:
- The 7th Judicial District of the New York Supreme Court
- The 4th Department of the New York Supreme Court, Appellate Division
Demographics
| Historical population | |||
|---|---|---|---|
| Census | Pop. | %± | |
| 1790 | 1,075 | — | |
| 1800 | 15,218 | 1,315.6% | |
| 1810 | 42,032 | 176.2% | |
| 1820 | 88,267 | 110.0% | |
| 1830 | 40,288 | −54.4% | |
| 1840 | 43,501 | 8.0% | |
| 1850 | 43,929 | 1.0% | |
| 1860 | 44,563 | 1.4% | |
| 1870 | 45,108 | 1.2% | |
| 1880 | 49,541 | 9.8% | |
| 1890 | 48,453 | −2.2% | |
| 1900 | 49,605 | 2.4% | |
| 1910 | 52,286 | 5.4% | |
| 1920 | 52,652 | 0.7% | |
| 1930 | 54,276 | 3.1% | |
| 1940 | 55,307 | 1.9% | |
| 1950 | 60,172 | 8.8% | |
| 1960 | 68,070 | 13.1% | |
| 1970 | 78,849 | 15.8% | |
| 1980 | 88,909 | 12.8% | |
| 1990 | 95,101 | 7.0% | |
| 2000 | 100,224 | 5.4% | |
| 2010 | 108,085 | 7.8% | |
| Est. 2019 | 109,777 | [12] | 1.6% |
| U.S. Decennial Census[13] 1790-1960[14] 1900-1990[15] 1990-2000[16] 2010-2013[1] | |||
As of the census[17] of 2000, there were 100,224 people, 38,370 households, and 26,360 families residing in the county. The population density was 156 people per square mile (60/km²). There were 42,647 housing units at an average density of 66 per square mile (26/km²). According to respondents' self-identification, the racial makeup of the county was 95.04% White, 2.06% African American, 0.22% Native American, 0.69% Asian, 0.02% Pacific Islander, 0.70% from other races, and 1.26% from two or more races. Hispanic or Latino of any race were 2.14% of the population. Based on self-identification, 17.9% were of German, 14.9% Irish, 14.8% English, 13.8% Italian, 7.3% American and 5.1% Dutch ancestry according to Census 2000. 95.6% spoke English and 2.3% Spanish as their first language.
There were 38,370 households out of which 32.80% had children under the age of 18 living with them, 55.00% were married couples living together, 9.90% had a female householder with no husband present, and 31.30% were non-families. 24.70% of all households were made up of individuals and 10.10% had someone living alone who was 65 years of age or older. The average household size was 2.53 and the average family size was 3.03.
In the county, the population was spread out with 25.40% under the age of 18, 8.30% from 18 to 24, 28.40% from 25 to 44, 24.80% from 45 to 64, and 13.20% who were 65 years of age or older. The median age was 38 years. For every 100 females there were 95.60 males. For every 100 females age 18 and over, there were 92.70 males.
The median income for a household in the county was $44,579, and the median income for a family was $52,698. Males had a median income of $36,732 versus $26,139 for females. The per capita income for the county was $21,533. About 4.90% of families and 7.30% of the population were below the poverty line, including 9.10% of those under age 18 and 6.40% of those age 65 or over.
Communities
Cities
- Canandaigua (county seat)
- Geneva
Towns
- Bristol
- Canadice
- Canandaigua
- East Bloomfield
- Farmington
- Geneva
- Gorham
- Hopewell
- Manchester
- Naples
- Phelps
- Richmond
- Seneca
- South Bristol
- Victor
- West Bloomfield
Census-designated places
- Crystal Beach
- Gorham
- Hall
- Honeoye
- Port Gibson
Hamlets
- Border City
- Centerfield
- Cheshire
- Fishers
- Hall
- Hopewell Center
- Ionia
- Orleans
- Seneca Castle
- Stanley
See also
References
- Bibliography
- Turner, Eramus (1909). Pioneer History of the Holland Purchase of Western New York. Volume II.
- Notes
- "State & County QuickFacts". United States Census Bureau. Archived from the original on June 7, 2011. Retrieved October 12, 2013.
- "Find a County". National Association of Counties. Retrieved June 7, 2011.
- Turner, p.319
- "A History Lesson". The Rochester Democrat and Chronicle. July 8, 2001.
- "2010 Census Gazetteer Files". United States Census Bureau. August 22, 2012. Archived from the original on May 19, 2014. Retrieved January 6, 2015.
- Leip, David. "Dave Leip's Atlas of U.S. Presidential Elections". uselectionatlas.org. Retrieved October 23, 2018.
- W, Eric (April 2, 2012). "Congressional District 27" (PDF). View 2012 Congressional Maps. Albany, New York: The New York State Legislative Task Force on Demographic Research and Reapportionment. Retrieved January 13, 2013.
- W, Eric (April 2, 2012). "Congressional District 23" (PDF). View 2012 Congressional Maps. Albany, New York: The New York State Legislative Task Force on Demographic Research and Reapportionment. Retrieved January 13, 2013.
- W, Eric (March 2, 2012). "Senate District 54" (PDF). View 2012 Senate District Maps. Albany, New York: The New York State Legislative Task Force on Demographic Research and Reapportionment. Retrieved January 6, 2013.
- W, Eric (March 2, 2012). "Senate District 55" (PDF). View 2012 Senate District Maps. Albany, New York: The New York State Legislative Task Force on Demographic Research and Reapportionment. Retrieved January 6, 2013.
- W, Eric (January 25, 2012). "Assembly District 131" (PDF). View Proposed 2012 Assembly District Maps. Albany, New York: The New York State Legislative Task Force on Demographic Research and Reapportionment. Retrieved January 6, 2013.
- "Population and Housing Unit Estimates". Retrieved December 20, 2019.
- "U.S. Decennial Census". United States Census Bureau. Retrieved January 6, 2015.
- "Historical Census Browser". University of Virginia Library. Retrieved January 6, 2015.
- "Population of Counties by Decennial Census: 1900 to 1990". United States Census Bureau. Retrieved January 6, 2015.
- "Census 2000 PHC-T-4. Ranking Tables for Counties: 1990 and 2000" (PDF). United States Census Bureau. Retrieved January 6, 2015.
- "U.S. Census website". United States Census Bureau. Retrieved January 31, 2008.
External links
| Wikimedia Commons has media related to Ontario County, New York. |
- Ontario County - Official website
- Ontario County at Curlie
- Best Place to Live in 2006 from the Progressive Farmer website
- History summary of Ontario County
- Ontario County history page
Places adjacent to Ontario County, New York | ||||||||||
|---|---|---|---|---|---|---|---|---|---|---|
| ||||||||||
Municipalities and communities of Ontario County, New York, United States | ||
|---|---|---|
County seat: Canandaigua | ||
| Cities |
| |
| Towns | ||
| Villages | ||
| CDPs |
| |
| Other hamlets | ||
| Footnotes | ‡This populated place also has portions in an adjacent county or counties | |
| Authority control |
|
|---|