London North Centre
London North Centre (French: London-Centre-Nord; formerly known as London—Adelaide) is a federal electoral district in the city of London in the province of Ontario, Canada, that has been represented in the House of Commons of Canada since 1997.
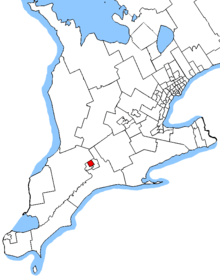 London North Centre shown within southwestern Ontario (2013 boundaries) | |||
| Federal electoral district | |||
| Legislature | House of Commons | ||
| MP |
Liberal | ||
| District created | 1996 | ||
| First contested | 1997 | ||
| Last contested | 2019 | ||
| District webpage | profile, map | ||
| Demographics | |||
| Population (2011)[1] | 118,079 | ||
| Electors (2015) | 87,668 | ||
| Area (km²)[2] | 63 | ||
| Pop. density (per km²) | 1,874.3 | ||
| Census divisions | Middlesex | ||
| Census subdivisions | London | ||
Demographics (2016)
Ethnic groups: 79.4% White, 4.9% Chinese, 4.8% South Asian, 2.7% Black, 2.6% Arab, 2.3% Aboriginal, 1.9% Latin American, 1.4% Korean, 1.3% Southeast Asian, 1.1% Filipino
Knowledge of languages: 98.1% English, 8.1% French, 3.6% Mandarin, 3.2% Spanish, 2.8% Arabic, 1.5% Polish, 1.4% Hindi,1.3% German, 1.3% Korean 1.2% Italian, 1.1% Portuguese
Mother tongues: 73.6% English, 3.2% Mandarin, 2.1% Arabic, 1.8% Spanish 1.3% French, 1.2% Korean, 1.2% Polish
Religion (2011): 59.4% Christian (25.3% Catholic, 23.4% Protestant, 8.7% Other Christian, 2.0% Christian Orthodox), 33.0% No religious affiliation, 3.4% Muslim, 1.1% Hindu, 1.0% Buddhist
Median income: $53,712
Geography
It consists of the part of the City of London east of Wonderland Road North and Wharncliffe Road, north of Oxford Street West and the Thames River and west of Highbury Avenue North. The district includes the University of Western Ontario and Victoria, University, and St. Joseph's Hospitals. Wonderland Road, Oxford Street, Wharncliffe Road, and south branch of the Thames River form its western boundary with the district of London West, Highbury Avenue and the south branch of the Thames its eastern and southern boundaries with London—Fanshawe, and the north city limit its boundary with Perth—Middlesex riding to the north.
History
The riding was created in 1996 as "London—Adelaide" from parts of London East, London West and London—Middlesex ridings. It was renamed "London North Centre" in 1997.
This riding lost territory to London—Fanshawe and gained territory from London West during the 2012 electoral redistribution.
Members of Parliament
This riding has elected the following member of the House of Commons:
| Parliament | Years | Member | Party | |
|---|---|---|---|---|
| London—Adelaide Riding created from London East, London West and London—Middlesex |
||||
| 36th | 1997–2000 | Joe Fontana | Liberal | |
| London North Centre | ||||
| 37th | 2000–2004 | Joe Fontana | Liberal | |
| 38th | 2004–2006 | |||
| 39th | 2006–2006 | |||
| 2006–2008 | Glen Pearson | |||
| 40th | 2008–2011 | |||
| 41st | 2011–2015 | Susan Truppe | Conservative | |
| 42nd | 2015–2019 | Peter Fragiskatos | Liberal | |
| 43rd | 2019–present | |||
Election results
2008–present general elections
| 2019 Canadian federal election | ||||||||
|---|---|---|---|---|---|---|---|---|
| Party | Candidate | Votes | % | ±% | Expenditures | |||
| Liberal | Peter Fragiskatos | 27,427 | 42.75 | -7.70 | ||||
| Conservative | Sarah Bokhari | 15,066 | 23.64 | -7.46 | ||||
| New Democratic | Dirka Prout | 14,887 | 23.36 | +8.70 | ||||
| Green | Carol Dyck | 4,872 | 7.64 | +4.08 | ||||
| People's | Salim Mansur | 1,532 | 2.40 | +2.40 | ||||
| Communist | Clara Sorrenti | 137 | 0.21 | - | ||||
| Total valid votes/Expense limit | 63,741 | 100.0 | ||||||
| Total rejected ballots | 493 | |||||||
| Turnout | 64,234 | 67.3 | ||||||
| Eligible voters | 95,472 | |||||||
| Source: Elections Canada[3][4] | ||||||||
| 2015 Canadian federal election | ||||||||
|---|---|---|---|---|---|---|---|---|
| Party | Candidate | Votes | % | ±% | Expenditures | |||
| Liberal | Peter Fragiskatos | 32,427 | 50.45 | +16.22 | $139,844.01 | |||
| Conservative | Susan Truppe | 19,990 | 31.10 | -5.95 | $133,769.73 | |||
| New Democratic | German Gutierrez | 9,423 | 14.66 | -9.61 | $35,678.98 | |||
| Green | Carol Dyck | 2,286 | 3.56 | -0.48 | $2,843.90 | |||
| Marxist–Leninist | Marvin Roman | 145 | 0.23 | – | – | |||
| Total valid votes/Expense limit | 64,271 | 100.00 | $228,722.98 | |||||
| Total rejected ballots | 267 | 0.41 | – | |||||
| Turnout | 64,538 | 72.66 | – | |||||
| Eligible voters | 88,819 | |||||||
| Liberal gain from Conservative | Swing | +11.08 | ||||||
| Source: Elections Canada[5][6][7][8] | ||||||||
| 2011 Canadian federal election | ||||||||
|---|---|---|---|---|---|---|---|---|
| Party | Candidate | Votes | % | ±% | Expenditures | |||
| Conservative | Susan Truppe | 19,468 | 36.96 | +3.99 | $88,641.34 | |||
| Liberal | Glen Pearson | 17,803 | 33.80 | -5.33 | $64,078.28 | |||
| New Democratic | German Gutierrez | 12,996 | 24.67 | +7.20 | $16,103.05 | |||
| Green | Mary Ann Hodge | 2,177 | 4.13 | -6.30 | $9,128.59 | |||
| Animal Alliance | AnnaMaria Valastro | 229 | 0.43 | – | $71.19 | |||
| Total valid votes | 52,673 | 100.00 | – | |||||
| Total rejected ballots/Expense Limit | 231 | 0.44 | +0.03 | $94,071.99 | ||||
| Turnout | 52,904 | 59.69 | – | |||||
| Eligible voters | 88,624 | – | – | |||||
| 2008 Canadian federal election | ||||||||
|---|---|---|---|---|---|---|---|---|
| Party | Candidate | Votes | % | ±% | Expenditures | |||
| Liberal | Glen Pearson | 21,018 | 39.13 | +4.27 | $90,524 | |||
| Conservative | Paul Van Meerbergen | 17,712 | 32.97 | +8.49 | $71,577 | |||
| New Democratic | Steve Holmes | 9,387 | 17.47 | +3.39 | $13,795 | |||
| Green | Mary Ann Hodge | 5,603 | 10.43 | -15.41 | $7,209 | |||
| Total valid votes/Expense limit | 53,720 | 100.00 | $93,856 | |||||
| Total rejected ballots | 222 | 0.41 | ||||||
| Turnout | 53,942 | |||||||
2006 by-election

Long-time MP Joe Fontana resigned from the seat in 2006 in order to run in the London municipal election as a candidate for mayor, requiring a by-election to be held.
The election was called on October 22, 2006 with polling day falling on November 27.[9]
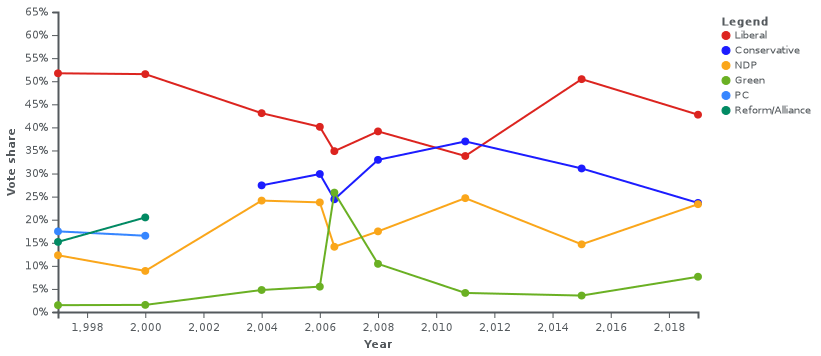
The election result presented a major breakthrough for the Green Party, tripling its previous showing in the general election and placing slightly ahead of the candidate of the governing Conservative Party. The vote for party leader Elizabeth May was over five times the 4.5% national popular vote in the preceding federal election.
| Canadian federal by-election, November 27, 2006 Resignation of Joe Fontana | ||||||||
|---|---|---|---|---|---|---|---|---|
| Party | Candidate | Votes | % | ±% | ||||
| Liberal | Glen Pearson | 13,287 | 34.85 | −5.27 | ||||
| Green | Elizabeth May | 9,864 | 25.87 | +20.38 | ||||
| Conservative | Dianne Haskett | 9,309 | 24.42 | −5.48 | ||||
| New Democratic | Megan Walker | 5,388 | 14.13 | −9.62 | ||||
| Progressive Canadian | Steven Hunter | 145 | 0.38 | −0.09 | ||||
| Independent | Robert Ede | 77 | 0.20 | – | ||||
| Canadian Action | Will Arlow | 53 | 0.14 | – | ||||
| Total | 38,123 | 100.00 | ||||||
1997–2006 general elections
| 2006 Canadian federal election | ||||||||
|---|---|---|---|---|---|---|---|---|
| Party | Candidate | Votes | % | ±% | Expenditures | |||
| Liberal | Joe Fontana | 24,109 | 40.12 | -2.96 | $78,406 | |||
| Conservative | John Mazzilli | 17,968 | 29.90 | +2.46 | $63,536 | |||
| New Democratic | Stephen Maynard | 14,271 | 23.75 | -0.39 | $20,817 | |||
| Green | Stuart Smith | 3,300 | 5.49 | +0.72 | $2,442 | |||
| Progressive Canadian | Rod Morley | 283 | 0.47 | +0.03 | $2,852 | |||
| Marxist–Leninist | Margaret Mondaca | 160 | 0.27 | +0.14 | $0.00 | |||
| 2004 Canadian federal election | ||||||||
|---|---|---|---|---|---|---|---|---|
| Party | Candidate | Votes | % | ±% | ||||
| Liberal | Joe Fontana | 21,472 | 43.08 | -8.46 | ||||
| Conservative | Tim Gatten | 13,677 | 27.44 | -9.57 | ||||
| New Democratic | Joe Swan | 12,034 | 24.14 | +15.24 | ||||
| Green | Bronagh Joyce Morgan | 2,376 | 4.77 | +3.23 | ||||
| Progressive Canadian | Rod Morley | 220 | 0.44 | – | ||||
| Marxist–Leninist | Gustavo Grandos-Ocon | 67 | 0.13 | – | ||||
^ Conservative change is from combined Canadian Alliance and Progressive Conservative totals.
| 2000 Canadian federal election | ||||||||
|---|---|---|---|---|---|---|---|---|
| Party | Candidate | Votes | % | ±% | ||||
| Liberal | Joe Fontana | 22,795 | 51.54 | -0.18 | ||||
| Alliance | Nancy Branscombe | 9,062 | 20.49 | +5.30 | ||||
| Progressive Conservative | Lorie Johnson | 7,305 | 16.52 | -0.95 | ||||
| New Democratic | Colleen Redmond | 3,936 | 8.90 | -3.39 | ||||
| Green | Jeremy McNaughton | 681 | 1.54 | +0.06 | ||||
| Marijuana | Tim Berg | 453 | 1.02 | - | ||||
^ Canadian Alliance change is from Reform
| 1997 Canadian federal election | ||||||||
|---|---|---|---|---|---|---|---|---|
| Party | Candidate | Votes | % | ±% | ||||
| Liberal | Joe Fontana | 23,891 | 51.72 | |||||
| Progressive Conservative | Jim Henkel | 8,072 | 17.47 | |||||
| Reform | Tara Bingham | 7,016 | 15.19 | |||||
| New Democratic | Colleen Redmond | 5,679 | 12.29 | |||||
| Green | Jeff Culbert | 685 | 1.48 | |||||
| Christian Heritage | Ken Devries | 375 | 0.81 | |||||
| Independent | Michael Rubinoff | 336 | 0.73 | |||||
| Marxist–Leninist | Vera Cruise | 138 | 0.30 | |||||
See also
- List of Canadian federal electoral districts
- Past Canadian electoral districts
References
- "(Code 35043) Census Profile". 2011 census. Statistics Canada. 2012. Retrieved 2011-03-03.
- Parliamentary website
- Elections Canada 2006 by-election site
- 2011 Results from Elections Canada
- Campaign expense data from Elections Canada
Notes
- Statistics Canada: 2011
- Statistics Canada: 2011
- "List of confirmed candidates". Elections Canada. Retrieved October 4, 2019.
- "Election Night Results". Elections Canada. Retrieved October 30, 2019.
- Elections Canada – Confirmed candidates for London North Centre, 30 September 2015
- Elections Canada – Preliminary Election Expenses Limits for Candidates Archived 2015-08-15 at the Wayback Machine
- Elections Canada Preliminary Results
- Change represents redistributed results as calculated by Elections Canada from 2011 Election to boundaries of the 2013 Redistribution Order
- "Prime Minister announces by-election for November 27, 2006". Pm.gc.ca. Archived from the original on 2011-05-20. Retrieved 2011-01-10.
External links
- London North Centre New Democratic Party Riding Association
- London North Centre Conservative Association
- London North Centre Greens
- London North Centre Conservative Candidate Susan Truppe (Federal)
| Government | |||||||||
|---|---|---|---|---|---|---|---|---|---|
| Transportation | |||||||||
| Communities |
| ||||||||
| Education |
| ||||||||
| Culture |
| ||||||||
| Attractions |
| ||||||||
| Media |
| ||||||||
.png)