London North Centre (provincial electoral district)
London North Centre is an electoral district in the province of Ontario, Canada, that has been represented in the Legislative Assembly of Ontario since 1999. London North Centre was created from London North to match the federal riding in 1996.
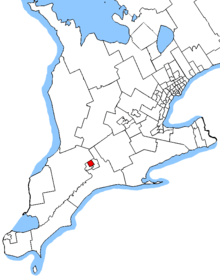 London North Centre shown within southwestern Ontario | |||
| Provincial electoral district | |||
| Legislature | Legislative Assembly of Ontario | ||
| MPP |
New Democratic | ||
| District created | 1996 | ||
| First contested | 1999 | ||
| Last contested | 2018 | ||
| Demographics | |||
| Population (2011) | 117,899 | ||
| Electors (2011) | 94,684 | ||
| Area (km²) | 64 | ||
| Pop. density (per km²) | 1,842.2 | ||
| Census divisions | Middlesex | ||
| Census subdivisions | London | ||
Its population in 2006 was 115,250 and the average family income was $71,995.
Demographics
- According to the Canada 2001 Census
| Population | 107,672 |
| Electors | 91,328 |
| Area (km²) | 64 |
| Population density (people per km²) | 1682.4 |
Ethnic groups: 86.8% White, 2.0% Chinese, 1.9% Black, 1.8% South Asian, 1.7% Aboriginal, 1.2% Southeast Asian, 1.1% Arab
Languages: 79.8% English, 1.4% French, 18.0% Other
Religions: 38.5% Protestant, 27.3% Catholic, 22.6% No religion, 3.0% Muslim, 2.8% Other Christian, 2.2% Christian Orthodox, 1.1% Jewish
Average income: $31,174
Geography
Elections Ontario's definition of London North Centre consists of that part of the City of London described as follows: commencing at the intersection of the northerly limit of said city with Highbury Avenue North; thence southerly along said avenue to the Canadian National Railway situated southerly of Brydges Street; thence westerly, southwesterly and southeasterly along said railway to the Thames River (South Branch); thence generally westerly along said river to the Canadian National Railway; thence westerly along said railway to the Thames River; thence generally southwesterly along said river to Wonderland Road South; thence generally northerly along said road and Wonderland Road North to the northerly limit of said city; thence northeasterly along said limit to the point of commencement.
Members of Provincial Parliament
This riding has elected the following members of the Legislative Assembly of Ontario:
| London North Centre | ||||
|---|---|---|---|---|
| Assembly | Years | Member | Party | |
| Riding created from London North, London Centre and Middlesex | ||||
| 37th | 1999–2003 | Dianne Cunningham | Progressive Conservative | |
| 38th | 2003–2007 | Deb Matthews | Liberal | |
| 39th | 2007–2011 | |||
| 40th | 2011–2014 | |||
| 41st | 2014–2018 | |||
| 42nd | 2018–Present | Terence Kernaghan | New Democratic | |
Election results
| 2018 Ontario general election | ||||||||
|---|---|---|---|---|---|---|---|---|
| Party | Candidate | Votes | % | ±% | ||||
| New Democratic | Terence Kernaghan | 25,757 | 47.60 | |||||
| Progressive Conservative | Susan Truppe | 16,701 | 30.86 | |||||
| Liberal | Kate Graham | 8,501 | 15.71 | |||||
| Green | Carol Dyck | 2,493 | 4.61 | |||||
| Libertarian | Calvin McKay | 299 | 0.55 | |||||
| Freedom | Paul McKeever | 234 | 0.43 | |||||
| Communist | Clara Sorrenti | 128 | 0.24 | |||||
| Total valid votes | 54,113 | 100.0 | ||||||
| Source: Elections Ontario[1] | ||||||||
| 2014 Ontario general election | ||||||||
|---|---|---|---|---|---|---|---|---|
| Party | Candidate | Votes | % | ±% | ||||
| Liberal | Deb Matthews | 16,379 | 35.98 | -7.93 | ||||
| New Democratic | Judy Bryant | 13,853 | 30.43 | +7.72 | ||||
| Progressive Conservative | Nancy Branscombe | 12,016 | 26.40 | -2.53 | ||||
| Green | Kevin Labonte | 2,445 | 5.37 | +2.05 | ||||
| Freedom | Salim Mansur | 639 | 1.40 | +0.78 | ||||
| Communist | Dave McKee | 115 | 0.25 | – | ||||
| Pauper | Michael Spottiswood | 70 | 0.15 | +0.03 | ||||
| Total valid votes | 45,517 | 100.0 | ||||||
| Liberal hold | Swing | -7.82 | ||||||
| Source: Elections Ontario[2] | ||||||||
| 2011 Ontario general election | ||||||||
|---|---|---|---|---|---|---|---|---|
| Party | Candidate | Votes | % | ±% | ||||
| Liberal | Deb Matthews | 19,167 | 43.91 | -3.26 | ||||
| Progressive Conservative | Nancy Branscombe | 12,628 | 28.93 | +5.21 | ||||
| New Democratic | Steve Holmes | 9,914 | 22.71 | +6.06 | ||||
| Green | Kevin Labonte | 1,451 | 3.32 | -9.13 | ||||
| Freedom | Mary Lou Ambrogio | 269 | 0.62 | – | ||||
| Libertarian | Jordan van Klinken | 169 | 0.39 | – | ||||
| Pauper | Michael Spottiswood | 54 | 0.12 | – | ||||
| Total valid votes | 43,652 | 100.00 | ||||||
| Total rejected, unmarked and declined ballots | 217 | 0.49 | ||||||
| Turnout | 43,869 | 47.87 | ||||||
| Eligible voters | 91,638 | |||||||
| Liberal hold | Swing | -3.61 | ||||||
| Source: Elections Ontario[3] | ||||||||
| 2007 Ontario general election | ||||||||
|---|---|---|---|---|---|---|---|---|
| Party | Candidate | Votes | % | ±% | ||||
| Liberal | Deb Matthews | 21,669 | 47.17 | +3.74 | ||||
| Progressive Conservative | Rob Alder | 10,897 | 23.72 | -5.20 | ||||
| New Democratic | Steve Holmes | 7,649 | 16.65 | -7.88 | ||||
| Green | Brett McKenzie | 5,720 | 12.45 | +10.77 | ||||
| Total valid votes | 45,935 | 100.00 | ||||||
| 2003 Ontario general election | ||||||||
|---|---|---|---|---|---|---|---|---|
| Party | Candidate | Votes | % | ±% | ||||
| Liberal | Deb Matthews | 20,212 | 43.43 | +22.54 | ||||
| Progressive Conservative | Dianne Cunningham | 13,460 | 28.92 | -11.29 | ||||
| New Democratic | Rebecca Coulter | 11,414 | 24.53 | -11.93 | ||||
| Green | Bronagh Joyce Morgan | 780 | 1.68 | +0.88 | ||||
| Family Coalition | Craig Smith | 432 | 0.93 | -0.09 | ||||
| Freedom | Lisa Turner | 242 | 0.52 | +0.18 | ||||
| Total valid votes | 46,540 | 100.00 | ||||||
| 1999 Ontario general election | ||||||||
|---|---|---|---|---|---|---|---|---|
| Party | Candidate | Votes | % | |||||
| Progressive Conservative | Dianne Cunningham | 18,320 | 40.21 | |||||
| New Democratic | Marion Boyd | 16,611 | 36.46 | |||||
| Liberal | Roger Caranci | 9,518 | 20.89 | |||||
| Family Coalition | Andrew Jezierski | 466 | 1.02 | |||||
| Green | Jeff Culbert | 366 | 0.80 | |||||
| Freedom | Robert Metz | 156 | 0.34 | |||||
| Natural Law | Stephen Porter | 120 | 0.26 | |||||
| Total valid votes | 45,557 | 100.00 | ||||||
2007 electoral reform referendum
| 2007 Ontario electoral reform referendum | |||
|---|---|---|---|
| Side | Votes | ||
| First Past the Post | 26,700 | 59.7 | |
| Mixed member proportional | 18,003 | 40.3 | |
| Total valid votes | 44,703 | 100.0 | |
References
- "Summary of Valid Votes Cast for each Candidate" (PDF). Elections Ontario. p. 6. Retrieved 16 January 2019.
- Elections Ontario (2014). "Official result from the records, 044 London North Centre" (PDF). Retrieved 27 June 2015.
- Elections Ontario (2011). "Official return from the records / Rapport des registres officiels - London North Centre" (PDF). Retrieved 2 June 2014.
External links
- London North Centre Progressive Conservative Association (Provincial)
- Map of riding for 2018 election
| Government | |||||||||
|---|---|---|---|---|---|---|---|---|---|
| Transportation | |||||||||
| Communities |
| ||||||||
| Education |
| ||||||||
| Culture |
| ||||||||
| Attractions |
| ||||||||
| Media |
| ||||||||