Toronto Centre
Toronto Centre (French: Toronto-Centre) is a federal electoral district in Toronto, Ontario, Canada, that has been represented in the House of Commons of Canada from 1872 to 1925, and since 1935, under the names Centre Toronto (1872–1903), Toronto Centre (1903–1925, and since 2004), Rosedale (1935–1997), and Toronto Centre—Rosedale (1997–2004).
.png) Toronto Centre in relation to other Toronto ridings (2015 boundaries) | |||
| Federal electoral district | |||
| Legislature | House of Commons | ||
| MP |
Liberal | ||
| District created | 1933 | ||
| First contested | 1935 | ||
| Last contested | 2019 | ||
| District webpage | profile, map | ||
| Demographics | |||
| Population (2016)[1] | 103,805 | ||
| Electors (2015) | 66,351 | ||
| Area (km²)[1] | 5.84 | ||
| Pop. density (per km²) | 17,774.8 | ||
| Census divisions | Toronto | ||
| Census subdivisions | Toronto | ||
.gif)
Toronto Centre covers the heart of Downtown Toronto. The riding contains areas such as Regent Park (Canada's first and largest social housing development), St. James Town (a largely immigrant area and the most densely populated neighbourhood in Canada), Cabbagetown, Church and Wellesley (Canada's largest gay neighbourhood), Ryerson University, The Toronto Eaton Centre and part of the city's financial district (the east side of Bay Street).
Historically, the riding was one of the few in central Toronto where the Progressive Conservatives usually did well. The PCs held the riding for 34 of the 58 years from 1935 to 1993. However, it has been in Liberal hands without interruption since 1993. The 2012 federal electoral redistribution shifted much of the wealthier northern part of the riding, which included Rosedale, to the new riding of University—Rosedale.[2]
The riding was represented by former interim Liberal leader Bob Rae after the federal by-elections of March 17, 2008. Rae resigned from Parliament on July 31, 2013.[3][4]
History
Centre Toronto riding was first created in 1872 from portions of West Toronto and East Toronto. In 1903, the name was changed to Toronto Centre. In 1924, the riding was broken into Toronto East Centre, Toronto West Centre and Toronto South.
A riding covering much the same area was created in 1933 named "Rosedale" after the wealthy neighbourhood of Rosedale. This riding was replaced with "Toronto Centre—Rosedale" in 1996, but the quickly growing population resulted in large areas being shaved off on all sides. In 2003, Toronto Centre—Rosedale was abolished, and a new riding somewhat to the east was created named "Toronto Centre".
Each of the four major national political parties (the Liberal Party, the Conservative Party, the Green Party, and the NDP), have active federal and provincial riding associations which act as the local party organizations in the riding. Since the early 1990s, however, most contests have been between the Liberals and NDP.
This riding lost territory to University—Rosedale and Spadina—Fort York, and gained a small fraction of territory from Trinity—Spadina during the 2012 electoral redistribution. This made Toronto Centre the smallest size riding in the country, beating Papineau in Montreal by 3 km².
Former boundaries
 1903-1914
 1933 to 1966
 1966 to 1976
 1976 to 1987
 1987 to 1996
 1996 to 2003
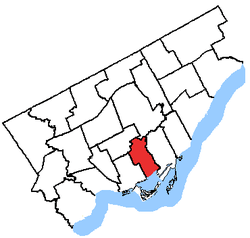 2003 to 2015
Demographics
- According to the Canada 2011 Census
Ethnic groups: 58.1% White, 9.0% South Asian, 8.3% Chinese, 7.7% Black, 4.6% Filipino, 2.1% Latin American, 1.9% Southeast Asian, 1.8% Korean, 1.3% Arab, 1.2% West Asian, 1.1% Aboriginal
Languages: 62.6% English, 6.6% Chinese, 3.3% French, 2.4% Spanish, 2.3% Tagalog, 1.6% Bengali 1.5% Arabic, 1.4% Russian, 1.4% Tamil, 1.4% Korean, 1.1% Persian
Religions: 47.2% Christian (22.9% Catholic, 6.0% Anglican, 3.3% United Church, 2.7% Christian Orthodox, 1.4% Presbyterian), 7.7% Muslim, 3.9% Hindu, 3.7% Jewish, 2.3% Buddhist, 34.0% None.
Median income: $32,027 (2010)[5]
Average income: $62,774 (2010) [5]
- According to the Canada 2016 Census
Languages: (2016) 79.9% English, 3.7% Mandarin, 1.5% Tagalog, 1.5% Cantonese, 1.4% French, 1.3% Tamil, 1.3% Bengali, 1.2% Spanish, 1.0% Korean, 0.9% Arabic, 0.8% Farsi, 0.7% Russian, 0.5% Urdu, 0.5% Vietnamese, 0.5% Amharic, 0.5% Nepali[6]
Members of Parliament
These ridings have elected the following Members of Parliament:
Election results
Toronto Centre, 2003–present
| 2019 Canadian federal election | ||||||||
|---|---|---|---|---|---|---|---|---|
| Party | Candidate | Votes | % | ±% | Expenditures | |||
| Liberal | Bill Morneau | 31,271 | 57.37 | -0.53 | $95,538.84 | |||
| New Democratic | Brian Chang | 12,142 | 22.27 | -4.34 | $58.656.81 | |||
| Conservative | Ryan Lester | 6,613 | 12.13 | -0.06 | ||||
| Green | Annamie Paul | 3,852 | 7.07 | +4.47 | $34,903.20 | |||
| Animal Protection | Rob Lewin | 182 | 0.33 | – | $2,171.71 | |||
| Rhinoceros | Sean Carson | 147 | 0.27 | – | – | |||
| Independent | Jason Tavares | 126 | 0.23 | – | – | |||
| Communist | Bronwyn Cragg | 125 | 0.23 | -0.03 | ||||
| Marxist–Leninist | Philip Fernandez | 54 | 0.10 | -0.05 | – | |||
| Total valid votes/Expense limit | 54,512 | 100.0 | – | $107,308.65 | ||||
| Total rejected ballots | 384 | |||||||
| Turnout | 54,896 | 68.55 | ||||||
| Eligible voters | 80,087 | |||||||
| Source: Elections Canada[7][8] | ||||||||
| 2015 Canadian federal election | ||||||||
|---|---|---|---|---|---|---|---|---|
| Party | Candidate | Votes | % | ±% | Expenditures | |||
| Liberal | Bill Morneau | 29,297 | 57.90 | +8.52 | $170,325.26 | |||
| New Democratic | Linda McQuaig | 13,467 | 26.61 | -9.69 | $198,294.34 | |||
| Conservative | Julian Di Battista | 6,167 | 12.19 | +3.56 | $22,625.73 | |||
| Green | Colin Biggin | 1,315 | 2.60 | -0.37 | $3,964.97 | |||
| Independent | Jordan Stone | 147 | 0.29 | – | – | |||
| Communist | Mariam Ahmad | 133 | 0.26 | – | – | |||
| Marxist–Leninist | Philip Fernandez | 76 | 0.15 | +0.03 | – | |||
| Total valid votes/Expense limit | 50,602 | 100.0 | $203,952.21 | |||||
| Total rejected ballots | 266 | – | – | |||||
| Turnout | 50,868 | – | – | |||||
| Eligible voters | 66,351 | |||||||
| Source: Elections Canada[9][10] | ||||||||
| 2011 federal election redistributed results[11] | |||
|---|---|---|---|
| Party | Vote | % | |
| Liberal | 14,828 | 39.42 | |
| New Democratic | 13,617 | 36.20 | |
| Conservative | 6,746 | 17.93 | |
| Green | 1,942 | 5.16 | |
| Others | 487 | 1.29 | |

| Canadian federal by-election, November 25, 2013 | ||||||||
|---|---|---|---|---|---|---|---|---|
| Party | Candidate | Votes | % | ±% | Expenditures | |||
| Liberal | Chrystia Freeland | 17,194 | 49.38 | +8.37 | $ 97,609.64 | |||
| New Democratic | Linda McQuaig | 12,640 | 36.30 | +6.09 | 99,230.30 | |||
| Conservative | Geoff Pollock | 3,004 | 8.63 | −14.01 | 75,557.39 | |||
| Green | John Deverell | 1,034 | 2.97 | −2.05 | 21,521.10 | |||
| Progressive Canadian | Dorian Baxter | 453 | 1.30 | – | ||||
| Libertarian | Judi Falardeau | 236 | 0.68 | +0.18 | – | |||
| Independent | Kevin Clarke | 84 | 0.24 | 560.00 | ||||
| Independent | John "The Engineer" Turmel | 56 | 0.16 | – | ||||
| Independent | Leslie Bory | 51 | 0.15 | 633.30 | ||||
| Online | Michael Nicula | 43 | 0.12 | 200.00 | ||||
| Independent | Bahman Yazdanfar | 26 | 0.07 | −0.12 | 1,134.60 | |||
| Total valid votes/Expense limit | 34,821 | 100.0 | – | $ 101,793.06 | ||||
| Total rejected ballots | 177 | 0.51 | +0.12 | |||||
| Turnout | 34,998 | 38.20 | −24.73 | |||||
| Eligible voters | 91,612 | |||||||
| Liberal hold | Swing | +1.94 | ||||||
| By-election due to the resignation of Bob Rae. | ||||||||
Source(s)
"November 25, 2013 By-elections". Elections Canada. November 26, 2013. Retrieved December 14, 2013. "November 25, 2013 By-election – Financial Reports". Retrieved May 9, 2014. | ||||||||
| 2011 Canadian federal election | ||||||||
|---|---|---|---|---|---|---|---|---|
| Party | Candidate | Votes | % | ±% | Expenditures | |||
| Liberal | Bob Rae | 22,832 | 41.01 | -12.52 | $ 51,672.12 | |||
| New Democratic | Susan Wallace | 16,818 | 30.21 | +15.12 | 18,904.44 | |||
| Conservative | Kevin Moore | 12,604 | 22.64 | +4.31 | 63,141.66 | |||
| Green | Ellen Michelson | 2,796 | 5.02 | -6.83 | 44,006.84 | |||
| Libertarian | Judi Falardeau | 277 | 0.50 | – | ||||
| Communist | Cathy Holliday | 159 | 0.29 | -0.09 | 502.10 | |||
| Independent | Bahman Yazdanfar | 108 | 0.19 | 653.91 | ||||
| Marxist–Leninist | Philip Fernandez | 76 | 0.14 | -0.04 | – | |||
| Total valid votes/Expense limit/Total expenditures | 55,670 | 100.0 | $ 92,663.68 | $ 178,881.07 | ||||
| Total rejected ballots | 220 | 0.39 | ||||||
| Turnout | 55,890 | 62.93 | ||||||
| Eligible voters | 88,810 | |||||||
| Liberal hold | Swing | -13.82 | ||||||
2008 general election
On September 21, 2008, Conservative candidate Chris Reid resigned because he said he couldn't commit to four years in government. However, blog entries were discovered that linked him to controversial musings on guns and the murder of Tim McLean aboard a Greyhound bus.[12] Chris Reid was replaced by David Gentili as the Conservative candidate for Toronto Centre.[13] Expenditures listed for Gentili include expenditures reported by Reid.
| 2008 Canadian federal election | ||||||||
|---|---|---|---|---|---|---|---|---|
| Party | Candidate | Votes | % | ±% | Expenditures | |||
| Liberal | Bob Rae | 27,462 | 53.53 | -5.94 | $ 48,353.21 | |||
| Conservative | David Gentili | 9,402 | 18.33 | +6.01 | 39,290.89 | |||
| New Democratic | El-Farouk Khaki | 7,743 | 15.09 | +1.21 | 21,305.27 | |||
| Green | Ellen Michelson | 6,081 | 11.85 | -1.56 | 23,041.16 | |||
| Communist | Johan Boyden | 193 | 0.38 | 432.31 | ||||
| Animal Alliance | Liz White | 187 | 0.36 | -0.16 | 685.91 | |||
| Independent | Gerald Derome | 146 | 0.28 | 2,063.60 | ||||
| Marxist–Leninist | Philip Fernandez | 92 | 0.18 | – | ||||
| Total valid votes/Expense limit/Total Expenditures | 51,306 | 100.00 | $ 92,067.97 | $ 135,172.35 | ||||
| Total rejected ballots | 257 | 0.50 | ||||||
| Turnout | 51,563 | 57.39 | ||||||
2008 by-election
A by-election, held on March 17, 2008 to fill a vacancy created by the resignation of Bill Graham was won by Liberal Bob Rae, a former Ontario NDP Premier.
The nominated Conservative candidate in the by-election, Mark Warner, was dropped by the party's national council on October 31, 2007.[14] Don Meredith was nominated as the Conservative candidate in December 2007.[15]
Activist El-Farouk Khaki ran for the NDP and Chris Tindal was the Green Party of Canada candidate. Liz White was the Animal Alliance Environmental Voters Party of Canada candidate, and Doug Plumb represented the Canadian Action Party.
| By-election on March 17, 2008
On Bill Graham's resignation, July 2, 2007 | ||||||
| Party | Candidate | Votes | % | ±% | ||
|---|---|---|---|---|---|---|
| Liberal | Bob Rae | 14,187 | 59.47 | +7.24 | ||
| New Democratic | El-Farouk Khaki | 3,312 | 13.88 | -9.86 | ||
| Green | Chris Tindal | 3,199 | 13.41 | +8.20 | ||
| Conservative | Donald Meredith | 2,939 | 12.32 | -5.89 | ||
| Animal Alliance | Liz White | 123 | 0.52 | +0.40 | ||
| Canadian Action | Doug Plumb | 97 | 0.41 | |||
| Total valid votes | 23,857 | 100.00 | ||||
| Total rejected ballots | 96 | 0.40 | ||||
| Turnout | 23,953 | 27.86 | ||||
| Liberal hold | Swing | +8.5 | ||||
| 2006 Canadian federal election | ||||||||
|---|---|---|---|---|---|---|---|---|
| Party | Candidate | Votes | % | ±% | ||||
| Liberal | Bill Graham | 30,874 | 52.23 | -4.30 | ||||
| New Democratic | Michael Shapcott | 14,036 | 23.74 | -0.01 | ||||
| Conservative | Lewis Reford | 10,763 | 18.21 | +3.42 | ||||
| Green | Chris Tindal | 3,080 | 5.21 | +1.30 | ||||
| Communist | Johan Boyden | 120 | 0.2 | -0.05 | ||||
| Independent | Michel Prairie | 101 | 0.2 | |||||
| Animal Alliance | Liz White | 72 | 0.12 | |||||
| Marxist–Leninist | Philip Fernandez | 66 | 0.11 | -0.01 | ||||
| Total valid votes | 59,112 | 100.00 | ||||||
| Liberal hold | Swing | -2.1 | ||||||
| 2004 Canadian federal election | ||||||||
|---|---|---|---|---|---|---|---|---|
| Party | Candidate | Votes | % | ±% | ||||
| Liberal | Bill Graham | 30,336 | 56.53 | +1.26 | ||||
| New Democratic | Michael Shapcott | 12,747 | 23.75 | +12.39 | ||||
| Conservative | Megan Harris | 7,936 | 14.79 | −13.00 | ||||
| Green | Gabriel Draven | 2,097 | 3.91 | |||||
| Marijuana | Jay Wagner | 313 | 0.58 | −0.94 | ||||
| Communist | Dan Goldstick | 106 | 0.20 | −0.05 | ||||
| Marxist–Leninist | Philip Fernandez | 65 | 0.12 | −0.12 | ||||
| Canadian Action | Kevin Peck | 63 | 0.12 | −2.97 | ||||
| Total valid votes | 53,663 | 100.00 | ||||||
| Conservative vote is compared to the total of the Canadian Alliance vote and Progressive Conservative vote in 2000 election. | ||||||||
Toronto Centre—Rosedale, 1996–2003
| 2000 Canadian federal election | ||||||||
|---|---|---|---|---|---|---|---|---|
| Party | Candidate | Votes | % | ±% | ||||
| Liberal | Bill Graham | 26,264 | 55.27 | +6.08 | ||||
| Progressive Conservative | Randall Pearce | 8,150 | 17.15 | -2.13 | ||||
| New Democratic | David Berlin | 5,398 | 11.36 | -9.22 | ||||
| Alliance | Richard Walker | 5,057 | 10.64 | +2.83 | ||||
| Canadian Action | Paul Hellyer | 1,466 | 3.09 | +2.44 | ||||
| Marijuana | Neev Tapiero | 722 | 1.52 | |||||
| Natural Law | David Gordon | 224 | 0.47 | -0.11 | ||||
| Communist | Dan Goldstick | 121 | 0.25 | |||||
| Marxist–Leninist | Philip Fernandez | 116 | 0.24 | -0.11 | ||||
| Total valid votes | 47,518 | 100.00 | ||||||
Note: Canadian Alliance vote is compared to the Reform vote in 1997 election.
| 1997 Canadian federal election | ||||||||
|---|---|---|---|---|---|---|---|---|
| Party | Candidate | Votes | % | ±% | ||||
| Liberal | Bill Graham | 22,945 | 49.19 | -0.80 | ||||
| New Democratic | David MacDonald | 9,597 | 20.58 | +9.80 | ||||
| Progressive Conservative | Stephen Probyn | 8,993 | 19.28 | -1.96 | ||||
| Reform | John Stewart | 3,646 | 7.82 | -4.65 | ||||
| Green | Jim Harris | 577 | 1.24 | +0.30 | ||||
| Canadian Action | Anthony Robert Pedrette | 303 | 0.65 | |||||
| Natural Law | Ron Parker | 270 | 0.58 | -1.01 | ||||
| Marxist–Leninist | Steve Rutchinski | 166 | 0.36 | +0.25 | ||||
| Independent | Ted W. Culp | 145 | 0.31 | |||||
| Total valid votes | 46,642 | 100.00 | ||||||
Rosedale, 1933–1996
| 1993 Canadian federal election | ||||||||
|---|---|---|---|---|---|---|---|---|
| Party | Candidate | Votes | % | ±% | ||||
| Liberal | Bill Graham | 25,726 | 50.00 | +8.78 | ||||
| Progressive Conservative | David MacDonald | 10,930 | 21.24 | -20.12 | ||||
| Reform | Daniel Jovkovic | 6,413 | 12.46 | |||||
| New Democratic | Jack Layton | 5,547 | 10.78 | -4.28 | ||||
| National | Martin Lanigan | 1,091 | 2.12 | |||||
| Natural Law | Doug Henning | 817 | 1.59 | |||||
| Green | Leslie Hunter | 483 | 0.94 | +0.22 | ||||
| Independent | Linda Dale Gibbons | 350 | 0.68 | |||||
| Marxist–Leninist | Steve Rutchinski | 57 | 0.11 | |||||
| Abolitionist | Yann Patrice D'Audibert Garcien | 40 | 0.08 | |||||
| Total valid votes | 51,454 | 100.00 | ||||||
| 1988 Canadian federal election | ||||||||
|---|---|---|---|---|---|---|---|---|
| Party | Candidate | Votes | % | ±% | ||||
| Progressive Conservative | David MacDonald | 22,704 | 41.36 | -11.44 | ||||
| Liberal | Bill Graham | 22,624 | 41.21 | +15.08 | ||||
| New Democratic | Doug Wilson | 8,266 | 15.06 | -2.77 | ||||
| Libertarian | Chris Blatchly | 411 | 0.75 | +0.09 | ||||
| Green | Frank de Jong | 397 | 0.72 | -1.15 | ||||
| Rhinoceros | Liane McLarty | 265 | 0.48 | |||||
| Independent | Mike Constable | 102 | 0.19 | |||||
| Independent | Harry Margel | 91 | 0.17 | |||||
| Commonwealth of Canada | Paul Therrien | 33 | 0.06 | -0.27 | ||||
| Total valid votes | 54,893 | 100.00 | ||||||
| 1984 Canadian federal election | ||||||||
|---|---|---|---|---|---|---|---|---|
| Party | Candidate | Votes | % | ±% | ||||
| Progressive Conservative | David Crombie | 23,211 | 52.80 | +8.84 | ||||
| Liberal | Bill Graham | 11,488 | 26.13 | -12.95 | ||||
| New Democratic | Dell Wolfson | 7,836 | 17.82 | +2.97 | ||||
| Green | Shirley Ruth Farlinger | 821 | 1.87 | |||||
| Libertarian | Clarke Slemon | 291 | 0.66 | +0.30 | ||||
| Communist | Sylvie Baillargeon | 172 | 0.39 | +0.17 | ||||
| Commonwealth of Canada | David Dube | 144 | 0.33 | |||||
| Total valid votes | 43,963 | 100.00 | ||||||
| 1980 Canadian federal election | ||||||||
|---|---|---|---|---|---|---|---|---|
| Party | Candidate | Votes | % | ±% | ||||
| Progressive Conservative | David Crombie | 16,862 | 43.96 | -3.30 | ||||
| Liberal | Anne Cools | 14,993 | 39.08 | +6.07 | ||||
| New Democratic | Jim Hockley | 5,698 | 14.85 | -2.69 | ||||
| Rhinoceros | Geoff Yates | 319 | 0.83 | |||||
| Libertarian | Harry J. Nelson | 140 | 0.36 | -0.42 | ||||
| Independent | Frank Sommers | 125 | 0.33 | |||||
| Independent | Ann Ladas | 104 | 0.27 | -0.18 | ||||
| Communist | Dan Goldstick | 85 | 0.22 | +0.02 | ||||
| Marxist–Leninist | Alan Miller | 34 | 0.09 | +0.01 | ||||
| Total valid votes | 38,360 | 100.00 | ||||||
| 1979 Canadian federal election | ||||||||
|---|---|---|---|---|---|---|---|---|
| Party | Candidate | Votes | % | ±% | ||||
| Progressive Conservative | David Crombie | 18,594 | 47.26 | -10.69 | ||||
| Liberal | Anne Cools | 12,987 | 33.01 | +1.72 | ||||
| New Democratic | Ron B. Thomson | 6,902 | 17.54 | +8.24 | ||||
| Libertarian | Alex W. Eaglesham | 305 | 0.78 | |||||
| Independent | Hans Blumenfeld | 196 | 0.50 | |||||
| Independent | Ann Ladas | 176 | 0.45 | |||||
| Communist | Dan Goldstick | 80 | 0.20 | -0.17 | ||||
| Independent | Joanne Pritchard | 49 | 0.12 | |||||
| Marxist–Leninist | Alan Miller | 32 | 0.08 | |||||
| Independent | Sean Howes | 27 | 0.07 | – | ||||
| Total valid votes | 39,348 | 100.00 | ||||||
| By-election on October 16, 1978 | ||||||
| Party | Candidate | Votes | % | ±% | ||
|---|---|---|---|---|---|---|
| Progressive Conservative | David Crombie | 18,732 | 57.95 | +17.68 | ||
| Liberal | John Robert Evans | 10,114 | 31.29 | -17.84 | ||
| New Democratic | Ron B. Thomson | 3,008 | 9.31 | -0.06 | ||
| Independent | Donald M. Campbell | 196 | 0.61 | |||
| Independent | Linda Cain | 155 | 0.48 | |||
| Communist | Dan Goldstick | 120 | 0.37 | -0.02 | ||
| Total valid votes | 32,325 | 100.00 | ||||
| 1974 Canadian federal election | ||||||||
|---|---|---|---|---|---|---|---|---|
| Party | Candidate | Votes | % | ±% | ||||
| Liberal | Donald Stovel Macdonald | 17,227 | 49.13 | +5.11 | ||||
| Progressive Conservative | Hal Jackman | 14,119 | 40.27 | -0.42 | ||||
| New Democratic | Maurice Desjardins | 3,285 | 9.37 | -3.22 | ||||
| Independent | Marshall Bruce Evoy | 220 | 0.63 | |||||
| Communist | Dan Goldstick | 136 | 0.39 | |||||
| Marxist–Leninist | Vern Harper | 75 | 0.21 | |||||
| Total valid votes | 35,062 | 100.00 | ||||||
| 1972 Canadian federal election | ||||||||
|---|---|---|---|---|---|---|---|---|
| Party | Candidate | Votes | % | ±% | ||||
| Liberal | Donald Stovel Macdonald | 16,073 | 44.02 | -13.40 | ||||
| Progressive Conservative | Warren Beamish | 14,856 | 40.69 | +11.44 | ||||
| New Democratic | Ron Sabourin | 4,598 | 12.59 | +0.26 | ||||
| Independent | Aline Gregory | 892 | 2.44 | |||||
| Independent | David Starbuck | 95 | 0.26 | |||||
| Total valid votes | 36,514 | 100.00 | ||||||
| 1968 Canadian federal election | ||||||||
|---|---|---|---|---|---|---|---|---|
| Party | Candidate | Votes | % | ±% | ||||
| Liberal | Donald Stovel Macdonald | 19,011 | 57.42 | +12.58 | ||||
| Progressive Conservative | Bob Bradley | 9,683 | 29.25 | -5.16 | ||||
| New Democratic | John Chamard | 4,083 | 12.33 | -8.41 | ||||
| Communist | F. Nelson Clarke | 183 | 0.55 | |||||
| Independent | Fred Reiner (New Canada Party) | 148 | 0.45 | |||||
| Total valid votes | 33,108 | 100.00 | ||||||
1933–1965

| 1965 Canadian federal election | ||||||||
|---|---|---|---|---|---|---|---|---|
| Party | Candidate | Votes | % | ±% | ||||
| Liberal | Donald Stovel Macdonald | 9,757 | 44.84 | -10.03 | ||||
| Progressive Conservative | Hal Jackman | 7,487 | 34.41 | +5.38 | ||||
| New Democratic | Harding E. Bishop | 4,514 | 20.75 | +5.67 | ||||
| Total valid votes | 21,758 | 100.00 | ||||||
| 1963 Canadian federal election | ||||||||
|---|---|---|---|---|---|---|---|---|
| Party | Candidate | Votes | % | ±% | ||||
| Liberal | Donald Stovel Macdonald | 12,860 | 54.87 | +12.06 | ||||
| Progressive Conservative | Hal Jackman | 6,803 | 29.03 | -11.28 | ||||
| New Democratic | Harding E. Bishop | 3,534 | 15.08 | -0.79 | ||||
| Social Credit | George Leslie | 240 | 1.02 | +0.01 | ||||
| Total valid votes | 23,437 | 100.00 | ||||||
| 1962 Canadian federal election | ||||||||
|---|---|---|---|---|---|---|---|---|
| Party | Candidate | Votes | % | ±% | ||||
| Liberal | Donald Stovel Macdonald | 10,191 | 42.81 | +16.54 | ||||
| Progressive Conservative | David J. Walker | 9,597 | 40.31 | -22.89 | ||||
| New Democratic | Desmond Sparham | 3,778 | 15.87 | +5.34 | ||||
| Social Credit | John David Brunne | 240 | 1.01 | |||||
| Total valid votes | 23,806 | 100.00 | ||||||
Note: NDP vote is compared to CCF vote in 1958 election.
| 1958 Canadian federal election | ||||||||
|---|---|---|---|---|---|---|---|---|
| Party | Candidate | Votes | % | ±% | ||||
| Progressive Conservative | David J. Walker | 15,429 | 63.21 | +8.93 | ||||
| Liberal | Tom O'Neill | 6,412 | 26.27 | -4.87 | ||||
| Co-operative Commonwealth | Tom McAulay | 2,570 | 10.53 | -2.75 | ||||
| Total valid votes | 24,411 | 100.00 | ||||||
| 1957 Canadian federal election | ||||||||
|---|---|---|---|---|---|---|---|---|
| Party | Candidate | Votes | % | ±% | ||||
| Progressive Conservative | David J. Walker | 12,415 | 54.28 | +14.57 | ||||
| Liberal | Charles Henry | 7,122 | 31.14 | -10.06 | ||||
| Co-operative Commonwealth | Tom McAulay | 3,038 | 13.28 | -4.36 | ||||
| Social Credit | Harvey Jamieson | 299 | 1.31 | |||||
| Total valid votes | 22,874 | 100.00 | ||||||
| 1953 Canadian federal election | ||||||||
|---|---|---|---|---|---|---|---|---|
| Party | Candidate | Votes | % | ±% | ||||
| Liberal | Charles Henry | 8,702 | 41.20 | +1.35 | ||||
| Progressive Conservative | David J. Walker | 8,386 | 39.70 | +2.23 | ||||
| Co-operative Commonwealth | Dudley Bristow | 3,727 | 17.64 | -5.04 | ||||
| Labor–Progressive | Janet M. Clark | 308 | 1.46 | |||||
| Total valid votes | 21,123 | 100.00 | ||||||
| 1949 Canadian federal election | ||||||||
|---|---|---|---|---|---|---|---|---|
| Party | Candidate | Votes | % | ±% | ||||
| Liberal | Charles Henry | 10,835 | 39.84 | +10.85 | ||||
| Progressive Conservative | Harry Jackman | 10,189 | 37.47 | -11.37 | ||||
| Co-operative Commonwealth | Dudley Bristow | 6,170 | 22.69 | +4.69 | ||||
| Total valid votes | 27,194 | 100.00 | ||||||
Note: Progressive Conservative vote is compared to "National Government" vote in 1945 election.
| 1945 Canadian federal election | ||||||||
|---|---|---|---|---|---|---|---|---|
| Party | Candidate | Votes | % | ±% | ||||
| Progressive Conservative | Harry Jackman | 11,784 | 48.84 | +3.38 | ||||
| Liberal | William Kearns | 6,997 | 29.00 | -20.80 | ||||
| Co-operative Commonwealth | David Cass-Beggs | 4,342 | 17.99 | +13.25 | ||||
| Labor–Progressive | John Weir | 1,006 | 4.17 | |||||
| Total valid votes | 24,129 | 100.00 | ||||||
Note: Progressive Conservative vote is compared to "National Government" vote in 1940 election.
| 1940 Canadian federal election | ||||||||
|---|---|---|---|---|---|---|---|---|
| Party | Candidate | Votes | % | ±% | ||||
| National Government | Harry Jackman | 12,519 | 52.36 | +12.1 | ||||
| Liberal | J. Louis Shannon | 10,399 | 43.49 | +8.25 | ||||
| Co-operative Commonwealth | Norah Dymond | 991 | 4.14 | -5.52 | ||||
| Total valid votes | 23,909 | 100.00 | ||||||
Note: "National Government" vote is compared to Conservative vote in 1935 election.
| 1935 Canadian federal election | ||||||||
|---|---|---|---|---|---|---|---|---|
| Party | Candidate | Votes | % | ±% | ||||
| Conservative | Harry Clarke | 9,491 | 40.26 | -13.62 | ||||
| Liberal | George Alexander Urquhart | 8,306 | 35.24 | -10.88 | ||||
| Co-operative Commonwealth | William Dennison | 2,765 | 11.73 | |||||
| Reconstruction | Bert Watts | 2,277 | 9.66 | |||||
| Communist | Samuel Scarlett | 733 | 3.11 | |||||
| Total valid votes | 23,572 | 100.00 | ||||||
Toronto Centre, 1903–1924
| 1921 Canadian federal election | ||||||||
|---|---|---|---|---|---|---|---|---|
| Party | Candidate | Votes | % | ±% | ||||
| Conservative | Edmund Bristol | 5,985 | 53.88 | -20.57 | ||||
| Liberal | Norman McEachren | 5,123 | 46.12 | +21.91 | ||||
| Total valid votes | 11,108 | 100.00 | ||||||
Note: Conservative vote is compared to Unionist vote in 1917 election.
| 1917 Canadian federal election | ||||||||
|---|---|---|---|---|---|---|---|---|
| Party | Candidate | Votes | % | ±% | ||||
| Government (Unionist) | Edmund Bristol | 12,051 | 74.45 | +11.19 | ||||
| Opposition (Laurier Liberals) | Charles MacGuire | 3,918 | 24.21 | -12.53 | ||||
| Unknown | Archie Dramin | 217 | 1.34 | |||||
| Total valid votes | 16,186 | 100.00 | ||||||
Note: Unionist vote is compared to Liberal-Conservative vote in 1911 election.
| 1911 Canadian federal election | ||||||||
|---|---|---|---|---|---|---|---|---|
| Party | Candidate | Votes | % | ±% | ||||
| Conservative | Edmund Bristol | 5,156 | 63.26 | +11.88 | ||||
| Liberal | Charles MacGuire | 2,994 | 36.74 | -11.88 | ||||
| Total valid votes | 8,150 | 100.00 | ||||||
| 1908 Canadian federal election | ||||||||
|---|---|---|---|---|---|---|---|---|
| Party | Candidate | Votes | % | ±% | ||||
| Conservative | Edmund Bristol | 3,482 | 51.38 | -0.96 | ||||
| Liberal | T.C. Robinette | 3,295 | 48.62 | 0.96 | ||||
| Total valid votes | 6,777 | 100.00 | ||||||
Note: vote compared to 1904 election.
| By-election on April 11, 1905 | |||||
| Party | Candidate | Votes | |||
|---|---|---|---|---|---|
| Conservative | Edmund Bristol | acc. | |||
| 1904 Canadian federal election | ||||||||
|---|---|---|---|---|---|---|---|---|
| Party | Candidate | Votes | % | ±% | ||||
| Conservative | E.F. Clarke | 4,321 | 52.34 | +2.00 | ||||
| Liberal | T.C. Robinette | 3,935 | 47.66 | +1.43 | ||||
| Total valid votes | 8,256 | 100.00 | ||||||
Centre Toronto, 1872–1903
| 1900 Canadian federal election | ||||||||
|---|---|---|---|---|---|---|---|---|
| Party | Candidate | Votes | % | ±% | ||||
| Conservative | William Rees Brock | 2,625 | 50.34 | +3.33 | ||||
| Liberal | John Flett | 2,411 | 46.23 | -6.76 | ||||
| Labour | Henry Hargrave | 179 | 3.43 | |||||
| Total valid votes | 5,215 | 100.00 | ||||||
| By-election on September 30, 1897 | ||||||
| Party | Candidate | Votes | % | ±% | ||
|---|---|---|---|---|---|---|
| Liberal | G.H. Bertram | 2,212 | 52.99 | +0.36 | ||
| Conservative | O.A. Howland | 1,962 | 47.01 | -0.36 | ||
| Total valid votes | 4,174 | 100.00 | ||||
| 1896 Canadian federal election | ||||||||
|---|---|---|---|---|---|---|---|---|
| Party | Candidate | Votes | % | ±% | ||||
| Liberal | William Lount | 2,394 | 52.64 | +8.44 | ||||
| Conservative | George Cockburn | 2,154 | 47.36 | -8.44 | ||||
| Total valid votes | 4,548 | 100.00 | ||||||
| 1891 Canadian federal election | ||||||||
|---|---|---|---|---|---|---|---|---|
| Party | Candidate | Votes | % | ±% | ||||
| Conservative | George Cockburn | 2,414 | 55.80 | +0.28 | ||||
| Liberal | James Kirkpatrick Kerr | 1,912 | 44.20 | -0.28 | ||||
| Total valid votes | 4,326 | 100.00 | ||||||
| 1887 Canadian federal election | ||||||||
|---|---|---|---|---|---|---|---|---|
| Party | Candidate | Votes | % | ±% | ||||
| Conservative | George Cockburn | 2,282 | 55.52 | |||||
| Liberal | John Harvie | 1,828 | 44.48 | -8.78 | ||||
| Total valid votes | 4,110 | 100.00 | ||||||
| 1882 Canadian federal election | ||||||||
|---|---|---|---|---|---|---|---|---|
| Party | Candidate | Votes | % | ±% | ||||
| Liberal | Robert Hay | 1,620 | 53.25 | -5.58 | ||||
| Unknown | J.D. Edgar | 1,422 | 46.75 | |||||
| Total valid votes | 3,042 | 100.00 | ||||||
| 1878 Canadian federal election | ||||||||
|---|---|---|---|---|---|---|---|---|
| Party | Candidate | Votes | % | ±% | ||||
| Liberal | Robert Hay | 1,631 | 58.84 | +3.64 | ||||
| Independent Liberal | John MacDonald | 1,141 | 41.16 | |||||
| Total valid votes | 2,772 | 100.00 | ||||||
Note: vote compared to 1874 election.
| By-election on December 4, 1875 | |||||
| Party | Candidate | Votes | |||
|---|---|---|---|---|---|
| Liberal | John MacDonald | acc. | |||
| 1874 Canadian federal election | ||||||||
|---|---|---|---|---|---|---|---|---|
| Party | Candidate | Votes | % | ±% | ||||
| Liberal | Robert Wilkes | 1,509 | 55.19 | -0.76 | ||||
| Unknown | A. Morrison | 1,225 | 44.81 | |||||
| Total valid votes | – | 100.00 | ||||||
| 1872 Canadian federal election | ||||||||
|---|---|---|---|---|---|---|---|---|
| Party | Candidate | Votes | % | |||||
| Liberal | Robert Wilkes | 1,509 | 55.95 | |||||
| Unknown | Mr. Shanly | 1,188 | 44.05 | |||||
| Total valid votes | 2,697 | 100.00 | ||||||
See also
- List of Canadian federal electoral districts
- Past Canadian electoral districts
References
- "(Code 35093) Census Profile". 2011 census. Statistics Canada. 2012. Retrieved 2011-03-03.
- Statistics Canada: 2017
- "Toronto Centre boundaries description, 2013 Representation Order". Elections Canada. Retrieved 13 August 2014.
- Wingrove, Josh (11 July 2013). "Bob Rae sets departure date as First Nations work picks up". The Globe and Mail. Retrieved 11 July 2013.
- "Bob Rae quits as MP in 'very emotional' decision". CBC. 19 June 2013. Retrieved 11 July 2013.
- http://www12.statcan.gc.ca/nhs-enm/2011/dp-pd/prof/details/page.cfm?Lang=E&Geo1=FED&Code1=35093&Data=Count&SearchText=Toronto%20Centre&SearchType=Begins&SearchPR=01&A1=All&B1=All&Custom=&TABID=1
- https://www12.statcan.gc.ca/census-recensement/2016/dp-pd/dt-td/Rp-eng.cfm?LANG=E&APATH=3&DETAIL=0&DIM=0&FL=A&FREE=0&GC=0&GID=0&GK=0&GRP=1&PID=109983&PRID=10&PTYPE=109445&S=0&SHOWALL=0&SUB=0&Temporal=2016&THEME=118&VID=0&VNAMEE=&VNAMEF=
- "List of confirmed candidates". Elections Canada. Retrieved 4 October 2019.
- "Election night results". Elections Canada. Retrieved 22 October 2019.
- Elections Canada – Confirmed candidates for Toronto Centre, 30 September 2015
- Elections Canada – Preliminary Election Expenses Limits for Candidates
- Pundits' Guide to Canadian Elections
- , ctv news, September 21, 2008
- ,CBC News Online, September 21, 2008
- Tory candidates forced to withdraw, Unnati Gandhi, Globe and Mail, November 1, 2007
- Canadian Press Archived December 25, 2007, at the Wayback Machine