London West
London West (French: London-Ouest) is a federal electoral district in London, Ontario, Canada, that has been represented in the House of Commons of Canada since 1968.
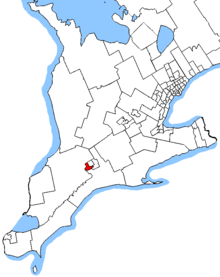 Map showing the location of London West within Southwestern Ontario (2013 boundaries) | |||
| Federal electoral district | |||
| Legislature | House of Commons | ||
| MP |
Liberal | ||
| District created | 1966 | ||
| First contested | 1968 | ||
| Last contested | 2019 | ||
| District webpage | profile, map | ||
| Demographics | |||
| Population (2011)[1] | 119,090 | ||
| Electors (2015) | 91,601 | ||
| Area (km²)[2] | 82 | ||
| Pop. density (per km²) | 1,452.3 | ||
| Census divisions | Middlesex | ||
| Census subdivisions | London | ||
Geography
The district includes the northwest part of the City of London.
In 2003, it was defined to consist of the part of the city lying north and west of a line drawn from the western limit of the city along Dingman Creek, Southdale Road West, Wharncliffe Road South, Commissioners Road East, the Canadian National Railway, the Thames River, Wharncliffe Road North, Oxford Street West and Wonderland Road North.
History
The electoral district was created in 1966 from London, Middlesex East, and from Middlesex West.
It initially consisted of the part of the City of London west of a line drawn from north to south along Adelaide Street, Dundas Street, Wellington Street and Wellington Road.
In 1976, it was redefined to consist of the part of the city west of a line drawn from south to north along Southdale Road, Wellington Road, the Thames River and the North Thames River, Dundas Street, Colborne Street, Huron Street and Richmond Street.
In 1987, it was redefined to consist of the part of the city lying north and west of a line drawn from the southern limit of the city along Wharncliffe Road South, Commissioners Road East, Wellington Road, the Thames River, the North Thames River, the Medway River, Western Road and Richmond Street.
In 1996, it was redefined to consist of the part of the city lying north and west of a line drawn from the western limit of the city along Dingman Creek, Southdale Road West, Wharncliffe Road South, Commissioners Road East, the London and Port Stanley Electric Railway, the Thames River, Wharncliffe Road, Oxford Street, Wonderland Road North and Hutton Road.
In 2003, it was given its current boundaries as described above.
This riding lost territory to London North Centre during the 2012 electoral redistribution.
Demographics
- According to the Canada 2011 Census
Ethnic groups: 83.3% White, 2.9% Latin American, 2.4% Arab, 2.1% South Asian, 2.1% Black, 2.1% Chinese, 1.6% Aboriginal
Languages: 80.6% English, 2.8% Spanish, 2.2% Arabic, 1.7% French, 1.5% Chinese, 1.2% Polish
Religions: 65.4% Christian (27.1% Catholic, 11.1% United Church, 8.0% Anglican, 2.5% Baptist, 2.0% Christian Orthodox, 1.3% Lutheran), 4.5% Muslim, 27.8 No religion
Median income (2005): $29,322
Members of Parliament
This riding has elected the following Members of Parliament:
| Parliament | Years | Member | Party | |
|---|---|---|---|---|
| London West Riding created from London, Middlesex East and Middlesex West |
||||
| 28th | 1968–1972 | Judd Buchanan | Liberal | |
| 29th | 1972–1974 | |||
| 30th | 1974–1979 | |||
| 31st | 1979–1980 | |||
| 32nd | 1980–1980 | |||
| 1981–1984 | Jack Burghardt | |||
| 33rd | 1984–1988 | Tom Hockin | Progressive Conservative | |
| 34th | 1988–1993 | |||
| 35th | 1993–1997 | Sue Barnes | Liberal | |
| 36th | 1997–2000 | |||
| 37th | 2000–2004 | |||
| 38th | 2004–2006 | |||
| 39th | 2006–2008 | |||
| 40th | 2008–2011 | Ed Holder | Conservative | |
| 41st | 2011–2015 | |||
| 42nd | 2015–2019 | Kate Young | Liberal | |
| 43rd | 2019–present | |||
Election results
| 2019 Canadian federal election | ||||||||
|---|---|---|---|---|---|---|---|---|
| Party | Candidate | Votes | % | ±% | Expenditures | |||
| Liberal | Kate Young | 30,622 | 42.96 | -2.86 | ||||
| Conservative | Liz Snelgrove | 19,910 | 27.93 | -7.40 | ||||
| New Democratic | Shawna Lewkowitz | 15,220 | 21.35 | +6.52 | ||||
| Green | Mary Ann Hodge | 3,827 | 5.37 | +2.55 | ||||
| People's | Mike Mcmullen | 1,171 | 1.64 | +1.64 | ||||
| Libertarian | Jacques Boudreau | 523 | 0.73 | - | ||||
| Total valid votes/Expense limit | 71,273 | 100.0 | ||||||
| Total rejected ballots | 496 | |||||||
| Turnout | 71,769 | 72.0 | ||||||
| Eligible voters | 99,677 | |||||||
| Source: Elections Canada[3][4] | ||||||||
| 2015 Canadian federal election | ||||||||
|---|---|---|---|---|---|---|---|---|
| Party | Candidate | Votes | % | ±% | Expenditures | |||
| Liberal | Kate Young | 31,167 | 45.82 | +19.09 | $126,846.59 | |||
| Conservative | Ed Holder | 24,036 | 35.33 | -9.74 | $193,780.18 | |||
| New Democratic | Matthew Rowlinson | 10,087 | 14.83 | -10.59 | $56,369.31 | |||
| Green | Dimitri Lascaris | 1,918 | 2.82 | +0.14 | $31,948.87 | |||
| Libertarian | Jacques Y. Boudreau | 732 | 1.08 | – | – | |||
| Communist | Michael Lewis | 87 | 0.13 | – | – | |||
| Total valid votes/Expense limit | 68,027 | 100.00 | $234,461.82 | |||||
| Total rejected ballots | 286 | 0.42 | – | |||||
| Turnout | 68,313 | 73.99 | – | |||||
| Eligible voters | 92,326 | |||||||
| Liberal gain from Conservative | Swing | +14.41 | ||||||
| Source: Elections Canada[5][6] | ||||||||
| 2011 federal election redistributed results[7] | |||
|---|---|---|---|
| Party | Vote | % | |
| Conservative | 26,296 | 45.07 | |
| Liberal | 15,595 | 26.73 | |
| New Democratic | 14,830 | 25.42 | |
| Green | 1,563 | 2.68 | |
| Others | 59 | 0.10 | |
| 2011 Canadian federal election | ||||||||
|---|---|---|---|---|---|---|---|---|
| Party | Candidate | Votes | % | ±% | Expenditures | |||
| Conservative | Ed Holder | 27,675 | 44.49 | +5.40 | – | |||
| Liberal | Doug Ferguson | 16,652 | 26.77 | -8.64 | – | |||
| New Democratic | Peter Ferguson | 16,109 | 25.90 | +11.33 | – | |||
| Green | Brad Arthur Corbett | 1,703 | 2.74 | -7.01 | – | |||
| United | Rod Morley | 65 | 0.10 | – | – | |||
| Total valid votes | 62,204 | 100.00 | – | |||||
| Total rejected ballots | 273 | 0.44 | +0.08 | – | ||||
| Turnout | 62,477 | 67.49 | +4.35 | |||||
| Eligible voters | 92,572 | – | – | |||||
| 2008 Canadian federal election | ||||||||
|---|---|---|---|---|---|---|---|---|
| Party | Candidate | Votes | % | ±% | Expenditures | |||
| Conservative | Ed Holder | 22,556 | 39.09 | +3.4 | $90,739 | |||
| Liberal | Sue Barnes | 20,435 | 35.41 | -2.5 | $72,288 | |||
| New Democratic | Peter Lawrence Ferguson | 8,409 | 14.57 | -6.9 | $18,620 | |||
| Green | Monica Jarabek | 5,601 | 9.75 | +4.9 | $15,205 | |||
| Progressive Canadian | Steve Hunter | 414 | 0.71 | +0.3 | $750 | |||
| Christian Heritage | Leslie Bartley | 253 | 0.43 | – | $39 | |||
| Total valid votes/Expense limit | 57,697 | 100.00 | $92,384 | |||||
| Total rejected ballots | 211 | 0.36 | ||||||
| Turnout | 57,908 | 63.14 | ||||||
| 2006 Canadian federal election | ||||||||
|---|---|---|---|---|---|---|---|---|
| Party | Candidate | Votes | % | ±% | ||||
| Liberal | Sue Barnes | 23,019 | 37.9 | -7.6 | ||||
| Conservative | Al Gretzky | 21,690 | 35.7 | +4.2 | ||||
| New Democratic | Gina Barber | 13,056 | 21.5 | +4.2 | ||||
| Green | Monica Jarabek | 2,900 | 4.8 | +0.1 | ||||
| Progressive Canadian | Steve Hunter | 328 | 0.5 | -0.4 | ||||
| Marxist–Leninist | Margaret Villamizer | 59 | 0.1 | 0.0 | ||||
| Total valid votes | 60,724 | 100.0 | ||||||
| 2004 Canadian federal election | ||||||||
|---|---|---|---|---|---|---|---|---|
| Party | Candidate | Votes | % | ±% | ||||
| Liberal | Sue Barnes | 25,061 | 45.5 | -3.9 | ||||
| Conservative | Mike Menear | 17,335 | 31.5 | -9.9 | ||||
| New Democratic | Gina Barber | 9,522 | 17.3 | +9.8 | ||||
| Green | Rebecca Bromwich | 2,611 | 4.7 | +3.5 | ||||
| Progressive Canadian | Steve Hunter | 511 | 0.9 | |||||
| Marxist–Leninist | Margaret Villamizar | 67 | 0.1 | 0.0 | ||||
| Total valid votes | 55,107 | 100.0 | ||||||
| 2000 Canadian federal election | ||||||||
|---|---|---|---|---|---|---|---|---|
| Party | Candidate | Votes | % | ±% | ||||
| Liberal | Sue Barnes | 23,794 | 49.4 | +0.8 | ||||
| Alliance | Salim Mansur | 10,162 | 21.1 | +3.7 | ||||
| Progressive Conservative | Jeff Lang | 9,788 | 20.3 | -1.2 | ||||
| New Democratic | George Goodlet | 3,596 | 7.5 | -2.9 | ||||
| Green | Jeremy Price | 614 | 1.3 | +0.3 | ||||
| Canadian Action | Richard Goos | 162 | 0.3 | |||||
| Marxist–Leninist | Margaret Villamizar | 80 | 0.2 | 0.0 | ||||
| Total valid votes | 48,196 | 100.0 | ||||||
| 1997 Canadian federal election | ||||||||
|---|---|---|---|---|---|---|---|---|
| Party | Candidate | Votes | % | ±% | ||||
| Liberal | Sue Barnes | 24,710 | 48.6 | +0.2 | ||||
| Progressive Conservative | Frank Mazzilli | 10,958 | 21.5 | -2.0 | ||||
| Reform | Terry Biggs | 8,839 | 17.4 | -2.7 | ||||
| New Democratic | Sandra McNee | 5,291 | 10.4 | +6.4 | ||||
| Christian Heritage | Stan Winters | 515 | 1.0 | +0.5 | ||||
| Green | Rachelle Small | 497 | 1.0 | +0.4 | ||||
| Marxist–Leninist | Margaret Villamizar | 83 | 0.2 | |||||
| Total valid votes | 50,893 | 100.0 | ||||||
| 1993 Canadian federal election | ||||||||
|---|---|---|---|---|---|---|---|---|
| Party | Candidate | Votes | % | ±% | ||||
| Liberal | Sue Barnes | 31,084 | 48.3 | +10.8 | ||||
| Progressive Conservative | Tom Hockin | 15,169 | 23.6 | -22.1 | ||||
| Reform | Todd Christensen | 12,900 | 20.1 | |||||
| New Democratic | Margaret Hoff | 2,551 | 4.0 | -12.1 | ||||
| National | Michael van Holst | 1,219 | 1.9 | |||||
| Green | Heidi Strasser | 401 | 0.6 | |||||
| Natural Law | Mark Hawkins | 381 | 0.6 | |||||
| Christian Heritage | Ken DeVries | 308 | 0.5 | |||||
| Canada Party | Tom Ha | 178 | 0.3 | |||||
| Independent | Ivan W. Kasiurak | 111 | 0.2 | |||||
| Abolitionist | Judith Foster | 33 | 0.1 | |||||
| Total valid votes | 64,335 | 100.0 | ||||||
| 1988 Canadian federal election | ||||||||
|---|---|---|---|---|---|---|---|---|
| Party | Candidate | Votes | % | ±% | ||||
| Progressive Conservative | Tom Hockin | 28,392 | 45.7 | -5.7 | ||||
| Liberal | Mary Copps-Sutherland | 23,321 | 37.5 | +5.2 | ||||
| New Democratic | Bruce Lundgren | 10,007 | 16.1 | -0.2 | ||||
| Libertarian | Hubert Ramolla | 435 | 0.7 | |||||
| Total valid votes | 62,155 | 100.0 | ||||||
| 1984 Canadian federal election | ||||||||
|---|---|---|---|---|---|---|---|---|
| Party | Candidate | Votes | % | ±% | ||||
| Progressive Conservative | Tom Hockin | 34,517 | 51.4 | +6.6 | ||||
| Liberal | Jack Burghardt | 21,701 | 32.3 | -14.4 | ||||
| New Democratic | Bruce Lundgren | 10,911 | 16.3 | +8.2 | ||||
| Total valid votes | 67,129 | 100.0 | ||||||
| By-election on 13 April 1981 | ||||||
| Party | Candidate | Votes | % | ±% | ||
|---|---|---|---|---|---|---|
| Liberal | Jack Burghardt | 21,952 | 46.8 | +2.6 | ||
| Progressive Conservative | Tom Hockin | 21,022 | 44.8 | +4.0 | ||
| New Democratic | Bruce Lundgren | 3,802 | 8.1 | -6.3 | ||
| Independent | Denise Sweeney Seguin | 87 | 0.2 | |||
| Independent | Roger J. Smith | 44 | 0.1 | |||
| Independent | John Turmel | 37 | 0.1 | |||
| Total valid votes | 46,944 | 100.0 | ||||
| 1980 Canadian federal election | ||||||||
|---|---|---|---|---|---|---|---|---|
| Party | Candidate | Votes | % | ±% | ||||
| Liberal | Judd Buchanan | 27,118 | 44.2 | +1.8 | ||||
| Progressive Conservative | Don McDougall | 25,031 | 40.8 | -0.7 | ||||
| New Democratic | Paddy Musson | 8,817 | 14.4 | -1.4 | ||||
| Rhinoceros | Stewart Showers | 224 | 0.4 | |||||
| Libertarian | Richard Keys | 159 | 0.3 | -0.1 | ||||
| Marxist–Leninist | John Stafford | 35 | 0.1 | 0.0 | ||||
| Total valid votes | 61,384 | 100.0 | ||||||
| 1979 Canadian federal election | ||||||||
|---|---|---|---|---|---|---|---|---|
| Party | Candidate | Votes | % | ±% | ||||
| Liberal | Judd Buchanan | 25,258 | 42.4 | -13.7 | ||||
| Progressive Conservative | John McGarry | 24,746 | 41.5 | +10.3 | ||||
| New Democratic | Paddy Musson | 9,378 | 15.7 | +3.3 | ||||
| Libertarian | Richard Keys | 187 | 0.3 | |||||
| Marxist–Leninist | John Stafford | 44 | 0.1 | |||||
| Total valid votes | 59,613 | 100.0 | ||||||
| 1974 Canadian federal election | ||||||||
|---|---|---|---|---|---|---|---|---|
| Party | Candidate | Votes | % | ±% | ||||
| Liberal | Judd Buchanan | 32,188 | 56.08 | +6.12 | ||||
| Progressive Conservative | Peter White | 17,893 | 31.18 | -3.75 | ||||
| New Democratic | John Crook | 7,142 | 12.44 | -2.67 | ||||
| Independent | Vay Jonynas | 170 | 0.30 | |||||
| Total valid votes | 57,393 | 100.00 | ||||||
| 1972 Canadian federal election | ||||||||
|---|---|---|---|---|---|---|---|---|
| Party | Candidate | Votes | % | ±% | ||||
| Liberal | Judd Buchanan | 29,474 | 49.96 | +0.63 | ||||
| Progressive Conservative | John F. Bennett | 20,611 | 34.93 | -6.92 | ||||
| New Democratic | Jim Bolton | 8,914 | 15.11 | +6.29 | ||||
| Total valid votes | 58,999 | 100.00 | ||||||
| 1968 Canadian federal election | ||||||||
|---|---|---|---|---|---|---|---|---|
| Party | Candidate | Votes | % | |||||
| Liberal | Judd Buchanan | 21,764 | 49.33 | |||||
| Progressive Conservative | Jack Irvine | 18,462 | 41.85 | |||||
| New Democratic | Gwen Pemberton | 3,891 | 8.82 | |||||
| Total valid votes | 44,117 | 100.00 | ||||||
See also
- List of Canadian federal electoral districts
- Past Canadian electoral districts
References
- "(Code 35044) Census Profile". 2011 census. Statistics Canada. 2012. Retrieved 2011-03-03.
Sources
- Federal riding history from the Library of Parliament
- 2011 Results from Elections Canada
- Campaign expense data from Elections Canada
Notes
- Statistics Canada: 2011
- Statistics Canada: 2011
- "List of confirmed candidates". Elections Canada. Retrieved October 4, 2019.
- "Election Night Results". Elections Canada. Retrieved October 30, 2019.
- Elections Canada – Confirmed candidates for London West, 30 September 2015
- Elections Canada – Preliminary Election Expenses Limits for Candidates Archived 2015-08-15 at the Wayback Machine
- Pundits' Guide to Canadian Elections
| Government | |||||||||
|---|---|---|---|---|---|---|---|---|---|
| Transportation | |||||||||
| Communities |
| ||||||||
| Education |
| ||||||||
| Culture |
| ||||||||
| Attractions |
| ||||||||
| Media |
| ||||||||
.png)