Elgin—Middlesex—London (provincial electoral district)
Elgin—Middlesex—London is a provincial electoral district in southwestern, Ontario, Canada. It elects one member to the Legislative Assembly of Ontario.
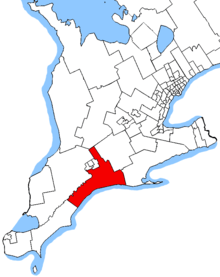 Elgin—Middlesex—London in relation to other Southwestern Ontario electoral districts | |||
| Provincial electoral district | |||
| Legislature | Legislative Assembly of Ontario | ||
| MPP |
Progressive Conservative | ||
| District created | 1996 | ||
| First contested | 1999 | ||
| Last contested | 2018 | ||
| Demographics | |||
| Population (2011) | 114,294 | ||
| Electors (2007) | 76,544 | ||
| Area (km²) | 2,652 | ||
| Pop. density (per km²) | 43.1 | ||
| Census divisions | Middlesex County, Elgin County | ||
| Census subdivisions | London, North Dorchester, Thames Centre, St. Thomas, Central Elgin, Malahide, Aylmer, Bayham, West Elgin, Southwold, Dutton/Dunwich | ||
It was created in 1999 from all of Elgin, and parts of Middlesex and London South.
When the riding was created, it included all of Elgin County plus the townships of Delaware and North Dorchester, and that part of London south of a line following Dingman Creek to Southdale Road to White Oak Road to Exeter Road to Meg Drive to Jalna Boulevard to Ernest Avenue to Bradley Avenue to the Wenige Expressway to Arran Place to Bradley Avenue.
In 2007, it lost Delaware Township, but gained all of Thames Centre.
Members
| Elgin—Middlesex—London | ||||
|---|---|---|---|---|
| Assembly | Years | Member | Party | |
| Riding created from Elgin, Middlesex and London South | ||||
| 37th | 1999–2003 | Steve Peters | Liberal | |
| 38th | 2003–2007 | |||
| 39th | 2007–2011 | |||
| 40th | 2011–2014 | Jeff Yurek | Progressive Conservative | |
| 41st | 2014–2018 | |||
| 42nd | 2018–Present | |||
Election results
| 2018 Ontario general election | ||||||||
|---|---|---|---|---|---|---|---|---|
| Party | Candidate | Votes | % | ±% | ||||
| Progressive Conservative | Jeff Yurek | 29,264 | 55.40 | +9.04 | ||||
| New Democratic | Amanda Stratton | 16,923 | 32.04 | +5.41 | ||||
| Liberal | Carlie Forsythe | 3,857 | 7.30 | -13.02 | ||||
| Green | Bronagh Morgan | 2,049 | 3.88 | -1.07 | ||||
| Libertarian | Richard Styve | 300 | 0.57 | |||||
| Freedom | Dave Plumb | 278 | 0.53 | -1.21 | ||||
| Objective Truth | Henri Barrette | 152 | 0.29 | |||||
| Total valid votes | 52,671 | 100.0 | ||||||
| Total rejected, unmarked and declined ballots | ||||||||
| Turnout | 60.87 | |||||||
| Eligible voters | 86,787 | |||||||
| Progressive Conservative hold | Swing | +1.82 | ||||||
| Source: Elections Ontario[1] | ||||||||
| 2014 Ontario general election | ||||||||
|---|---|---|---|---|---|---|---|---|
| Party | Candidate | Votes | % | ±% | ||||
| Progressive Conservative | Jeff Yurek | 20,946 | 46.36 | -1.50 | ||||
| New Democratic | Kathy Cornish | 12,034 | 26.63 | +4.36 | ||||
| Liberal | Serge Lavoie | 9,183 | 20.32 | -6.49 | ||||
| Green | John Fisher | 2,236 | 4.95 | +2.58 | ||||
| Freedom | Clare Maloney | 784 | 1.74 | +1.05 | ||||
| Total valid votes | 45,183 | 100.0 | ||||||
| Total rejected, unmarked and declined ballots | 682 | 1.51 | ||||||
| Turnout | 45,865 | 54.00 | ||||||
| Eligible voters | 84,970 | |||||||
| Progressive Conservative hold | Swing | -2.93 | ||||||
| Source: Elections Ontario[2][3] | ||||||||
| 2011 Ontario general election | ||||||||
|---|---|---|---|---|---|---|---|---|
| Party | Candidate | Votes | % | ±% | ||||
| Progressive Conservative | Jeff Yurek | 19,771 | 47.86 | +17.40 | ||||
| Liberal | Lori Baldwin-Sands | 11,075 | 26.81 | -22.26 | ||||
| New Democratic | Kathy Cornish | 9,201 | 22.27 | +10.89 | ||||
| Green | Eric Loewen | 981 | 2.37 | -5.85 | ||||
| Freedom | Paul McKeever | 283 | 0.69 | -0.17 | ||||
| Total valid votes | 41,311 | 100.00 | ||||||
| Total rejected, unmarked and declined ballots | 154 | 0.37 | ||||||
| Turnout | 41,465 | 51.28 | ||||||
| Eligible voters | 80,858 | |||||||
| Progressive Conservative gain from Liberal | Swing | +19.83 | ||||||
| Source: Elections Ontario[4][5] | ||||||||
| 2007 Ontario general election | ||||||||
|---|---|---|---|---|---|---|---|---|
| Party | Candidate | Votes | % | ±% | ||||
| Liberal | Steve Peters | 20,069 | 49.07 | -8.24 | ||||
| Progressive Conservative | Bill Fehr | 12,459 | 30.46 | +0.21 | ||||
| New Democratic | Brad James | 4,653 | 11.38 | +2.03 | ||||
| Green | Devin Kelly | 3,363 | 8.22 | +6.67 | ||||
| Freedom | Ray Monteith | 353 | 0.86 | -0.68 | ||||
| Total valid votes | 40,897 | 100.00 | ||||||
| 2003 Ontario general election | ||||||||
|---|---|---|---|---|---|---|---|---|
| Party | Candidate | Votes | % | ±% | ||||
| Liberal | Steve Peters | 24,914 | 57.31 | +11.12 | ||||
| Progressive Conservative | Bruce Smith | 13,149 | 30.25 | -13.29 | ||||
| New Democratic | Bryan K. Bakker | 4,063 | 9.35 | +1.53 | ||||
| Green | John R. Fisher | 673 | 1.55 | +0.67 | ||||
| Freedom | Ray Monteith | 671 | 1.54 | +0.62 | ||||
| Total valid votes | 43,470 | 100.00 | ||||||
| 1999 Ontario general election | ||||||||
|---|---|---|---|---|---|---|---|---|
| Party | Candidate | Votes | % | |||||
| Liberal | Steve Peters | 20,417 | 46.19 | |||||
| Progressive Conservative | Bruce Smith | 19,246 | 43.54 | |||||
| New Democratic | Dave La Pointe | 3,455 | 7.82 | |||||
| Freedom | Ray Monteith | 405 | 0.92 | |||||
| Green | John R Fisher | 391 | 0.88 | |||||
| Independent | Corey Janzen | 284 | 0.64 | |||||
| Total valid votes | 44,198 | 100.00 | ||||||
2007 electoral reform referendum
| 2007 Ontario electoral reform referendum | |||
|---|---|---|---|
| Side | Votes | % | |
| First Past the Post | 26,918 | 68.0 | |
| Mixed member proportional | 12,695 | 32.0 | |
| Total valid votes | 39,613 | 100.0 | |
Sources
- "Summary of Valid Votes Cast for each Candidate" (PDF). Elections Ontario. Retrieved 16 January 2019.
- Elections Ontario (2014). "Valid Votes Cast for Each Candidate - 2014 General Election" (PDF). Retrieved 30 May 2018.
- Elections Ontario (2014). "Statistical Summary - 2014 General Election and 2012-2014 By-elections" (PDF). Retrieved 30 May 2018.
- Elections Ontario (2014). "Valid Votes Cast for Each Candidate - 2011 General Election" (PDF). Retrieved 30 May 2018.
- Elections Ontario (2014). "Statistical Summary - 2011 General Election and 2008-2011 By-elections" (PDF). Retrieved 30 May 2018.
This article is issued from Wikipedia. The text is licensed under Creative Commons - Attribution - Sharealike. Additional terms may apply for the media files.