Lanark—Frontenac—Kingston
Lanark—Frontenac—Kingston is a federal electoral district in Eastern Ontario, Canada.
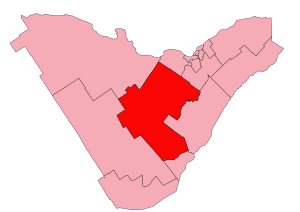 Lanark—Frontenac—Kingston in relation to other electoral districts in Eastern Ontario | |||
| Federal electoral district | |||
| Legislature | House of Commons | ||
| MP |
Conservative | ||
| District created | 2013 | ||
| First contested | 2015 | ||
| Last contested | 2019 | ||
| District webpage | profile, map | ||
| Demographics | |||
| Population (2011)[1] | 98,409 | ||
| Electors (2015) | 77,808 | ||
| Area (km²)[1] | 7,322 | ||
| Pop. density (per km²) | 13.4 | ||
| Census divisions | Frontenac, Lanark | ||
| Census subdivisions | Beckwith, Carleton Place, Drummond/North Elmsley, Kingston (part), Lanark Highlands, Mississippi Mills, Perth, Smiths Falls, South Frontenac, Tay Valley | ||
History
Lanark—Frontenac—Kingston was created by the 2012 federal electoral boundaries redistribution and was legally defined in the 2013 representation order. It came into effect upon the call of the 42nd Canadian federal election, scheduled for 19 October 2015.[2] The riding was created out of parts of Lanark—Frontenac—Lennox and Addington (79%), Carleton—Mississippi Mills (13%) and Kingston and the Islands (8%).[3]
The riding was originally intended to be named Lanark—Frontenac.[4]
Geography
The riding consists of the entirety of Lanark County (including Perth and Smiths Falls) and all of Frontenac County (including Kingston) north of Highway 401.
Members of Parliament
This riding has elected the following Members of Parliament:
| Parliament | Years | Member | Party | |
|---|---|---|---|---|
| Lanark—Frontenac—Kingston Riding created from Carleton—Mississippi Mills, Kingston and the Islands and Lanark—Frontenac—Lennox and Addington |
||||
| 42nd | 2015–2019 | Scott Reid | Conservative | |
| 43rd | 2019–present | |||
Election results

| 2019 Canadian federal election | ||||||||
|---|---|---|---|---|---|---|---|---|
| Party | Candidate | Votes | % | ±% | Expenditures | |||
| Conservative | Scott Reid | 30,077 | 48.1 | |||||
| Liberal | Kayley Kennedy | 15,441 | 24.7 | |||||
| New Democratic | Satinka Schilling | 8,835 | 14.1 | |||||
| Green | Stephen Kotze | 7,011 | 11.2 | |||||
| People's | Matthew Barton | 1,117 | 1.8 | |||||
| Total valid votes/Expense limit | 62,481 | 100.0 | ||||||
| Total rejected ballots | 434 | |||||||
| Turnout | 62,915 | 72.5 | ||||||
| Eligible voters | 86,806 | |||||||
| Source: Elections Canada[5][6] | ||||||||
| 2015 Canadian federal election | ||||||||
|---|---|---|---|---|---|---|---|---|
| Party | Candidate | Votes | % | ±% | Expenditures | |||
| Conservative | Scott Reid | 27,399 | 47.87 | -12.22 | $44,082.97 | |||
| Liberal | Phil Archambault | 19,325 | 33.76 | +17.39 | $60,112.47 | |||
| New Democratic | John Fenik | 8,073 | 14.10 | -4.01 | $26,561.89 | |||
| Green | Anita Payne | 2,025 | 3.54 | -1.34 | $4,231.95 | |||
| Libertarian | Mark Budd | 418 | 0.73 | – | $1,284.49 | |||
| Total valid votes/Expense limit | 57,240 | 100.00 | $212,950.75 | |||||
| Total rejected ballots | 222 | 0.39 | – | |||||
| Turnout | 57,462 | 72.90 | – | |||||
| Eligible voters | 78,826 | |||||||
| Conservative hold | Swing | -14.80 | ||||||
| Source: Elections Canada[7][8] | ||||||||
| 2011 federal election redistributed results[9] | |||
|---|---|---|---|
| Party | Vote | % | |
| Conservative | 30,149 | 60.08 | |
| New Democratic | 9,090 | 18.12 | |
| Liberal | 8,217 | 16.38 | |
| Green | 2,449 | 4.88 | |
| Independent | 274 | 0.55 | |
References
- Statistics Canada: 2011
- Timeline for the Redistribution of Federal Electoral Districts
- Final Report – Ontario
- http://www.parl.gc.ca/HousePublications/Publication.aspx?Language=E&Mode=1&DocId=6654879&File=4
- "List of confirmed candidates". Elections Canada. Retrieved 3 October 2019.
- "Election Night Results". Elections Canada. Retrieved October 31, 2019.
- Elections Canada – Confirmed candidates for Lanark—Frontenac—Kingston, 30 September 2015
- Elections Canada – Preliminary Election Expenses Limits for Candidates Archived 2015-08-15 at the Wayback Machine
- Pundits' Guide to Canadian Elections