List of Chinese prefecture-level cities by GDP
This is a list of direct-controlled municipalities and provincial cities (in Mainland China) by gross domestic product (GDP) in Purchasing Power Parity (PPP) terms.
Methodology
Shown here are GDP figures publicized in provincial-level Statistical Yearbooks or official statistical communiques.
All GDP figures are based on the national currency Chinese yuan (code:CN¥). For an easy comparison they are converted into US dollars according to official average annual exchange rates, purchasing power parity (PPP) according to comparison of IMF WEO figures.
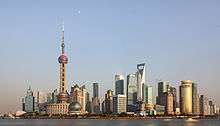
Shanghai is the biggest city by GDP in China
.jpg)
Beijing is the second biggest Chinese city in terms of GDP
_Daytime.jpg)
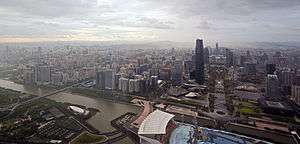
Shenzhen, in Guangdong province, is the third biggest Chinese city in GDP terms
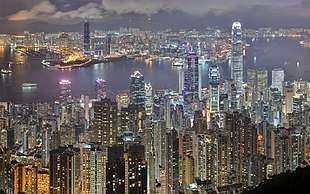
Hong Kong SAR has the fourth highest GDP of all cities in China
Guangzhou, also in Guangdong province, is the fourth largest city in China in economic terms
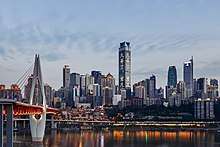
Chongqing is the fifth city with the highest GDP in China

Tianjin is the sixth richest city in China
Suzhou, in Jiangsu province is the Chinese city with the seventh highest GDP
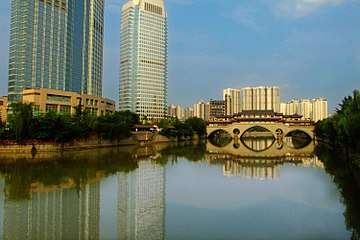
Chengdu in Sichuan province is the eighth biggest city in Mainland China in GDP
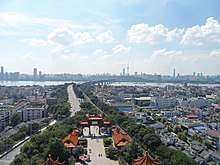
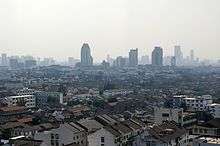
Wuhan in Hubei province is the ninth biggest city in China in terms of GDP
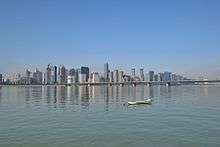
Hangzhou in Zhejiang province is the tenth biggest city in Mainland China in GDP
2017 List
| rank | cities | provinces | GDP (CNY) (millions) | GDP (USD) (millions) | GDPpc (CNY) | GDPpc (USD) |
|---|---|---|---|---|---|---|
| Shanghai[2] | Shanghai | 3,063,299 | 453,701 | 126,634 | 18,756 | |
| Beijing[2] | Beijing | 2,801,494 | 414,926 | 128,994 | 19,105 | |
| 1 | Shenzhen[3] | Guangdong | 2,417,908 | 341,679 | 311,197 | 32,091 |
| Hong Kong[4] | Hong Kong | 2,309,796 | 333,097 | 183,544 | 37,180 | |
| 2 | Guangzhou[4] | Guangdong | 2,150,315 | 318,480 | 150,678 | 22,317 |
| Chongqing[2] | Chongqing | 1,942,473 | 287,697 | 63,442 | 9,396 | |
| Tianjin[2] | Tianjin | 1,854,919 | 274,730 | 118,944 | 17,617 | |
| 3 | Suzhou[5] | Jiangsu | 1,731,951 | 256,517 | 162,388 | 24,051 |
| 4 | Chengdu[6] | Sichuan | 1,388,939 | 205,714 | 86,911 | 12,872 |
| 5 | Wuhan[7] | Hubei | 1,341,034 | 198,619 | 158,937 | 23,540 |
| 6 | Hangzhou[8] | Zhejiang | 1,260,336 | 186,667 | 135,113 | 20,011 |
| 7 | Nanjing[5] | Jiangsu | 1,171,510 | 173,511 | 141,103 | 20,899 |
| 8 | Qingdao[9] | Shandong | 1,102,411 | 163,277 | 119,215 | 17,657 |
| 9 | Wuxi[5] | Jiangsu | 1,051,180 | 155,689 | 160,706 | 23,802 |
| 10 | Changsha[10] | Hunan | 1,021,013 | 151,221 | 131,207 | 19,433 |
| 11 | Ningbo[8] | Zhejiang | 984,206 | 145,769 | 123,955 | 18,359 |
| 12 | Foshan[4] | Guangdong | 939,852 | 139,200 | 124,324 | 18,413 |
| 13 | Zhengzhou[11] | Henan | 919,377 | 136,168 | 93,792 | 13,891 |
| 14 | Nantong[5] | Jiangsu | 773,464 | 114,557 | 105,903 | 15,685 |
| 15 | Dongguan[4] | Guangdong | 758,209 | 112,297 | 91,329 | 13,527 |
| 16 | Quanzhou[12] | Fujian | 754,783 | 111,790 | 87,613 | 12,976 |
| 17 | Xi'an[13] | Shaanxi | 747,189 | 110,665 | 78,368 | 11,607 |
| 18 | Yantai[9] | Shandong | 734,353 | 108,764 | 103,771 | 15,369 |
| 19 | Jinan[9] | Shandong | 715,163 | 105,922 | 98,275 | 14,555 |
| 20 | Fuzhou[12] | Fujian | 708,552 | 104,943 | 93,047 | 13,781 |
| 21 | Hefei[14] | Anhui | 700,305 | 103,721 | 88,456 | 13,101 |
| 22 | Dalian[15] | Liaoning | 698,980 | 103,525 | 100,033 | 14,816 |
| 23 | Changzhou[5] | Jiangsu | 661,842 | 98,025 | 140,435 | 20,800 |
| 24 | Xuzhou[5] | Jiangsu | 660,595 | 97,840 | 75,611 | 11,199 |
| 25 | Tangshan[16] | Hebei | 653,010 | 96,716 | 82,971 | 12,289 |
| 26 | Changchun[17] | Jilin | 649,502 | 96,197 | 86,465 | 12,806 |
| 27 | Harbin[18] | Heilongjiang | 625,718 | 92,674 | 57,193 | 8,471 |
| 28 | Weifang[9] | Shandong | 585,493 | 86,717 | 62,553 | 9,265 |
| 29 | Shenyang[15] | Liaoning | 578,470 | 85,676 | 69,754 | 10,331 |
| 30 | Shijiazhuang[16] | Hebei | 548,600 | 81,252 | 53,799 | 7,968 |
| 31 | Wenzhou[8] | Zhejiang | 541,159 | 80,150 | 58,854 | 8,717 |
| 32 | Yancheng[5] | Jiangsu | 508,269 | 75,279 | 70,216 | 10,400 |
| 33 | Shaoxing[8] | Zhejiang | 507,837 | 75,215 | 101,588 | 15,046 |
| 34 | Yangzhou[5] | Jiangsu | 506,492 | 75,016 | 112,559 | 16,671 |
| 35 | Nanchang[19] | Jiangxi | 500,319 | 74,102 | 92,353 | 13,678 |
| 36 | Kunming[20] | Yunnan | 485,764 | 71,946 | 71,906 | 10,650 |
| 37 | Zibo[9] | Shandong | 477,136 | 70,668 | 101,569 | 15,043 |
| 38 | Taizhou, Jiangsu[5] | Jiangsu | 474,453 | 70,271 | 102,058 | 15,116 |
| 39 | Jining[9] | Shandong | 463,677 | 68,675 | 55,430 | 8,210 |
| 40 | Taizhou, Zhejiang[8] | Zhejiang | 438,822 | 64,993 | 71,950 | 10,656 |
| 41 | Jiaxing[8] | Zhejiang | 438,052 | 64,879 | 94,510 | 13,998 |
| 42 | Xiamen[12] | Fujian | 435,172 | 64,453 | 109,753 | 16,255 |
| 43 | Linyi[9] | Shandong | 433,011 | 64,133 | 41,227 | 6,106 |
| 44 | Luoyang[11] | Henan | 429,019 | 63,541 | 62,982 | 9,328 |
| 45 | Nanning[21] | Guangxi | 411,883 | 61,003 | 57,948 | 8,583 |
| 46 | Xiangyang[7] | Hubei | 406,490 | 60,205 | 68,535 | 10,151 |
| 47 | Zhenjiang[5] | Jiangsu | 401,036 | 59,397 | 125,962 | 18,656 |
| 48 | Yichang[7] | Hubei | 385,717 | 57,128 | 98,076 | 14,526 |
| 49 | Jinhua[8] | Zhejiang | 384,862 | 57,001 | 69,445 | 10,285 |
| 50 | Huizhou[4] | Guangdong | 383,058 | 56,734 | 80,205 | 11,879 |
| 51 | Dongying[9] | Shandong | 381,435 | 56,494 | 177,962 | 26,358 |
| 52 | Baotou[22] | Inner mongolia | 375,303 | 55,586 | 130,877 | 19,384 |
| 53 | Cangzhou[16] | Hebei | 364,340 | 53,962 | 48,384 | 7,166 |
| 54 | Erdos[22] | Inner mongolia | 357,981 | 53,020 | 173,609 | 25,713 |
| 55 | Tai'an[9] | Shandong | 357,839 | 52,999 | 63,433 | 9,395 |
| 56 | Guiyang[23] | Guizhou | 353,796 | 52,400 | 74,493 | 11,033 |
| 57 | Zhangzhou[12] | Fujian | 352,853 | 52,261 | 69,528 | 10,298 |
| 58 | Weihai[9] | Shandong | 351,291 | 52,029 | 124,463 | 18,434 |
| 59 | Zhongshan[4] | Guangdong | 343,031 | 50,806 | 105,711 | 15,657 |
| 60 | Taiyuan | Shanxi | 338,218 | 50,093 | 77,536 | 11,484 |
| 61 | Handan[16] | Hebei | 337,950 | 50,053 | 35,566 | 5,268 |
See also
- Economy of China
- Historical GDP of China
- List of Chinese administrative divisions by GDP
- List of Chinese administrative divisions by GDP per capita
- Top prefecture-level cities by GDP per capita
- Prefecture-level city
- List of cities in China by population
- List of cities in China
- List of twin towns and sister cities in China
- List of capitals in China
- Sub-provincial divisions in Mainland China
- List of country subdivisions by GDP over 100 billion US dollars
- List of urban agglomerations in China
- List of Renminbi exchange rates
- Sub-provincial divisions in China
- Provincial city
- Administrative divisions of China
- Global city
Notes
- ^ The annual average exchange rate of CNY to HKD: CNY 0.8713 per HKD in 2010.
- ^ The annual average exchange rate is CNY (Renminbi) 6.7695 per USD; 7.7692 Hong Kong dollar (HKD) per United States dollar in 2010. also see List of Historical Chinese yuan exchange rates.
- ^ All the GDP figures are recent statistical revisions from statistical yearbooks of provinces pubulished in later 2011.
- ^ According to IMF WEO data, the PPP is CNY 3.9460 per international currency in 2010. Hong Kong GDP PPP is from IMF WEO data (September 2011).
References
- Nominal GDP is based on the official annual average exchange rate at CN¥ 6.7518 per US dollar;
- The gdp and gdp per capita data of four direct-administered municipalities, according to China NBS national data ("China NBS national data" (Press release). National Bureau of Statistics of China. April 1, 2019. Retrieved May 8, 2019.) The average exchange rate is 6.7518 Chinese yuan per US dollar in 2017 "China Statistical Yearbook (Annual Data)" (Press release). National Bureau of Statistics of China. Retrieved May 8, 2019.
- The gdp and gdp per capita data for Hong kong and Macau SAR, according to IMF World Economic Outlook (IMF WEO) Database "Download WEO Data: April 2019 Edition" (Press release). International Monetary Fund. April 9, 2019. Retrieved May 8, 2019.
- All GDP2017 data of the cities in Guangdong is based on Guangdong Statistical Yearbook ("Guangdong Statistical Yearbook 2018" (Press release). China Statistics Press. September 1, 2018. Retrieved May 6, 2019.)
- All GDP2017 data of the cities in Jiangsu is based on Jiangsu Statistical Yearbook ("Jiangsu Statistical Yearbook 2018" (Press release). China Statistics Press. September 1, 2018. Retrieved May 6, 2019.)
- All GDP2017 data of the cities in Sichuan is based on Sichuan Statistical Yearbook ("Sichuan Statistical Yearbook 2018" (Press release). China Statistics Press. September 1, 2018. Retrieved May 6, 2019.)
- All GDP2017 data of the cities in Hubei is based on Hubei Statistical Yearbook ("Hubei Statistical Yearbook 2018" (Press release). China Statistics Press. September 1, 2018. Retrieved May 6, 2019.)
- All GDP2017 data of the cities in Zhejiang is based on Zhejiang Statistical Yearbook ("Zhejiang Statistical Yearbook 2018" (Press release). China Statistics Press. September 1, 2018. Retrieved May 6, 2019.)
- All GDP2017 data of the cities in Shandong is based on Shandong Statistical Yearbook ("Shandong Statistical Yearbook 2018" (Press release). China Statistics Press. September 1, 2018. Retrieved May 6, 2019.)
- All GDP2017 data of the cities in Hunan is based on Hunan Statistical Yearbook ("Hunan Statistical Yearbook 2018" (Press release). China Statistics Press. September 1, 2018. Archived from the original on July 31, 2010. Retrieved May 6, 2019.)
- All GDP2017 data of the cities in Henan is based on Henan Statistical Yearbook ("Henan Statistical Yearbook 2018" (Press release). China Statistics Press. September 1, 2018. Retrieved May 6, 2019.)
- All GDP2017 data of the cities in Fujian is based on Fujian Statistical Yearbook ("Fujian Statistical Yearbook 2018" (Press release). China Statistics Press. September 1, 2018. Retrieved May 6, 2019.)
- All GDP2017 data of the cities in Shaanxi is based on Shaanxi Statistical Yearbook ("Shaanxi Statistical Yearbook 2018" (Press release). China Statistics Press. September 1, 2018. Retrieved May 6, 2019.)
- All GDP2017 data of the cities in Anhui is based on Anhui Statistical Yearbook ("Anhui Statistical Yearbook 2018" (Press release). China Statistics Press. September 1, 2018. Retrieved May 6, 2019.)
- All GDP2017 data of the cities in Liaoning is based on Liaoning Statistical Yearbook ("Liaoning Statistical Yearbook 2018" (Press release). China Statistics Press. September 1, 2018. Retrieved May 6, 2019.)
- All GDP2017 data of the cities in Hebei is based on Hebei Economic Yearbook ("Hebei Economic Yearbook 2018" (Press release). China Statistics Press. September 1, 2018. Retrieved May 6, 2019.)
- All GDP2017 data of the cities in Jilin is based on Jilin Statistical Yearbook ("Jilin Statistical Yearbook 2018" (Press release). China Statistics Press. September 1, 2018. Retrieved May 6, 2019.)
- All GDP2017 data of the cities in Heilongjiang is based on Heilongjiang Statistical Yearbook ("Heilongjiang Statistical Yearbook 2018" (Press release). China Statistics Press. September 1, 2018. Retrieved May 6, 2019.)
- All GDP2017 data of the cities in Jiangxi is based on Jiangxi Statistical Yearbook ("Jiangxi Statistical Yearbook 2018" (Press release). China Statistics Press. September 1, 2018. Retrieved May 6, 2019.)
- All GDP2017 data of the cities in Yunnan is based on Yunnan Statistical Yearbook ("Yunnan Statistical Yearbook 2018" (Press release). China Statistics Press. September 1, 2018. Retrieved May 6, 2019.)
- All GDP2017 data of the cities in Guangxi is based on Guangxi Statistical Yearbook ("Guangxi Statistical Yearbook 2018" (Press release). China Statistics Press. September 1, 2018. Retrieved May 6, 2019.)
- All GDP2017 data of the cities in Inner mongolia is based on Inner Mongolia Statistical Yearbook ("Inner Mongolia Statistical Yearbook 2018" (Press release). China Statistics Press. September 1, 2018. Retrieved May 6, 2019.)
- All GDP2017 data of the cities in Guizhou is based on Guizhou Statistical Yearbook ("Guizhou Statistical Yearbook 2018" (Press release). China Statistics Press. September 1, 2018. Retrieved May 6, 2019.)
This article is issued from Wikipedia. The text is licensed under Creative Commons - Attribution - Sharealike. Additional terms may apply for the media files.