Butte County, Idaho
Butte County is a rural county located in the U.S. state of Idaho. As of the 2010 census, the population was 2,891,[1] making it the third-least populous county in Idaho. Its county seat and largest city is Arco.[2] The county was established in 1917 from parts of Bingham, Blaine, and Jefferson counties. The county gained territory in the Clyde area from Custer County in 1937 to reach its present boundary.[3]
Butte County | |
|---|---|
 | |
 Seal | |
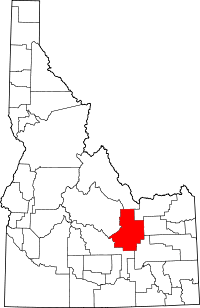 Location within the U.S. state of Idaho | |
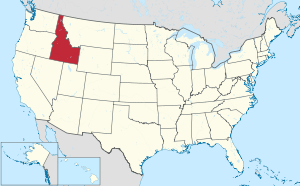 Idaho's location within the U.S. | |
| Coordinates: 43°43′N 113°10′W | |
| Country | |
| State | |
| Founded | February 6, 1917 |
| Named for | Big Southern Butte |
| Seat | Arco |
| Largest city | Arco |
| Area | |
| • Total | 2,234 sq mi (5,790 km2) |
| • Land | 2,232 sq mi (5,780 km2) |
| • Water | 2.0 sq mi (5 km2) 0.1% |
| Population (2010) | |
| • Total | 2,891 |
| • Estimate (2018) | 2,611 |
| • Density | 1.3/sq mi (0.50/km2) |
| Time zone | UTC−7 (Mountain) |
| • Summer (DST) | UTC−6 (MDT) |
| Congressional district | 2nd |
History
The first settlement in Butte County occurred about four miles (6 km) south of the present town site of Arco in 1878.[4] The settlement was then known by the names of Kennedy Crossing and Lower Crossing of the Lost River and was located in eastern Alturas County. Once the post office was established in 1879, the settlement became known as Arco.[5]
The ghost town of Era was settled in 1885.[6] Settlement of Antelope, Martin and Island (now Moore) also occurred prior to 1890. Alturas county established precincts for all five Butte County settlements existing at the 1890 census containing a combined population of 389.[7] The settlements became part of Blaine County in 1895. Blaine County created precincts for all of the settlements except Martin and added a precinct for Clyde. At the 1900 census, the five precincts totaled 714 residents increasing to 1787 in 1910.[8][9] Construction of a railroad from Blackfoot to Mackay resulted in relocation of the town of Arco to its present site in 1901.
Butte County is included in the Idaho Falls, ID Metropolitan Statistical Area. Much of the eastern part of the county is the vast Idaho National Laboratory, which extends eastward into neighboring counties.
Geography

According to the U.S. Census Bureau, the county has a total area of 2,234 square miles (5,790 km2), of which 2,232 square miles (5,780 km2) is land and 2.0 square miles (5.2 km2) (0.1%) is water.[10]
The Little Lost River is located in Butte County. Its waters, along with the Big Lost River, disappear from the surface to flow underground into the Snake River Plain aquifer in Butte County.
The county was named for the volcanic buttes that rise from the desert plain;[11] the largest is Big Southern Butte, located in the southern part of the county. It rises 2,500 feet (760 m) above the desert floor and was used as a landmark by pioneers.[12]
The southwestern portion of the county includes the visitor center at the Craters of the Moon National Monument and Preserve, which extends south & west into three other counties.
Adjacent counties
- Custer County - northwest
- Lemhi County - northwest
- Clark County - northeast
- Jefferson County - east
- Bingham County - southeast
- Blaine County - southwest
National protected areas
- Caribou-Targhee National Forest (part)
- Craters of the Moon National Monument and Preserve (part)
- Salmon-Challis National Forest (part)
Demographics
| Historical population | |||
|---|---|---|---|
| Census | Pop. | %± | |
| 1920 | 2,940 | — | |
| 1930 | 1,934 | −34.2% | |
| 1940 | 1,877 | −2.9% | |
| 1950 | 2,722 | 45.0% | |
| 1960 | 3,498 | 28.5% | |
| 1970 | 2,925 | −16.4% | |
| 1980 | 3,342 | 14.3% | |
| 1990 | 2,918 | −12.7% | |
| 2000 | 2,899 | −0.7% | |
| 2010 | 2,891 | −0.3% | |
| Est. 2018 | 2,611 | [13] | −9.7% |
| U.S. Decennial Census[14] 1790-1960[15] 1900-1990[16] 1990-2000[17] 2010-2018[1] | |||
2000 census
As of the census[18] of 2000, there were 2,899 people, 1,089 households, and 802 families living in the county. The population density was 1 people per square mile (0/km²). There were 1,290 housing units at an average density of 1 per square mile (0/km²). The racial makeup of the county was 94.65% White, 0.28% Black or African American, 0.69% Native American, 0.24% Asian, 2.38% from other races, and 1.76% from two or more races. 4.14% of the population were Hispanic or Latino of any race. 25.3% were of English, 13.4% American, 8.5% German, 6.3% Irish and 5.5% Swedish ancestry.
There were 1,089 households out of which 32.80% had children under the age of 18 living with them, 63.20% were married couples living together, 7.40% had a female householder with no husband present, and 26.30% were non-families. 23.60% of all households were made up of individuals and 10.90% had someone living alone who was 65 years of age or older. The average household size was 2.64 and the average family size was 3.14.
In the county, the population was spread out with 29.00% under the age of 18, 6.30% from 18 to 24, 24.00% from 25 to 44, 25.70% from 45 to 64, and 14.90% who were 65 years of age or older. The median age was 39 years. For every 100 females there were 101.20 males. For every 100 females age 18 and over, there were 99.30 males.
The median income for a household in the county was $30,473, and the median income for a family was $36,950. Males had a median income of $37,750 versus $20,962 for females. The per capita income for the county was $14,948. About 14.70% of families and 18.20% of the population were below the poverty line, including 27.70% of those under age 18 and 8.10% of those age 65 or over.
2010 census
As of the 2010 United States Census, there were 2,891 people, 1,129 households, and 788 families living in the county.[19] The population density was 1.3 inhabitants per square mile (0.50/km2). There were 1,354 housing units at an average density of 0.6 per square mile (0.23/km2).[20] The racial makeup of the county was 95.5% white, 0.4% American Indian, 0.2% Pacific islander, 0.2% Asian, 0.2% black or African American, 2.0% from other races, and 1.5% from two or more races. Those of Hispanic or Latino origin made up 4.1% of the population.[19] In terms of ancestry, 33.4% were English, 18.5% were German, 10.6% were American, 9.1% were Irish, 7.6% were Danish, and 7.2% were Scottish.[21]
Of the 1,129 households, 31.5% had children under the age of 18 living with them, 58.8% were married couples living together, 7.8% had a female householder with no husband present, 30.2% were non-families, and 26.4% of all households were made up of individuals. The average household size was 2.54 and the average family size was 3.10. The median age was 41.7 years.[19]
The median income for a household in the county was $39,413 and the median income for a family was $47,225. Males had a median income of $42,500 versus $26,563 for females. The per capita income for the county was $20,414. About 9.0% of families and 13.8% of the population were below the poverty line, including 17.2% of those under age 18 and 5.0% of those age 65 or over.[22]
2016
As of 2016 the largest self-reported ancestries/ethnicities in Butte County, Idaho were:
| Largest ancestries (2016) | Percent |
|---|---|
| English | 27.7% |
| "American" | 17.4% |
| German | 11.8% |
| Irish | 6.7% |
| Italian | 5.9% |
| Scottish | 4.6% |
| French | 3.6% |
| Swedish | 2.8% |
| Norwegian | 1.2% |
| Welsh | 1.3% |
Politics
Prior to 1976, Butte County only failed to back the national winner in 1944 in presidential elections between 1920 & 1972. Since 1968, the county has become a Republican Party stronghold, & especially so since 2000. No Democratic Party candidate has won a quarter of the county's votes since Bill Clinton in 1996.
| Year | Republican | Democratic | Third parties |
|---|---|---|---|
| 2016 | 74.3% 914 | 13.0% 160 | 12.7% 156 |
| 2012 | 77.8% 1,001 | 20.1% 258 | 2.1% 27 |
| 2008 | 74.9% 1,056 | 22.6% 318 | 2.6% 36 |
| 2004 | 76.6% 1,077 | 22.8% 321 | 0.6% 8 |
| 2000 | 72.2% 1,054 | 24.3% 354 | 3.6% 52 |
| 1996 | 49.7% 741 | 34.0% 507 | 16.3% 243 |
| 1992 | 40.1% 602 | 28.8% 433 | 31.1% 468 |
| 1988 | 62.3% 899 | 36.1% 521 | 1.7% 24 |
| 1984 | 73.9% 1,245 | 25.5% 429 | 0.7% 11 |
| 1980 | 72.2% 1,275 | 24.0% 424 | 3.7% 66 |
| 1976 | 51.2% 751 | 45.2% 663 | 3.7% 54 |
| 1972 | 56.5% 788 | 27.7% 387 | 15.8% 221 |
| 1968 | 51.0% 691 | 38.4% 521 | 10.6% 144 |
| 1964 | 43.4% 649 | 56.7% 848 | |
| 1960 | 40.5% 680 | 59.6% 1,001 | |
| 1956 | 53.6% 774 | 46.4% 669 | |
| 1952 | 66.0% 916 | 34.1% 473 | |
| 1948 | 48.7% 412 | 50.4% 426 | 1.0% 8 |
| 1944 | 50.8% 431 | 49.0% 416 | 0.2% 2 |
| 1940 | 48.6% 423 | 51.4% 448 | |
| 1936 | 35.9% 312 | 62.8% 546 | 1.3% 11 |
| 1932 | 40.3% 396 | 59.2% 581 | 0.5% 5 |
| 1928 | 61.9% 493 | 37.8% 301 | 0.4% 3 |
| 1924 | 46.0% 409 | 32.0% 284 | 22.1% 196 |
| 1920 | 67.2% 646 | 32.9% 316 |
References
- "State & County QuickFacts". United States Census Bureau. Retrieved June 28, 2014.
- "Find a County". National Association of Counties. Archived from the original on May 31, 2011. Retrieved June 7, 2011.
- Idaho Atlas of Historical County Boundaries. Chicago: The Newberry Library. 2010. pp. 63–64. Retrieved February 3, 2017.
- Bottolfsen, C.A. (March 15, 1962). "Silver was king in Butte County". Lewiston Morning Tribune. (Idaho). p. 1, section 2.
- Encyclopedic History of the Church of Jesus Christ of Latter-day Saints. Salt Lake City: Deseret News. 1941. pp. 27–28.
- Chenoweth, Henry. "Era". Ghosttowns.com. Retrieved 3 February 2017.
- Report on Population of the United States at the Eleventh Census: 1890. Washington: Government Printing Office. 1895. p. 99. Retrieved February 3, 2017.
- Census Reports Volume I: Twelfth Census of the United States, Taken in the Year 1900. Washington: United States Census Office. 1901. p. 111.
- Thirteenth Census of the United States taken in the Year 1910: Volume II. Government Printing Office. 1913. p. 414. Retrieved February 3, 2017.
- "US Gazetteer files: 2010, 2000, and 1990". United States Census Bureau. February 12, 2011. Retrieved April 23, 2011.
- Idaho.gov - Butte County Archived April 23, 2012, at the Wayback Machine - accessed June 10, 2009
- "Idaho for the Curious", by Cort Conley, ©1982, ISBN 0-9603566-3-0, p.200-202
- "Population and Housing Unit Estimates". Retrieved August 2, 2019.
- "U.S. Decennial Census". United States Census Bureau. Retrieved June 28, 2014.
- "Historical Census Browser". University of Virginia Library. Retrieved June 28, 2014.
- "Population of Counties by Decennial Census: 1900 to 1990". United States Census Bureau. Retrieved June 28, 2014.
- "Census 2000 PHC-T-4. Ranking Tables for Counties: 1990 and 2000" (PDF). United States Census Bureau. Retrieved June 28, 2014.
- "U.S. Census website". United States Census Bureau. Retrieved January 31, 2008.
- "DP-1 Profile of General Population and Housing Characteristics: 2010 Demographic Profile Data". United States Census Bureau. Archived from the original on February 13, 2020. Retrieved January 4, 2016.
- "Population, Housing Units, Area, and Density: 2010 - County". United States Census Bureau. Archived from the original on February 13, 2020. Retrieved January 4, 2016.
- "DP02 SELECTED SOCIAL CHARACTERISTICS IN THE UNITED STATES – 2006-2010 American Community Survey 5-Year Estimates". United States Census Bureau. Archived from the original on February 13, 2020. Retrieved January 4, 2016.
- "DP03 SELECTED ECONOMIC CHARACTERISTICS – 2006-2010 American Community Survey 5-Year Estimates". United States Census Bureau. Archived from the original on February 13, 2020. Retrieved January 4, 2016.
- Bureau, U.S. Census. "American FactFinder - Results". Factfinder.census.gov. Archived from the original on February 13, 2020. Retrieved January 2, 2018.
- Leip, David. "Dave Leip's Atlas of U.S. Presidential Elections". Uselectionatlas.org. Retrieved January 2, 2018.
External links
Places adjacent to Butte County, Idaho | ||||||||||
|---|---|---|---|---|---|---|---|---|---|---|
| ||||||||||
Municipalities and communities of Butte County, Idaho, United States | ||
|---|---|---|
| Cities | Map of Idaho highlighting Butte County | |
| Unincorporated community | ||
Boise (capital) | ||
| Topics |
|  Seal of Idaho |
| Society | ||
| Regions | ||
| Larger cities | ||
| Smaller cities | ||
| Counties |
| |
| Authority control |
|
|---|