Gem County, Idaho
Gem County is a county in the U.S. state of Idaho. As of the 2010 census, the population was 16,719.[1] The county seat and largest city is Emmett.[2]
Gem County | |
|---|---|
 Gem County Courthouse | |
 Seal | |
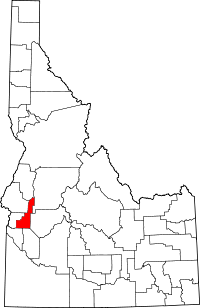 Location within the U.S. state of Idaho | |
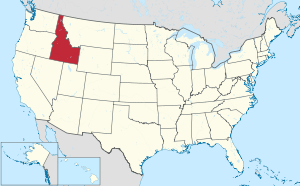 Idaho's location within the U.S. | |
| Coordinates: 44°04′N 116°25′W | |
| Country | |
| State | |
| Founded | March 15, 1915 |
| Named for | the state nickname, "Gem State". |
| Seat | Emmett |
| Largest city | Emmett |
| Area | |
| • Total | 566 sq mi (1,470 km2) |
| • Land | 561 sq mi (1,450 km2) |
| • Water | 4.8 sq mi (12 km2) 0.8% |
| Population (2010) | |
| • Total | 16,719 |
| • Estimate (2019) | 18,112 |
| • Density | 30/sq mi (11/km2) |
| Time zone | UTC−7 (Mountain) |
| • Summer (DST) | UTC−6 (MDT) |
| Congressional district | 1st |
| Website | www |
Gem County is part of the Boise, ID Metropolitan Statistical Area.
Gem County is home to the Idaho ground squirrel.
History
Named for the state nickname, "Gem State," the county was established on March 15, 1915, partitioned from Canyon County and Boise County.[3] Fur trappers were in the area as early as 1818, and Alexander Ross explored Squaw Creek in 1824. Prospectors and miners moved through the county in 1862 en route to the gold rush in the Boise Basin around Idaho City, and by the next year irrigation began along the Payette River.[4] Under Washington Territory, the area was part of Idaho County from the time of settlement until the territory south of the Payette River became part of Boise County at its creation in 1863. Picket's Corral, northeast of Emmett was the base of operations for a gang of horse thieves and "bogus dust peddlers" between 1862 and 1864.[3] The Payette Vigilance Committee eliminated the gang, bringing safety for citizens of the area. The act creating Ada County in 1864 established the Ada County boundary common to Boise County as a line from Grimes Creek to Picket's Corral and then north from that point to the existing northern boundary of Boise County, leaving the areas outside of Emmett within Boise County.[5][6] Jonathan Smith and Nathaniel Martin settled near Emmett about 1862. They established a ferry on the Payette River at Emmett in 1866. On May 31, 1867, a post office was established at the ferry and named Martinsville, which was renamed Emmettsville on October 31, 1868; postal officials shortened the name of the post office to Emmett in 1885.[7][8]
Census data for the area shows Squaw Creek Precinct under Boise County with a population of 30 in 1870.[9] Ada County did not separately return precincts at that census. By 1890, Squaw Creek was split into two precincts. Those precincts were grouped with Horseshoe Bend at the 1890 census. The Emmett precinct contained 479 residents at that time.[10] The Emmett area was transferred to Canyon County at its establishment in 1892.[11] At the 1910 Census, three Emmett area precincts contained a population of 2,601 while three Boise County precincts of Upper Squaw Creek, Lower Squaw Creek, and Pearl contained 1,069 residents.[12]
The Black Canyon Diversion Dam on the river was built in the early 1920s, east of Emmett.[13]
Geography
According to the U.S. Census Bureau, the county has a total area of 566 square miles (1,470 km2), of which 561 square miles (1,450 km2) is land and 4.8 square miles (12 km2) (0.8%) is water.[14] It is the fifth-smallest county in Idaho by area.
Adjacent counties
- Washington County - northwest
- Adams County - north
- Valley County - northeast
- Boise County - east
- Ada County - south
- Canyon County - southwest
- Payette County - west
National protected area
- Boise National Forest (part)
Demographics
| Historical population | |||
|---|---|---|---|
| Census | Pop. | %± | |
| 1920 | 6,427 | — | |
| 1930 | 7,419 | 15.4% | |
| 1940 | 9,544 | 28.6% | |
| 1950 | 8,730 | −8.5% | |
| 1960 | 9,127 | 4.5% | |
| 1970 | 9,387 | 2.8% | |
| 1980 | 11,972 | 27.5% | |
| 1990 | 11,844 | −1.1% | |
| 2000 | 15,181 | 28.2% | |
| 2010 | 16,719 | 10.1% | |
| Est. 2019 | 18,112 | [15] | 8.3% |
| U.S. Decennial Census[16] 1790-1960[17] 1900-1990[18] 1990-2000[19] 2010-2018[1] | |||
2000 census
As of the census[20] of 2000, there were 15,181 people, 5,539 households, and 4,176 families living in the county. The population density was 27 people per square mile (10/km²). There were 5,888 housing units at an average density of 10 per square mile (4/km²). The racial makeup of the county was 93.79% White, 0.73% Native American, 0.36% Asian, 0.07% Black or African American, 0.06% Pacific Islander, 3.16% from other races, and 1.83% from two or more races. 6.92% of the population were Hispanic or Latino of any race. 18.9% were of American, 17.5% German, 13.1% English and 7.2% Irish ancestry.
There were 5,539 households out of which 34.00% had children under the age of 18 living with them, 63.40% were married couples living together, 8.40% had a female householder with no husband present, and 24.60% were non-families. 20.80% of all households were made up of individuals and 9.90% had someone living alone who was 65 years of age or older. The average household size was 2.70 and the average family size was 3.12.
In the county, the population was spread out with 28.00% under the age of 18, 7.60% from 18 to 24, 25.30% from 25 to 44, 23.50% from 45 to 64, and 15.60% who were 65 years of age or older. The median age was 38 years. For every 100 females, there were 98.70 males. For every 100 females age 18 and over, there were 96.70 males.
The median income for a household in the county was $34,460, and the median income for a family was $40,195. Males had a median income of $31,036 versus $20,755 for females. The per capita income for the county was $15,340. About 11.60% of families and 13.10% of the population were below the poverty line, including 15.60% of those under age 18 and 13.90% of those age 65 or over.
2010 census
As of the 2010 United States Census, there were 16,719 people, 6,495 households, and 4,611 families living in the county.[21] The population density was 29.8 inhabitants per square mile (11.5/km2). There were 7,099 housing units at an average density of 12.7 per square mile (4.9/km2).[22] The racial makeup of the county was 93.4% white, 0.6% American Indian, 0.5% Asian, 0.1% Pacific islander, 0.1% black or African American, 3.1% from other races, and 2.2% from two or more races. Those of Hispanic or Latino origin made up 8.0% of the population.[21] In terms of ancestry, 23.2% were German, 19.2% were English, 15.8% were American, and 12.3% were Irish.[23]
Of the 6,495 households, 30.6% had children under the age of 18 living with them, 56.9% were married couples living together, 9.3% had a female householder with no husband present, 29.0% were non-families, and 24.3% of all households were made up of individuals. The average household size was 2.55 and the average family size was 3.01. The median age was 42.9 years.[21]
The median income for a household in the county was $42,794 and the median income for a family was $49,976. Males had a median income of $39,482 versus $31,083 for females. The per capita income for the county was $20,431. About 9.7% of families and 14.7% of the population were below the poverty line, including 17.3% of those under age 18 and 9.3% of those age 65 or over.[24]
2016
As of 2016 the largest self-reported ancestries/ethnicities in Gem County, Idaho were:
| Largest ancestries (2016) | Percent |
|---|---|
| English | 19.3% |
| German | 17.9% |
| Irish | 11.9% |
| "American" | 8.8% |
| Italian | 3.3% |
| Scottish | 2.4% |
| Dutch | 1.1% |
| French | 2.0% |
| Swedish | 1.7% |
| Norwegian | 1.1% |
| Swiss | 0.9% |
| Welsh | 0.8% |
Politics
Gem County is almost always Republican, The last time a Democratic presidential candidate carried the county was in 1964 by Lyndon B. Johnson.
| Year | Republican | Democratic | Third parties |
|---|---|---|---|
| 2016 | 75.2% 5,980 | 15.5% 1,229 | 9.4% 745 |
| 2012 | 70.9% 5,311 | 26.1% 1,957 | 3.0% 223 |
| 2008 | 70.3% 5,585 | 27.3% 2,166 | 2.5% 197 |
| 2004 | 75.9% 5,416 | 22.8% 1,628 | 1.3% 90 |
| 2000 | 73.1% 4,376 | 22.5% 1,346 | 4.4% 261 |
| 1996 | 54.0% 3,362 | 31.6% 1,968 | 14.5% 901 |
| 1992 | 42.9% 2,455 | 28.1% 1,609 | 29.0% 1,659 |
| 1988 | 56.9% 2,926 | 40.1% 2,064 | 3.0% 152 |
| 1984 | 68.1% 3,644 | 30.0% 1,607 | 1.9% 99 |
| 1980 | 65.8% 3,766 | 28.2% 1,613 | 6.1% 347 |
| 1976 | 52.8% 2,401 | 43.5% 1,978 | 3.8% 173 |
| 1972 | 61.3% 2,717 | 24.1% 1,069 | 14.6% 645 |
| 1968 | 57.9% 2,314 | 29.6% 1,183 | 12.5% 500 |
| 1964 | 46.0% 1,979 | 54.1% 2,328 | |
| 1960 | 55.1% 2,428 | 44.9% 1,976 | |
| 1956 | 58.8% 2,445 | 41.3% 1,717 | |
| 1952 | 62.2% 2,568 | 37.7% 1,555 | 0.1% 5 |
| 1948 | 46.3% 1,585 | 50.3% 1,724 | 3.4% 117 |
| 1944 | 41.8% 1,363 | 57.2% 1,866 | 1.1% 36 |
| 1940 | 35.4% 1,462 | 64.5% 2,666 | 0.1% 4 |
| 1936 | 24.6% 879 | 69.2% 2,468 | 6.2% 221 |
| 1932 | 27.5% 898 | 61.6% 2,007 | 10.9% 356 |
| 1928 | 71.0% 1,656 | 27.7% 646 | 1.3% 30 |
| 1924 | 41.3% 1,072 | 14.6% 380 | 44.1% 1,143 |
| 1920 | 62.7% 1,404 | 37.2% 832 | 0.1% 2 |
| 1916 | 39.5% 750 | 52.1% 990 | 8.4% 160 |
References
- "State & County QuickFacts". United States Census Bureau. Archived from the original on May 26, 2012. Retrieved June 30, 2014.
- "Find a County". National Association of Counties. Archived from the original on May 31, 2011. Retrieved 2011-06-07.
- Curtis, Lola (March 8, 1962). "Vigilantes once held Gem County". Lewiston Morning Tribune. (Idaho). p. 8.
- Idaho.gov - Gem County Archived 2005-11-26 at the Wayback Machine - accessed 2011-12-10
- "Idaho State Historical Society Reference Series: PICKET'S CORRAL" (PDF). Idaho State Historical Society. Retrieved February 17, 2017.
- Laws of the Territory of Idaho, Second Session. Boise City: Frank Kenyon, Territorial Printer. 1866. p. 430. Retrieved February 17, 2017.
- "Gem County Post Offices and Postmasters". Gem County Historical Society and Village Museum. Retrieved February 17, 2017.
- "What's in a Name?". Gem County Historical Society and Village Museum. Retrieved February 17, 2017.
- Ninth Census--Volume I (PDF). 1872: Government Printing Office. 1872. p. 107. Retrieved 17 February 2017.CS1 maint: location (link)
- Report on the Population of the United States at the Eleventh Census: 1890. Washington: Government Printing Office. 1895. p. 99.
- Idaho Atlas of Historical County Boundaries. Chicago: The Newberry Library. 2010. pp. 2, 42, 45, 66, 95–96.
- Twelfth Census of the United States Taken in the Year 1910 (PDF). Washington: Government Printing Office. 1913. pp. 414–415. Retrieved February 17, 2017.
- USBR - Black Canyon div. dam Archived June 7, 2009, at the Wayback Machine
- "US Gazetteer files: 2010, 2000, and 1990". United States Census Bureau. February 12, 2011. Retrieved April 23, 2011.
- "Population and Housing Unit Estimates". Retrieved August 6, 2019.
- "U.S. Decennial Census". United States Census Bureau. Retrieved June 30, 2014.
- "Historical Census Browser". University of Virginia Library. Retrieved June 30, 2014.
- "Population of Counties by Decennial Census: 1900 to 1990". United States Census Bureau. Retrieved June 30, 2014.
- "Census 2000 PHC-T-4. Ranking Tables for Counties: 1990 and 2000" (PDF). United States Census Bureau. Retrieved June 30, 2014.
- "U.S. Census website". United States Census Bureau. Retrieved January 31, 2008.
- "DP-1 Profile of General Population and Housing Characteristics: 2010 Demographic Profile Data". United States Census Bureau. Archived from the original on February 13, 2020. Retrieved January 9, 2016.
- "Population, Housing Units, Area, and Density: 2010 - County". United States Census Bureau. Archived from the original on February 13, 2020. Retrieved January 9, 2016.
- "DP02 SELECTED SOCIAL CHARACTERISTICS IN THE UNITED STATES – 2006-2010 American Community Survey 5-Year Estimates". United States Census Bureau. Archived from the original on February 13, 2020. Retrieved January 9, 2016.
- "DP03 SELECTED ECONOMIC CHARACTERISTICS – 2006-2010 American Community Survey 5-Year Estimates". United States Census Bureau. Archived from the original on February 13, 2020. Retrieved January 9, 2016.
- Bureau, U.S. Census. "American FactFinder - Results". Factfinder.census.gov. Archived from the original on February 13, 2020. Retrieved January 2, 2018.
- Leip, David. "Dave Leip's Atlas of U.S. Presidential Elections". Uselectionatlas.org. Retrieved January 2, 2018.
External links
- County website
- County Parcel Map
- History of Gem County
- County profile on state website
- Black Canyon Diversion Dam
Places adjacent to Gem County, Idaho | ||||||||||
|---|---|---|---|---|---|---|---|---|---|---|
| ||||||||||
Municipalities and communities of Gem County, Idaho, United States | ||
|---|---|---|
| City | Map of Idaho highlighting Gem County | |
| Unincorporated communities | ||
Boise (capital) | ||
| Topics |
|  Seal of Idaho |
| Society | ||
| Regions | ||
| Larger cities | ||
| Smaller cities | ||
| Counties |
| |
| Authority control |
|
|---|