Caribou County, Idaho
Caribou County is a county located in the U.S. state of Idaho. As of the 2010 Census the county had a population of 6,963.[1] The county seat and largest city is Soda Springs.[2]
Caribou County | |
|---|---|
 Caribou County Courthouse, Soda Springs | |
 Seal | |
 Location within the U.S. state of Idaho | |
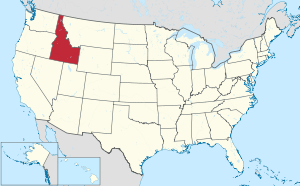 Idaho's location within the U.S. | |
| Coordinates: 42°46′N 111°33′W | |
| Country | |
| State | |
| Founded | February 11, 1919 |
| Named for | Caribou Mountains |
| Seat | Soda Springs |
| Largest city | Soda Springs |
| Area | |
| • Total | 1,799 sq mi (4,660 km2) |
| • Land | 1,764 sq mi (4,570 km2) |
| • Water | 34 sq mi (90 km2) 1.9% |
| Population (2010) | |
| • Total | 6,963 |
| • Estimate (2019) | 7,155 |
| • Density | 4/sq mi (2/km2) |
| Time zone | UTC−7 (Mountain) |
| • Summer (DST) | UTC−6 (MDT) |
| Congressional district | 2nd |
| Website | www |
History
Robert Stuart explored the area of Soda Springs in 1812. Donald Mackenzie also explored the area in 1819. The explorers were followed by trappers, missionaries, and emigrants that would travel through on the Oregon Trail. Soda Springs' namesake springs were an attraction for the trappers who met there to socialize on November 10, 1833. Missionaries and emigrant Journal entries describing the springs date back to John K. Townsend's journal entry of July 8, 1834.[3]
In May, 1863, members of the Morrisite religious sect took refuge at the junction of Soda Creek and Bear River where they formed Morristown. At the direction of General Patrick E. Conner, a fort was constructed in the Fall of 1863 for their protection. Soda Springs was established as the county seat of Oneida County when it was created January 22, 1864, serving as the county seat until 1866. The 1870 census lists a population of 144 for Soda Springs. Settlement of the present town of Soda Springs occurred in May, 1871 when Brigham Young and other Mormons purchased land at the present site of Soda Springs. Young would often recreate on his property holdings there.[4][5][6][7]
Settlement in the western portion of the county from Thatcher to Chesterfield was primarily ranching and farming operations up until 1880. Chester Call, Chesterfield's namesake arrived in 1880, bring his family in 1881. The towns of Chesterfield and Squaw Creek Station were settled in 1882. Squaw Creek Station was the initial name for Bancroft that was established when the railroad was built. It was renamed Bancroft on July 23, 1898. Settlement at the town of Grace commenced in 1893. Chesterfield declined in population while Grace and Bancroft endured.[8][9]
All of present Caribou County became a part of Bingham County when it was created on January 13, 1885.[10] The 1890 census lists four precincts of Chesterfield, Gentile Valley (now Thatcher), Little Blackfoot (now Henry), and Soda Springs with a combined population of 1.722. The Caribou precinct with 342 residents also contained residents within present-day Caribou County, but also included territory now in Bonneville county.[11]
Bannock County was established on March 6, 1893. Bancroft, Chesterfield, Chubb Springs (now Henry), Gentile Valley (now Thatcher), Salt River (now Freedom), and Soda Springs were in existence at the 1900 census with a combined population of 3,430.[12]
When the legislature formed Caribou County on February 11, 1919, Bannock County retained the Gem, Gentile Valley, and Upper Portneuf valleys. The retained area contained 4,486 residents at the 1920 Census, declining to 3,572 residents by the 1940 Census. On January 11, 1948, the residents of this area voted to become part of Caribou County.[13][14][15]
Geography
According to the U.S. Census Bureau, the county has a total area of 1,799 square miles (4,660 km2), of which 1,764 square miles (4,570 km2) is land and 34 square miles (88 km2) (1.9%) is water.[16] The county's highpoint is Meade Peak at 9,963 ft (3036.8 m) above sea level.
Adjacent counties
- Bonneville County - north
- Lincoln County, Wyoming - east
- Bear Lake County - south
- Franklin County - south
- Bannock County - west
- Bingham County - northwest
National protected areas
- Cache National Forest (part)
- Caribou National Forest (part)
- Grays Lake National Wildlife Refuge (part)
Major highways


Demographics
| Historical population | |||
|---|---|---|---|
| Census | Pop. | %± | |
| 1920 | 2,191 | — | |
| 1930 | 2,121 | −3.2% | |
| 1940 | 2,284 | 7.7% | |
| 1950 | 5,576 | 144.1% | |
| 1960 | 5,976 | 7.2% | |
| 1970 | 6,534 | 9.3% | |
| 1980 | 8,695 | 33.1% | |
| 1990 | 6,963 | −19.9% | |
| 2000 | 7,304 | 4.9% | |
| 2010 | 6,963 | −4.7% | |
| Est. 2019 | 7,155 | 2.8% | |
| U.S. Decennial Census[17] 1790-1960[18] 1900-1990[19] 1990-2000[20] 2010-2018[1] 2019[21] | |||
2000 census
As of the census[22] of 2000, there were 7,304 people, 2,560 households, and 1,978 families living in the county. The population density was 4 people per square mile (2/km²). There were 3,188 housing units at an average density of 2 per square mile (1/km²). The racial makeup of the county was 96.14% White, 0.05% Black or African American, 0.21% Native American, 0.08% Asian, 0.12% Pacific Islander, 2.20% from other races, and 1.19% from two or more races. 3.96% of the population were Hispanic or Latino of any race. 29.7% were of English, 12.2% German, 11.0% American, 8.2% Danish and 5.5% Irish ancestry.
There were 2,560 households out of which 39.60% had children under the age of 18 living with them, 69.30% were married couples living together, 5.20% had a female householder with no husband present, and 22.70% were non-families. 20.40% of all households were made up of individuals and 10.30% had someone living alone who was 65 years of age or older. The average household size was 2.83 and the average family size was 3.29.
In the county, the population was spread out with 31.70% under the age of 18, 8.20% from 18 to 24, 24.50% from 25 to 44, 22.00% from 45 to 64, and 13.60% who were 65 years of age or older. The median age was 35 years. For every 100 females there were 99.20 males. For every 100 females age 18 and over, there were 98.60 males.
The median income for a household in the county was $37,609, and the median income for a family was $42,630. Males had a median income of $38,575 versus $20,085 for females. The per capita income for the county was $15,179. About 7.00% of families and 9.60% of the population were below the poverty line, including 10.60% of those under age 18 and 9.90% of those age 65 or over.
2010 census
As of the 2010 United States Census, there were 6,963 people, 2,606 households, and 1,936 families living in the county.[23] The population density was 3.9 inhabitants per square mile (1.5/km2). There were 3,226 housing units at an average density of 1.8 per square mile (0.69/km2).[24] The racial makeup of the county was 95.3% white, 0.3% American Indian, 0.2% Pacific islander, 0.2% Asian, 0.1% black or African American, 2.3% from other races, and 1.5% from two or more races. Those of Hispanic or Latino origin made up 4.8% of the population.[23] In terms of ancestry, 27.5% were English, 17.0% were German, 7.2% were Swedish, 7.0% were Danish, 5.0% were Irish, and 4.3% were American.[25]
Of the 2,606 households, 35.0% had children under the age of 18 living with them, 64.3% were married couples living together, 6.1% had a female householder with no husband present, 25.7% were non-families, and 22.9% of all households were made up of individuals. The average household size was 2.64 and the average family size was 3.12. The median age was 37.7 years.[23]
The median income for a household in the county was $44,958 and the median income for a family was $53,615. Males had a median income of $45,904 versus $23,837 for females. The per capita income for the county was $20,637. About 4.2% of families and 8.4% of the population were below the poverty line, including 10.4% of those under age 18 and 5.0% of those age 65 or over.[26]
Politics
Like all of archconservative Mormon southeastern Idaho, Caribou County has been overwhelmingly Republican since the middle 1960s. The last Democrat to carry the county was Lyndon B. Johnson in 1964. In fact, in no presidential election subsequent to that landslide has any Democratic nominee cracked one-third of the county's vote, and Bill Clinton in 1996 was the last Democrat to gain so much as seventeen percent.
| Year | Republican | Democratic | Third parties |
|---|---|---|---|
| 2016 | 75.0% 2,275 | 8.9% 271 | 16.1% 489 |
| 2012 | 85.5% 2,608 | 12.7% 386 | 1.9% 58 |
| 2008 | 80.4% 2,656 | 16.8% 553 | 2.8% 93 |
| 2004 | 83.9% 2,753 | 15.0% 491 | 1.1% 37 |
| 2000 | 81.9% 2,601 | 15.0% 475 | 3.2% 101 |
| 1996 | 55.8% 1,740 | 27.0% 841 | 17.3% 539 |
| 1992 | 41.7% 1,350 | 17.4% 562 | 40.9% 1,324 |
| 1988 | 71.2% 2,239 | 27.6% 867 | 1.2% 38 |
| 1984 | 84.3% 3,032 | 14.9% 535 | 0.8% 30 |
| 1980 | 83.1% 3,234 | 12.4% 481 | 4.5% 177 |
| 1976 | 64.8% 2,253 | 31.9% 1,110 | 3.2% 112 |
| 1972 | 70.0% 2,069 | 20.8% 614 | 9.3% 275 |
| 1968 | 62.2% 1,731 | 26.1% 727 | 11.7% 327 |
| 1964 | 47.8% 1,303 | 52.2% 1,422 | |
| 1960 | 54.4% 1,544 | 45.6% 1,293 | |
| 1956 | 63.7% 1,668 | 36.3% 950 | |
| 1952 | 68.8% 1,788 | 31.1% 809 | 0.0% 1 |
| 1948 | 48.1% 447 | 51.1% 475 | 0.9% 8 |
| 1944 | 47.2% 462 | 52.8% 516 | |
| 1940 | 37.2% 390 | 62.7% 658 | 0.1% 1 |
| 1936 | 33.4% 321 | 66.5% 640 | 0.1% 1 |
| 1932 | 44.5% 409 | 54.2% 499 | 1.3% 12 |
| 1928 | 61.5% 471 | 38.0% 291 | 0.5% 4 |
| 1924 | 58.8% 508 | 17.1% 148 | 24.1% 208 |
| 1920 | 74.9% 541 | 25.1% 181 |
References
- "State & County QuickFacts". United States Census Bureau. Retrieved June 28, 2014.
- "Find a County". National Association of Counties. Archived from the original on May 31, 2011. Retrieved June 7, 2011.
- "Idaho State Historical Society Reference Series: Soda Springs" (PDF). Idaho State Historical Society. Idaho State Historical Society. Archived from the original (PDF) on February 9, 2017. Retrieved February 6, 2017.
- Encyclopedic History of the Church of Jesus Christ of Latter-day Saints. Salt Lake City: Deseret News. 1941. pp. 541, 806–807. Retrieved 6 February 2017.
- Laws of the Territory of Idaho, First Session: An Act Creating the County of Oneida. Lewiston: James A. Glascock, Territorial Printer. 1864. p. 625. Retrieved 6 February 2017.
- Laws of the Territory of Idaho, Third Session: An Act to Remove the County Seat of Oneida County, in Idaho Territory. Boise City: Frank Kenyon, Territorial Printer. 1866. p. 182.
- Ninth Census-Volume I: The Statistics of the Population of the United States (PDF). Washington: Government Printing Office. 1872. p. 108. Retrieved February 6, 2017.
- Encyclopedic History of the Church of Jesus Christ of Latter-day Saints. Salt Lake City: Desert News. 1941. pp. 40–41, 135, 293. Retrieved 6 February 2017.
- "BANCROFT & CHESTERFIELD". graceidaho.com. Grace Idaho Chamber of Commerce. Retrieved February 7, 2017.
- Idaho Atlas of Historical County Boundaries. Chicago: The Newberry Library. 2010. p. 27.
- Report on the Population of the United States at the Eleventh Census: 1890 (PDF). Washington: Government Printing Office. 1895. p. 99. Retrieved February 7, 2017.
- Census Reports Volume I: Twelfth Census of the United States, Taken in the Year 1900 (PDF). Washington: United States Census Office. 1901. p. 110.
- Idaho Atlas of Historical County Boundaries. Chicago: The Newberry Library. 2010. pp. 23, 69.
- Fourteenth Census of the United States, Taken in the Year 1920 (PDF). Washington: Government Printing Office. 1921. p. 389. Retrieved February 7, 2017.
- Sixteenth Census of the United States: 1940 (PDF). Government Printing Office. 1942. p. 280.
- "US Gazetteer files: 2010, 2000, and 1990". United States Census Bureau. February 12, 2011. Retrieved April 23, 2011.
- "U.S. Decennial Census". United States Census Bureau. Retrieved June 28, 2014.
- "Historical Census Browser". University of Virginia Library. Retrieved June 28, 2014.
- "Population of Counties by Decennial Census: 1900 to 1990". United States Census Bureau. Retrieved June 28, 2014.
- "Census 2000 PHC-T-4. Ranking Tables for Counties: 1990 and 2000" (PDF). United States Census Bureau. Retrieved June 28, 2014.
- "QuickFacts. Idaho counties". Retrieved May 17, 2020.
- "U.S. Census website". United States Census Bureau. Retrieved January 31, 2008.
- "DP-1 Profile of General Population and Housing Characteristics: 2010 Demographic Profile Data". United States Census Bureau. Archived from the original on February 13, 2020. Retrieved January 9, 2016.
- "Population, Housing Units, Area, and Density: 2010 - County". United States Census Bureau. Archived from the original on February 13, 2020. Retrieved January 9, 2016.
- "DP02 SELECTED SOCIAL CHARACTERISTICS IN THE UNITED STATES – 2006-2010 American Community Survey 5-Year Estimates". United States Census Bureau. Archived from the original on February 13, 2020. Retrieved January 9, 2016.
- "DP03 SELECTED ECONOMIC CHARACTERISTICS – 2006-2010 American Community Survey 5-Year Estimates". United States Census Bureau. Archived from the original on February 13, 2020. Retrieved January 9, 2016.
- Leip, David. "Dave Leip's Atlas of U.S. Presidential Elections". uselectionatlas.org. Retrieved April 4, 2018.
Places adjacent to Caribou County, Idaho | ||||||||||
|---|---|---|---|---|---|---|---|---|---|---|
| ||||||||||
Municipalities and communities of Caribou County, Idaho, United States | ||
|---|---|---|
| Cities | Map of Idaho highlighting Caribou County | |
| Unincorporated communities | ||
| Indian reservation | ||
| Ghost town | ||
| Footnotes | ‡ This populated place also extends into Wyoming, ‡‡ This populated place also has portions in an adjacent county or counties | |
Boise (capital) | ||
| Topics |
|  Seal of Idaho |
| Society | ||
| Regions | ||
| Larger cities | ||
| Smaller cities | ||
| Counties |
| |
| Authority control |
|
|---|