Washington County, Idaho
Washington County is a county in the U.S. state of Idaho. As of the 2010 census, the population was 10,198.[1] The county seat and largest city is Weiser,[2] with over half of the county's population. The county was established in 1879 when Idaho was a territory and named after U.S. President George Washington.
Washington County | |
|---|---|
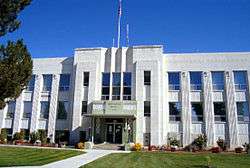 Washington County Courthouse in Weiser | |
 Seal | |
 Location within the U.S. state of Idaho | |
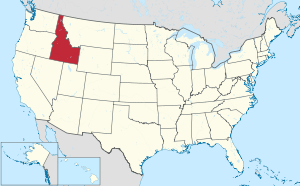 Idaho's location within the U.S. | |
| Coordinates: 44°27′N 116°47′W | |
| Country | |
| State | |
| Founded | February 20, 1879 |
| Named for | George Washington |
| Seat | Weiser |
| Largest city | Weiser |
| Area | |
| • Total | 1,474 sq mi (3,820 km2) |
| • Land | 1,453 sq mi (3,760 km2) |
| • Water | 21 sq mi (50 km2) 1.4% |
| Population (2010) | |
| • Total | 10,198 |
| • Estimate (2018) | 10,161 |
| • Density | 6.9/sq mi (2.7/km2) |
| Time zone | UTC−7 (Mountain) |
| • Summer (DST) | UTC−6 (MDT) |
| Congressional district | 1st |
| Website | www |
Washington County is home to the Idaho ground squirrel.
Geography
According to the U.S. Census Bureau, the county has a total area of 1,474 square miles (3,820 km2), of which 1,453 square miles (3,760 km2) is land and 21 square miles (54 km2) (1.4%) is water.[3]
Adjacent counties
- Adams County - north
- Gem County - east
- Payette County - south
- Malheur County, Oregon - southwest
- Baker County, Oregon - west
National protected areas
- Boise National Forest (part)
- Deer Flat National Wildlife Refuge (part)
- Payette National Forest (part)
Rivers
Reservoirs
- Brownlee
- Crane Creek
- Mann Creek
- Paddock Valley
Demographics
| Historical population | |||
|---|---|---|---|
| Census | Pop. | %± | |
| 1880 | 879 | — | |
| 1890 | 3,836 | 336.4% | |
| 1900 | 6,882 | 79.4% | |
| 1910 | 11,101 | 61.3% | |
| 1920 | 9,424 | −15.1% | |
| 1930 | 7,962 | −15.5% | |
| 1940 | 8,853 | 11.2% | |
| 1950 | 8,576 | −3.1% | |
| 1960 | 8,378 | −2.3% | |
| 1970 | 7,633 | −8.9% | |
| 1980 | 8,803 | 15.3% | |
| 1990 | 8,550 | −2.9% | |
| 2000 | 9,977 | 16.7% | |
| 2010 | 10,198 | 2.2% | |
| Est. 2018 | 10,161 | [4] | −0.4% |
| U.S. Decennial Census[5] 1790-1960[6] 1900-1990[7] 1990-2000[8] 2010-2018[1] | |||
2000 census
As of the census[9] of 2000, there were 9,977 people, 3,762 households, and 2,738 families living in the county. The population density was 7 people per square mile (3/km²). There were 4,138 housing units at an average density of 3 per square mile (1/km²). The racial makeup of the county was 87.61% White, 1.03% Asian, 0.66% Native American, 0.10% Black or African American, 0.07% Pacific Islander, 8.17% from other races, and 2.36% from two or more races. 13.75% of the population were Hispanic or Latino of any race. 15.7% were of German, 14.3% English, 10.1% American and 7.7% Irish ancestry.
There were 3,762 households out of which 32.7% had children under the age of 18 living with them, 60.7% were married couples living together, 8.2% had a female householder with no husband present, and 27.2% were non-families. 23.5% of all households were made up of individuals and 13.30% had someone living alone who was 65 years of age or older. The average household size was 2.61 and the average family size was 3.10.
In the county, the population was spread out with 27.4% under the age of 18, 7.20% from 18 to 24, 23.4% from 25 to 44, 24.3% from 45 to 64, and 17.70% who were 65 years of age or older. The median age was 39 years. For every 100 females there were 95.80 males. For every 100 females age 18 and over, there were 93.0 males.
The median income for a household in the county was $30,625, and the median income for a family was $35,542. Males had a median income of $27,222 versus $18,053 for females. The per capita income for the county was $15,464. About 10.00% of families and 13.30% of the population were below the poverty line, including 16.60% of those under age 18 and 9.90% of those age 65 or over.
2010 census
As of the 2010 United States Census, there were 10,198 people, 4,034 households, and 2,803 families living in the county.[10] The population density was 7.0 inhabitants per square mile (2.7/km2). There were 4,529 housing units at an average density of 3.1 per square mile (1.2/km2).[11] The racial makeup of the county was 86.6% white, 1.0% American Indian, 0.9% Asian, 0.2% black or African American, 9.1% from other races, and 2.2% from two or more races. Those of Hispanic or Latino origin made up 16.8% of the population.[10] In terms of ancestry, 20.0% were English, 18.2% were German, 14.8% were Irish, and 9.6% were American.[12]
Of the 4,034 households, 30.4% had children under the age of 18 living with them, 54.9% were married couples living together, 9.7% had a female householder with no husband present, 30.5% were non-families, and 25.8% of all households were made up of individuals. The average household size was 2.50 and the average family size was 2.99. The median age was 43.6 years.[10]
The median income for a household in the county was $36,542 and the median income for a family was $46,970. Males had a median income of $36,765 versus $26,406 for females. The per capita income for the county was $20,015. About 10.9% of families and 13.2% of the population were below the poverty line, including 15.6% of those under age 18 and 9.6% of those age 65 or over.[13]
Education
The county is served by three school districts:[14]
- Weiser District #431[15]
- Weiser High School
- Weiser Middle School
- Park Intermediate School
- Pioneer Primary School.
- Cambridge Joint District #432[14]
- Cambridge Junior-Senior High School
- Cambridge Elementary School
- Midvale District #433[16]
- Midvale Senior High School.
- Midvale Junior High School
- Midvale Elementary School
Politics
| Year | Republican | Democratic | Third parties |
|---|---|---|---|
| 2016 | 73.7% 3,283 | 17.4% 776 | 8.9% 396 |
| 2012 | 72.2% 3,128 | 25.5% 1,104 | 2.3% 99 |
| 2008 | 70.3% 3,168 | 27.5% 1,241 | 2.2% 97 |
| 2004 | 75.1% 3,274 | 23.7% 1,033 | 1.2% 52 |
| 2000 | 71.2% 2,899 | 24.1% 980 | 4.7% 191 |
| 1996 | 54.9% 2,318 | 31.1% 1,314 | 14.0% 590 |
| 1992 | 42.1% 1,802 | 26.2% 1,122 | 31.7% 1,357 |
| 1988 | 62.0% 2,380 | 35.4% 1,359 | 2.6% 101 |
| 1984 | 72.0% 3,015 | 26.7% 1,119 | 1.3% 54 |
| 1980 | 63.6% 2,915 | 31.0% 1,421 | 5.4% 249 |
| 1976 | 53.5% 2,044 | 44.3% 1,693 | 2.3% 86 |
| 1972 | 62.0% 2,264 | 25.6% 935 | 12.4% 453 |
| 1968 | 57.7% 2,020 | 29.5% 1,033 | 12.9% 451 |
| 1964 | 47.0% 1,730 | 53.0% 1,952 | |
| 1960 | 55.9% 2,251 | 44.1% 1,779 | |
| 1956 | 57.9% 2,272 | 42.1% 1,653 | |
| 1952 | 64.9% 2,616 | 35.0% 1,411 | 0.1% 3 |
| 1948 | 49.2% 1,713 | 48.8% 1,700 | 2.0% 68 |
| 1944 | 52.0% 2,002 | 48.0% 1,849 | 0.1% 3 |
| 1940 | 45.3% 1,903 | 54.6% 2,296 | 0.1% 5 |
| 1936 | 34.7% 1,234 | 60.4% 2,147 | 4.9% 175 |
| 1932 | 34.7% 1,213 | 60.6% 2,122 | 4.8% 166 |
| 1928 | 66.4% 1,973 | 32.8% 974 | 0.8% 25 |
| 1924 | 41.3% 1,183 | 21.8% 623 | 36.9% 1,056 |
| 1920 | 59.6% 1,864 | 40.4% 1,264 | |
| 1916 | 44.4% 1,545 | 51.8% 1,802 | 3.7% 130 |
| 1912 | 25.3% 724 | 37.3% 1,065 | 37.4% 1,070 |
| 1908 | 51.6% 1,819 | 41.2% 1,452 | 7.3% 257 |
| 1904 | 60.7% 1,894 | 29.8% 931 | 9.5% 296 |
| 1900 | 47.0% 1,194 | 53.1% 1,349 |
References
- "State & County QuickFacts". United States Census Bureau. Retrieved July 1, 2014.
- "Find a County". National Association of Counties. Retrieved June 7, 2011.
- "US Gazetteer files: 2010, 2000, and 1990". United States Census Bureau. February 12, 2011. Retrieved April 23, 2011.
- "Population and Housing Unit Estimates". Retrieved September 7, 2019.
- "U.S. Decennial Census". United States Census Bureau. Retrieved July 1, 2014.
- "Historical Census Browser". University of Virginia Library. Retrieved July 1, 2014.
- "Population of Counties by Decennial Census: 1900 to 1990". United States Census Bureau. Retrieved July 1, 2014.
- "Census 2000 PHC-T-4. Ranking Tables for Counties: 1990 and 2000" (PDF). United States Census Bureau. Retrieved July 1, 2014.
- "U.S. Census website". United States Census Bureau. Retrieved January 31, 2008.
- "DP-1 Profile of General Population and Housing Characteristics: 2010 Demographic Profile Data". United States Census Bureau. Archived from the original on February 13, 2020. Retrieved January 9, 2016.
- "Population, Housing Units, Area, and Density: 2010 - County". United States Census Bureau. Archived from the original on February 13, 2020. Retrieved January 9, 2016.
- "DP02 SELECTED SOCIAL CHARACTERISTICS IN THE UNITED STATES – 2006-2010 American Community Survey 5-Year Estimates". United States Census Bureau. Archived from the original on February 13, 2020. Retrieved January 9, 2016.
- "DP03 SELECTED ECONOMIC CHARACTERISTICS – 2006-2010 American Community Survey 5-Year Estimates". United States Census Bureau. Archived from the original on February 13, 2020. Retrieved January 9, 2016.
- Education, Idaho State Department of (April 15, 2009). "Idaho Educational Directory 2008-09" (PDF). Retrieved May 26, 2009.
- District, Weiser School (2008). "Welcome to Weiser Schools!". Retrieved May 26, 2009.
- District, Midvale School (2009). "Home". Retrieved May 26, 2009.
- Leip, David. "Dave Leip's Atlas of U.S. Presidential Elections". uselectionatlas.org. Retrieved April 4, 2018.
External links
- Official website
- County Parcel Map
- State of Idaho official site - Washington County
Places adjacent to Washington County, Idaho | ||||||||||
|---|---|---|---|---|---|---|---|---|---|---|
| ||||||||||
Municipalities and communities of Washington County, Idaho, United States | ||
|---|---|---|
| Cities | Map of Idaho highlighting Washington County | |
Boise (capital) | ||
| Topics |
| 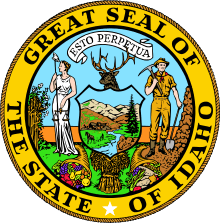 Seal of Idaho |
| Society | ||
| Regions | ||
| Larger cities | ||
| Smaller cities | ||
| Counties |
| |
| Authority control |
|
|---|