Minidoka County, Idaho
Minidoka County is a county located in the U.S. state of Idaho. As of the 2010 census, the population was 20,069.[1] The county seat and largest city is Rupert.[2]
Minidoka County | |
|---|---|
 Minidoka County Courthouse | |
 Seal | |
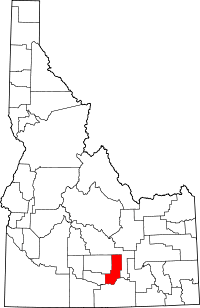 Location within the U.S. state of Idaho | |
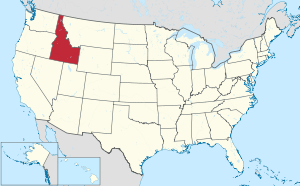 Idaho's location within the U.S. | |
| Coordinates: 42°51′N 113°38′W | |
| Country | |
| State | |
| Founded | January 28, 1913 |
| Named for | Dakota Sioux word meaning "a fountain or spring of water." |
| Seat | Rupert |
| Largest city | Rupert |
| Area | |
| • Total | 763 sq mi (1,980 km2) |
| • Land | 758 sq mi (1,960 km2) |
| • Water | 5.3 sq mi (14 km2) 0.7% |
| Population (2010) | |
| • Total | 20,069 |
| • Estimate (2018) | 20,825 |
| • Density | 26/sq mi (10/km2) |
| Time zone | UTC−7 (Mountain) |
| • Summer (DST) | UTC−6 (MDT) |
| Congressional district | 2nd |
| Website | www |
Minidoka County is part of the Burley, ID Micropolitan Statistical Area.
The name Minidoka is of Dakota Sioux origin meaning "a fountain or spring of water."[3] Minidoka was first used in 1883 as a name for the Union Pacific's Oregon Short Line, a railroad spur in the middle of the Snake River Plain. The spur later became the site of a watering station along the line. The village of Minidoka grew up next to the station. The Minidoka name was then given to a reclamation project under then President Theodore Roosevelt which included the construction of the Minidoka Dam, completed in 1904. Minidoka National Historic Site (in Jerome County) was part of the original reclamation project and hence shares the name. Minidoka County was created by the Idaho Legislature on January 28, 1913, by a partition of Lincoln County.[4]
Geography
According to the U.S. Census Bureau, the county has a total area of 763 square miles (1,980 km2), of which 758 square miles (1,960 km2) is land and 5.3 square miles (14 km2) (0.7%) is water.[5]
It is part of the Magic Valley region of the Snake River Plain. Irrigated farmland covers the southern part of the county, while lava beds cover the northern portion. The elevation is generally in the range of 4,200 feet (1,300 m) to 4,500 feet (1,400 m). The Snake River forms the county's southern boundary.
Adjacent Counties
- Cassia County - south
- Jerome County - west
- Lincoln County - west
- Blaine County - north, east
National protected area
Highways
Demographics
| Historical population | |||
|---|---|---|---|
| Census | Pop. | %± | |
| 1920 | 9,035 | — | |
| 1930 | 8,403 | −7.0% | |
| 1940 | 9,870 | 17.5% | |
| 1950 | 9,785 | −0.9% | |
| 1960 | 14,394 | 47.1% | |
| 1970 | 15,731 | 9.3% | |
| 1980 | 19,718 | 25.3% | |
| 1990 | 19,361 | −1.8% | |
| 2000 | 20,174 | 4.2% | |
| 2010 | 20,069 | −0.5% | |
| Est. 2018 | 20,825 | [6] | 3.8% |
| U.S. Decennial Census[7] 1790-1960[8] 1900-1990[9] 1990-2000[10] 2010-2018[1] | |||
2000 census
At the 2000 census there were 20,176 people, 6,973 households, and 5,362 families in the county. The population density was 27 people per square mile (10/km²). There were 7,498 housing units at an average density of 10 per square mile (4/km²). The racial makeup of the county was 78.07% White, 0.26% Black or African American, 0.88% Native American, 0.42% Asian, 0.02% Pacific Islander, 17.83% from other races, and 2.52% from two or more races. 25.46%.[11] were Hispanic or Latino of any race. 18.1% were of English, 12.9% German and 12.0% American ancestry.
Of the 6,973 households 38.90% had children under the age of 18 living with them, 64.40% were married couples living together, 8.20% had a female householder with no husband present, and 23.10% were non-families. 20.00% of households were one person and 9.60% were one person aged 65 or older. The average household size was 2.87 and the average family size was 3.32.
The age distribution was 31.60% under the age of 18, 9.10% from 18 to 24, 25.20% from 25 to 44, 20.90% from 45 to 64, and 13.20% 65 or older. The median age was 34 years. For every 100 females, there were 99.90 males. For every 100 females age 18 and over, there were 97.80 males.
The median household income was $32,021 and the median family income was $36,500. Males had a median income of $28,977 versus $19,521 for females. The per capita income for the county was $13,813. About 11.90% of families and 14.80% of the population were below the poverty line, including 18.90% of those under age 18 and 9.00% of those age 65 or over.
2010 census
At the 2010 census, there were 20,069 people, 7,170 households, and 5,315 families in the county.[12] The population density was 26.5 inhabitants per square mile (10.2/km2). There were 7,665 housing units at an average density of 10.1 per square mile (3.9/km2).[13] The racial makeup of the county was 80.2% white, 1.2% American Indian, 0.4% black or African American, 0.4% Asian, 15.3% from other races, and 2.4% from two or more races. Those of Hispanic or Latino origin made up 32.4% of the population.[12] In terms of ancestry, 19.9% were German, 16.8% were English, 10.2% were American, and 6.5% were Irish.[14]
Of the 7,170 households, 37.5% had children under the age of 18 living with them, 59.8% were married couples living together, 9.1% had a female householder with no husband present, 25.9% were non-families, and 22.0% of households were made up of individuals. The average household size was 2.79 and the average family size was 3.27. The median age was 35.3 years.[12]
The median household income was $40,350 and the median family income was $47,079. Males had a median income of $32,895 versus $22,271 for females. The per capita income for the county was $17,747. About 9.4% of families and 13.1% of the population were below the poverty line, including 20.0% of those under age 18 and 7.4% of those age 65 or over.[15]
Education
The only public high school in the county is Minico High School near Rupert.
Politics
Like all of eastern Idaho, Minidoka County has been overwhelmingly Republican since the 1950s. The last Democratic presidential candidate to carry the county was Harry S. Truman in 1948, and the last to win a majority Franklin D. Roosevelt in 1940.
| Year | Republican | Democratic | Third parties |
|---|---|---|---|
| 2016 | 71.1% 4,887 | 17.0% 1,167 | 11.9% 817 |
| 2012 | 78.0% 5,442 | 19.9% 1,390 | 2.0% 141 |
| 2008 | 73.8% 5,087 | 23.7% 1,630 | 2.5% 173 |
| 2004 | 80.5% 5,797 | 18.5% 1,331 | 1.0% 73 |
| 2000 | 75.3% 4,907 | 20.6% 1,344 | 4.1% 267 |
| 1996 | 56.8% 4,008 | 28.0% 1,977 | 15.2% 1,070 |
| 1992 | 44.6% 3,304 | 24.5% 1,815 | 31.0% 2,298 |
| 1988 | 65.7% 4,623 | 32.6% 2,290 | 1.7% 120 |
| 1984 | 80.0% 5,938 | 18.8% 1,398 | 1.1% 84 |
| 1980 | 74.2% 6,035 | 20.8% 1,689 | 5.0% 407 |
| 1976 | 56.4% 3,600 | 38.3% 2,441 | 5.3% 337 |
| 1972 | 68.7% 4,097 | 23.9% 1,423 | 7.5% 447 |
| 1968 | 56.3% 3,182 | 23.6% 1,332 | 20.2% 1,140 |
| 1964 | 52.4% 3,111 | 47.6% 2,827 | |
| 1960 | 57.7% 3,360 | 42.3% 2,467 | |
| 1956 | 63.6% 2,954 | 36.4% 1,692 | |
| 1952 | 71.4% 3,128 | 28.6% 1,253 | |
| 1948 | 48.2% 1,654 | 48.6% 1,668 | 3.2% 110 |
| 1944 | 52.0% 1,781 | 47.8% 1,635 | 0.2% 8 |
| 1940 | 49.8% 1,979 | 49.9% 1,982 | 0.3% 13 |
| 1936 | 30.6% 948 | 67.7% 2,095 | 1.7% 54 |
| 1932 | 33.6% 1,130 | 64.3% 2,164 | 2.2% 73 |
| 1928 | 61.2% 1,832 | 37.8% 1,132 | 1.1% 32 |
| 1924 | 39.9% 1,046 | 7.8% 204 | 52.3% 1,370 |
| 1920 | 59.1% 1,622 | 40.3% 1,107 | 0.6% 16 |
| 1916 | 36.2% 963 | 42.7% 1,135 | 21.1% 561 |
References
- "State & County QuickFacts". United States Census Bureau. Archived from the original on July 17, 2011. Retrieved July 1, 2014.
- "Find a County". National Association of Counties. Retrieved June 7, 2011.
- Idaho History.net reference series, page #34
- Idaho.gov - Minidoka County Archived August 3, 2009, at the Wayback Machine accessed May 29, 2009
- "US Gazetteer files: 2010, 2000, and 1990". United States Census Bureau. February 12, 2011. Retrieved April 23, 2011.
- "Population and Housing Unit Estimates". Retrieved August 6, 2019.
- "U.S. Decennial Census". United States Census Bureau. Retrieved July 1, 2014.
- "Historical Census Browser". University of Virginia Library. Retrieved July 1, 2014.
- "Population of Counties by Decennial Census: 1900 to 1990". United States Census Bureau. Retrieved July 1, 2014.
- "Census 2000 PHC-T-4. Ranking Tables for Counties: 1990 and 2000" (PDF). United States Census Bureau. Retrieved July 1, 2014.
- "U.S. Census website". United States Census Bureau. Retrieved January 31, 2008.
- "DP-1 Profile of General Population and Housing Characteristics: 2010 Demographic Profile Data". United States Census Bureau. Archived from the original on February 13, 2020. Retrieved January 9, 2016.
- "Population, Housing Units, Area, and Density: 2010 - County". United States Census Bureau. Archived from the original on February 13, 2020. Retrieved January 9, 2016.
- "DP02 SELECTED SOCIAL CHARACTERISTICS IN THE UNITED STATES – 2006-2010 American Community Survey 5-Year Estimates". United States Census Bureau. Archived from the original on February 13, 2020. Retrieved January 9, 2016.
- "DP03 SELECTED ECONOMIC CHARACTERISTICS – 2006-2010 American Community Survey 5-Year Estimates". United States Census Bureau. Archived from the original on February 13, 2020. Retrieved January 9, 2016.
- Leip, David. "Dave Leip's Atlas of U.S. Presidential Elections". uselectionatlas.org. Retrieved April 4, 2018.
External links
Places adjacent to Minidoka County, Idaho | ||||||||||
|---|---|---|---|---|---|---|---|---|---|---|
| ||||||||||
Municipalities and communities of Minidoka County, Idaho, United States | ||
|---|---|---|
| Cities | Map of Idaho highlighting Minidoka County | |
| Footnotes | ‡This populated place also has portions in an adjacent county or counties | |
Boise (capital) | ||
| Topics |
|  Seal of Idaho |
| Society | ||
| Regions | ||
| Larger cities | ||
| Smaller cities | ||
| Counties |
| |
| Authority control |
|
|---|