2004 Wicklow County Council election
An election to Wicklow County Council took place on 11 June 2004 as part of that year's Irish local elections. 24 councillors were elected from five electoral divisions by PR-STV voting for a five-year term of office.
| |||||||||||||||||||||||||||||||||
All 24 seats to Wicklow County Council | |||||||||||||||||||||||||||||||||
|---|---|---|---|---|---|---|---|---|---|---|---|---|---|---|---|---|---|---|---|---|---|---|---|---|---|---|---|---|---|---|---|---|---|
| |||||||||||||||||||||||||||||||||
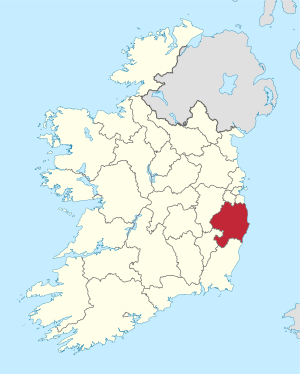 Map showing the area of Wicklow County Council | |||||||||||||||||||||||||||||||||
| |||||||||||||||||||||||||||||||||
Results by party
| Party | Seats | ± | First Pref. votes | FPv% | ±% | |
|---|---|---|---|---|---|---|
| Fine Gael | 7 | +1 | 11,695 | 21.99% | ||
| Fianna Fáil | 6 | -2 | 13,394 | 25.18% | ||
| Labour Party | 6 | +1 | 11,661 | 21.92% | ||
| Green Party | 1 | - | 2,490 | 4.68% | ||
| Independent | 4 | - | 8,535 | 16.05% | ||
| Totals | 24 | - | 53,186 | 100% | — | |
Results by Electoral Area
Arklow
| Arklow - 5 seats | |||||||||||
|---|---|---|---|---|---|---|---|---|---|---|---|
| Party | Candidate | FPv% | Count 1 | Count 2 | Count 3 | Count 4 | Count 5 | Count 6 | Count 7 | ||
| Labour Party | Nicky Kelly* | 28.00 | 3,398 | ||||||||
| Fianna Fáil | Dr. Bill O'Connell* | 12.81 | 1,555 | 1,962 | 1,977 | 2,030 | |||||
| Fine Gael | Vincent Blake* | 12.41 | 1,506 | 1,553 | 1,640 | 1,661 | 1,693 | 1,818 | 1,919 | ||
| Fianna Fáil | Pat Doran* | 11.26 | 1,367 | 1,410 | 1,459 | 1,475 | 1,516 | 1,801 | 1,839 | ||
| Labour Party | Kevin Ryan | 8.48 | 1,029 | 1,212 | 1,243 | 1,321 | 1,448 | 1,520 | 1,622 | ||
| Fine Gael | Sylvester Bourke* | 7.65 | 929 | 1,130 | 1,147 | 1,198 | 1,264 | 1,364 | 1,838 | ||
| Fianna Fáil | Liam O'Loughlin | 5.81 | 705 | 758 | 769 | 786 | 817 | ||||
| Fine Gael | Donal O'Sullivan | 5.17 | 628 | 833 | 834 | 889 | 957 | 1,022 | |||
| Sinn Féin | Adrian O'Reilly | 3.72 | 452 | 589 | 597 | 654 | |||||
| Green Party | Tess Enright | 2.64 | 321 | 414 | 432 | ||||||
| Progressive Democrats | John Deegan | 2.04 | 247 | 253 | |||||||
| Electorate: 18,837 Valid: 12,137 (64.43%) Spoilt: 222 Quota: 2,023 Turnout: 12,359 (65.61%) | |||||||||||
Baltinglass
| Baltinglass - 3 seats | ||||||||||||||
|---|---|---|---|---|---|---|---|---|---|---|---|---|---|---|
| Party | Candidate | FPv% | Count 1 | Count 2 | Count 3 | Count 4 | Count 5 | Count 6 | Count 7 | Count 8 | Count 9 | Count 10 | ||
| Independent | Tommy Cullen* | 22.91 | 1,832 | 1,856 | 1,883 | 1,893 | 1,918 | 1,948 | 2,041 | |||||
| Independent | Jim Ruttle* | 17.00 | 1,359 | 1,378 | 1,424 | 1,465 | 1,508 | 1,565 | 1,619 | 1,628 | 1,785 | 2,105 | ||
| Fine Gael | Edward Timmins* | 14.42 | 1,153 | 1,163 | 1,178 | 1,181 | 1,358 | 1,375 | 1,480 | 1,495 | 1,709 | 1,846 | ||
| Progressive Democrats | Eileen Cullen | 9.93 | 794 | 805 | 847 | 870 | 877 | 940 | 998 | 1,006 | 1,122 | 1,351 | ||
| Sinn Féin | Gerry O'Neill | 8.64 | 691 | 698 | 731 | 792 | 794 | 835 | 871 | 875 | 972 | |||
| Fianna Fáil | Ina O'Keeffe | 7.09 | 567 | 570 | 576 | 623 | 641 | 781 | 835 | 841 | ||||
| Fianna Fáil | Joe McCormac | 4.29 | 343 | 353 | 367 | 417 | 417 | |||||||
| Labour Party | Mary Lee Stapleton | 4.17 | 333 | 377 | 397 | 398 | 438 | 469 | ||||||
| Fine Gael | John Timmins | 4.00 | 320 | 322 | 326 | 327 | ||||||||
| Fianna Fáil | Mick O'Connell | 2.94 | 235 | 236 | 249 | |||||||||
| Independent | Assumpta Byrne | 2.71 | 217 | 230 | ||||||||||
| Green Party | Pat Pidgeon | 1.89 | 151 | |||||||||||
| Electorate: 12,204 Valid: 7,995 (65.51%) Spoilt: 103 Quota: 1,999 Turnout: 8,098 (66.36%) | ||||||||||||||
Bray
| Bray - 7 seats | |||||||||||||||
|---|---|---|---|---|---|---|---|---|---|---|---|---|---|---|---|
| Party | Candidate | FPv% | Count 1 | Count 2 | Count 3 | Count 4 | Count 5 | Count 6 | Count 7 | Count 8 | Count 9 | Count 10 | Count 11 | ||
| Labour Party | John Byrne* | 12.63 | 1,807 | ||||||||||||
| Green Party | Déirdre de Búrca* | 11.45 | 1,638 | 1,643 | 1,657 | 1,720 | 1,781 | 1,782 | 1,839 | ||||||
| Fianna Fáil | Joe Behan* | 11.32 | 1,620 | 1,627 | 1,634 | 1,645 | 1,677 | 1,679 | 1,693 | 1,704 | 1,939 | ||||
| Independent | Christopher Fox* | 11.14 | 1,594 | 1,601 | 1,607 | 1,642 | 1,698 | 1,699 | 1,898 | ||||||
| Fianna Fáil | Pat Vance* | 8.95 | 1,280 | 1,291 | 1,301 | 1,333 | 1,376 | 1,377 | 1,392 | 1,409 | 1,528 | 1,574 | 1,667 | ||
| Labour Party | Anne Ferris* | 8.47 | 1,212 | 1,219 | 1,236 | 1,279 | 1,313 | 1,321 | 1,392 | 1,402 | 1,452 | 1,466 | 1,735 | ||
| Sinn Féin | Marie Gavaghan | 6.91 | 988 | 990 | 997 | 1,013 | 1,023 | 1,024 | 1,035 | 1,043 | 1,058 | 1,064 | |||
| Fine Gael | John Ryan | 6.83 | 977 | 1,040 | 1,119 | 1,156 | 1,219 | 1,220 | 1,415 | 1,452 | 1,504 | 1,517 | 1,584 | ||
| Fianna Fáil | Michael Lawlor* | 6.58 | 941 | 949 | 960 | 970 | 1,007 | 1,008 | 1,037 | 1,058 | 1,183 | 1,254 | 1,341 | ||
| Fianna Fáil | David Grant | 4.37 | 625 | 630 | 633 | 641 | 665 | 666 | 674 | 679 | |||||
| Fine Gael | John Byrne | 4.05 | 580 | 598 | 630 | 634 | 653 | 654 | |||||||
| Progressive Democrats | Ruairi Hanley | 2.84 | 406 | 410 | 413 | 421 | |||||||||
| Independent | Seay Ledwidge | 1.99 | 285 | 290 | 293 | ||||||||||
| Fine Gael | Brian Kenny | 1.31 | 188 | 205 | |||||||||||
| Fine Gael | P.J. Minogue | 1.16 | 166 | ||||||||||||
| Electorate: 26,906 Valid: 14,307 (53.17%) Spoilt: 328 Quota: 1,789 Turnout: 14,635 (54.39%) | |||||||||||||||
Greystones
| Greystones - 4 seats | ||||||||||||
|---|---|---|---|---|---|---|---|---|---|---|---|---|
| Party | Candidate | FPv% | Count 1 | Count 2 | Count 3 | Count 4 | Count 5 | Count 6 | Count 7 | Count 8 | ||
| Fine Gael | George Jones* | 14.74 | 1,188 | 1,195 | 1,214 | 1,305 | 1,334 | 1,436 | 1,491 | 1,636 | ||
| Fine Gael | Derek Mitchell* | 13.42 | 1,082 | 1,095 | 1,121 | 1,211 | 1,255 | 1,308 | 1,352 | 1,425 | ||
| Labour Party | Tom Fortune | 12.19 | 983 | 1,011 | 1,057 | 1,126 | 1,244 | 1,298 | 1,552 | 1,668 | ||
| Fianna Fáil | Kathleen Kelleher | 11.13 | 897 | 906 | 932 | 944 | 962 | 1,052 | 1,110 | 1,501 | ||
| Fianna Fáil | Eleanor Roche* | 10.11 | 815 | 821 | 841 | 864 | 878 | 917 | 1,009 | |||
| Sinn Féin | David Gahan | 9.08 | 732 | 769 | 789 | 836 | 870 | 915 | ||||
| Independent | Veronica O'Reilly* | 8.32 | 671 | 679 | 703 | 733 | 791 | 945 | 1,113 | 1,235 | ||
| Independent | Chris Maloney | 6.36 | 513 | 532 | 559 | 568 | 601 | |||||
| Green Party | Francis Neary | 4.71 | 380 | 394 | 411 | 418 | ||||||
| Fine Gael | John Toner | 4.60 | 371 | 386 | 400 | |||||||
| Independent | Niall Byrne | 3.05 | 246 | 252 | ||||||||
| Independent | Charlie Keddy | 2.28 | 184 | |||||||||
| Electorate: 14,127 Valid: 8,062 (57.07%) Spoilt: 138 Quota: 1,613 Turnout: 8,200 (58.04%) | ||||||||||||
Wicklow
| Wicklow - 5 seats | |||||||||||
|---|---|---|---|---|---|---|---|---|---|---|---|
| Party | Candidate | FPv% | Count 1 | Count 2 | Count 3 | Count 4 | Count 5 | Count 6 | Count 7 | ||
| Fine Gael | Andrew Doyle* | 18.19 | 2,008 | ||||||||
| Labour Party | Jimmy O'Shaughnessy* | 15.82 | 1,746 | 1,781 | 1,809 | 1,838 | 1,896 | ||||
| Fianna Fáil | Fachtna Whittle | 11.44 | 1,262 | 1,272 | 1,301 | 1,371 | 1,412 | 1,537 | 1,731 | ||
| Fianna Fáil | Pat Doyle* | 10.71 | 1,182 | 1,203 | 1,221 | 1,256 | 1,274 | 1,321 | 1,385 | ||
| Labour Party | Conal Kavanagh* | 10.45 | 1,153 | 1,163 | 1,195 | 1,233 | 1,310 | 1,468 | 1,898 | ||
| Independent | Pat Casey | 9.19 | 1,014 | 1,047 | 1,069 | 1,136 | 1,192 | 1,322 | 1,550 | ||
| Fine Gael | Pat Byrne | 8.61 | 950 | 997 | 1,019 | 1,111 | 1,111 | 1,224 | |||
| Sinn Féin | Eamonn Long | 6.35 | 701 | 704 | 715 | 734 | 781 | ||||
| Independent | Bob Kearns | 3.77 | 416 | 419 | 438 | 449 | |||||
| Progressive Democrats | Thomas Clarke | 3.62 | 400 | 404 | 408 | ||||||
| Independent | Paul Leahy | 1.85 | 204 | 206 | |||||||
| Electorate: 19,250 Valid: 11,036 (57.33%) Spoilt: 275 Quota: 1,840 Turnout: 11,311 (58.76%) | |||||||||||
External links
| Preceded by 1999 Wicklow County Council election |
Wicklow County Council elections | Succeeded by 2009 Wicklow County Council election |
This article is issued from Wikipedia. The text is licensed under Creative Commons - Attribution - Sharealike. Additional terms may apply for the media files.