2004 Kildare County Council election
An election to Kildare County Council took place on 11 June 2004 as part of that year's Irish local elections. 25 councillors were elected from six electoral divisions by PR-STV voting for a five-year term of office.
| |||||||||||||||||||||||||||||||||||||
All 25 seats to Kildare County Council | |||||||||||||||||||||||||||||||||||||
|---|---|---|---|---|---|---|---|---|---|---|---|---|---|---|---|---|---|---|---|---|---|---|---|---|---|---|---|---|---|---|---|---|---|---|---|---|---|
| |||||||||||||||||||||||||||||||||||||
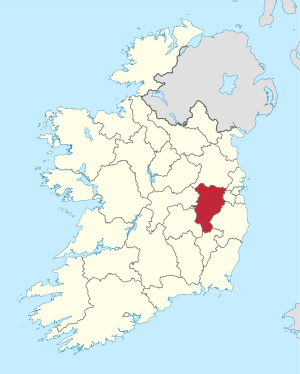 Map showing the area of Kildare County Council | |||||||||||||||||||||||||||||||||||||
| |||||||||||||||||||||||||||||||||||||
Results by party
| Party | Seats | ± | First Pref. votes | FPv% | ±% | |
|---|---|---|---|---|---|---|
| Fianna Fáil | 10 | +1 | 20,653 | 31.47 | ||
| Fine Gael | 7 | +2 | 13,767 | 20.98 | ||
| Labour Party | 4 | -1 | 12,492 | 19.04 | ||
| Green Party | 1 | +1 | 4,015 | 6.12 | ||
| Progressive Democrats | 0 | -2 | 2,493 | 3.80 | ||
| Independent | 3 | -1 | 11,719 | 17.86 | ||
| Totals | 25 | - | 65,623 | 100% | — | |
Results by Electoral Area
Athy
| Athy - 3 seats | |||||||||
|---|---|---|---|---|---|---|---|---|---|
| Party | Candidate | FPv% | Count 1 | Count 2 | Count 3 | Count 4 | Count 5 | ||
| Fianna Fáil | Martin Miley, Jnr* | 26.52 | 2,146 | ||||||
| Fianna Fáil | Mark Dalton | 16.84 | 1,363 | 1,457 | 1,521 | 1,690 | 1,973 | ||
| Fine Gael | Rainsford Hendy* | 16.37 | 1,325 | 1,359 | 1,383 | 1,441 | 1,900 | ||
| Labour Party | Adrian Kane* | 12.59 | 1,019 | 1,105 | 1,115 | 1,542 | 1,738 | ||
| Fine Gael | Richard Daly | 11.47 | 928 | 990 | 1,003 | 1,154 | |||
| Labour Party | John Lawler | 10.41 | 842 | 937 | 948 | ||||
| Green Party | Eddie Lawler | 5.80 | 469 | ||||||
| Electorate: 15,315 Valid: 8,092 (52.84%) Spoilt: 197 Quota: 2,024 Turnout: 8,289 (54.12%) | |||||||||
Celbridge
| Celbridge - 3 seats | ||||||||||
|---|---|---|---|---|---|---|---|---|---|---|
| Party | Candidate | FPv% | Count 1 | Count 2 | Count 3 | Count 4 | Count 5 | Count 6 | ||
| Labour Party | Kevin Byrne* | 33.46 | 2,436 | |||||||
| Fianna Fáil | Geraldine Conway* | 13.41 | 976 | 1,068 | 1,166 | 1,232 | 1,600 | 1,840 | ||
| Fine Gael | Katie Ridge | 12.60 | 917 | 1,031 | 1,047 | 1,262 | 1,364 | 1,658 | ||
| Progressive Democrats | John Lyons* | 10.99 | 800 | 884 | 895 | 966 | 1,105 | 1,321 | ||
| Fianna Fáil | Margaret Lynch | 9.33 | 679 | 743 | 793 | 834 | ||||
| Independent | Mairead Byrne | 8.83 | 643 | 759 | 768 | 973 | 1,082 | |||
| Green Party | Marie Percival | 4.06 | 616 | 741 | 766 | |||||
| Fianna Fáil | James O'Reilly | 2.93 | 213 | 233 | ||||||
| Electorate: 15,857 Valid: 7,280 (45.91) Spoilt: 151 Quota: 1,821 Turnout: 7,431 (46.86%) | ||||||||||
Clane
| Clane - 4 seats | |||||||||
|---|---|---|---|---|---|---|---|---|---|
| Party | Candidate | FPv% | Count 1 | Count 2 | Count 3 | Count 4 | Count 5 | ||
| Fianna Fáil | Michael Fitzpatrick* | 15.53 | 1,652 | 1,680 | 1,793 | 1,871 | 2,153 | ||
| Independent | Tony McEvoy* | 14.07 | 1,497 | 1,571 | 1,844 | 2,093 | 2,154 | ||
| Fianna Fáil | Liam Doyle | 13.49 | 1,435 | 1,483 | 1,550 | 1,741 | 1,829 | ||
| Fianna Fáil | P.J. Sheridan* | 12.97 | 1,380 | 1,398 | 1,444 | 1,526 | 1,591 | ||
| Fine Gael | Brendan Weld | 11.74 | 1,249 | 1,290 | 1,381 | 1,594 | 2,187 | ||
| Fine Gael | Jim Reilly* | 9.83 | 1,045 | 1,073 | 1,253 | 1,342 | |||
| Labour Party | Chris Rowland | 9.28 | 987 | 1,063 | 1,160 | ||||
| Independent | Heike Holstein | 8.85 | 941 | 1,026 | |||||
| Green Party | Leo Armstrong | 3.25 | 346 | ||||||
| Independent | Seanan O Coistin | 0.98 | 104 | ||||||
| Electorate: 20,905 Valid: 10,636 (50.88%) Spoilt: 200 Quota: 2,128 Turnout: 10,836 (51.83%) | |||||||||
Kildare
| Kildare - 6 seats | |||||||||||||||||
|---|---|---|---|---|---|---|---|---|---|---|---|---|---|---|---|---|---|
| Party | Candidate | FPv% | Count 1 | Count 2 | Count 3 | Count 4 | Count 5 | Count 6 | Count 7 | Count 8 | Count 9 | Count 10 | Count 11 | Count 12 | Count 13 | ||
| Fianna Fáil | Fiona O'Loughlin* | 14.88 | 2,333 | ||||||||||||||
| Fianna Fáil | Suzanne Doyle* | 10.89 | 1,708 | 1,713 | 1,726 | 1,804 | 1,825 | 1,944 | 1,977 | 2,084 | 2,138 | 2,163 | 2,214 | 2,315 | |||
| Fianna Fáil | Pat Black | 8.88 | 1,392 | 1,418 | 1,436 | 1,443 | 1,454 | 1,524 | 1,618 | 1,657 | 1,685 | 1,765 | 1,853 | 2,054 | 2,138 | ||
| Fine Gael | Fionnuala Dukes* | 6.83 | 1,071 | 1,087 | 1,093 | 1,147 | 1,343 | 1,362 | 1,397 | 1,472 | 1,523 | 1,550 | 1,788 | 1,959 | 2,243 | ||
| Independent | Matthew Lonergan | 6.81 | 1,068 | 1,082 | 1,084 | 1,090 | 1,111 | 1,114 | 1,128 | 1,159 | 1,172 | 1,277 | 1,291 | 1,322 | |||
| Fine Gael | Michael Nolan, Snr | 6.11 | 959 | 1,000 | 1,006 | 1,012 | 1,033 | 1,069 | 1,119 | 1,140 | 1,190 | 1,284 | 1,490 | 1,652 | 1,699 | ||
| Labour Party | Francis Browne | 5.85 | 917 | 921 | 922 | 989 | 1,022 | 1,034 | 1,062 | 1,120 | 1,260 | 1,288 | 1,352 | 1,412 | 1,760 | ||
| Progressive Democrats | Mick Deely* | 4.77 | 748 | 782 | 788 | 795 | 809 | 885 | 950 | 989 | 1,043 | 1,106 | 1,206 | ||||
| Fine Gael | Shane O'Dwyer | 4.73 | 742 | 759 | 763 | 769 | 783 | 810 | 847 | 871 | 959 | 985 | |||||
| Labour Party | Seamus Finn | 4.51 | 708 | 742 | 745 | 788 | 805 | 822 | 887 | 934 | 1,065 | 1,230 | 1,274 | 1,408 | 1,461 | ||
| Independent | Paddy Kennedy | 3.56 | 559 | 604 | 608 | 613 | 638 | 660 | 758 | 812 | 833 | ||||||
| Independent | Murty Aspell | 3.56 | 558 | 593 | 597 | 612 | 621 | 648 | |||||||||
| Green Party | Ger Fitzgibbon | 3.55 | 556 | 581 | 584 | 635 | 657 | 668 | 689 | ||||||||
| Labour Party | Liam Murphy | 3.48 | 546 | 554 | 555 | 621 | 629 | 698 | 718 | 764 | |||||||
| Fianna Fáil | Paddy Slattery | 3.32 | 520 | 530 | 540 | 548 | 552 | ||||||||||
| Fine Gael | Leo Conway | 3.05 | 478 | 480 | 490 | 497 | |||||||||||
| Labour Party | Mary Kavanagh | 2.93 | 459 | 463 | 464 | ||||||||||||
| Independent | Daisy Rooney | 2.31 | 362 | ||||||||||||||
| Electorate: 31,046 Valid: 15,684 (50.52%) Spoilt: 359 Quota: 2,241 Turnout: 16,043 (51.67%) | |||||||||||||||||
Leixlip
| Leixlip - 4 seats | ||||||||||
|---|---|---|---|---|---|---|---|---|---|---|
| Party | Candidate | FPv% | Count 1 | Count 2 | Count 3 | Count 4 | Count 5 | Count 6 | ||
| Independent | Catherine Murphy* | 20.58 | 2,101 | |||||||
| Labour Party | John McGinley* | 12.48 | 1,274 | 1,349 | 1,351 | 1,639 | 1,846 | 1,913 | ||
| Fianna Fáil | Paul Kelly* | 12.11 | 1,237 | 1,541 | 1,551 | 1,603 | 1,766 | 2,089 | ||
| Labour Party | Colm Purcell | 11.66 | 1,191 | 1,220 | 1,238 | 1,264 | 1,430 | 1,729 | ||
| Fine Gael | Tom Neville | 11.11 | 1,134 | 1,152 | 1,163 | 1,190 | 1,356 | |||
| Fine Gael | Senan Griffin* | 10.29 | 1,051 | 1,125 | 1,128 | 1,301 | 1,426 | 1,832 | ||
| Green Party | Shane Fitzgerald | 7.98 | 815 | 853 | 862 | 1,027 | ||||
| Independent | Paul Croghan | 7.62 | 778 | 819 | 824 | |||||
| Fianna Fáil | Brid Feely | 6.17 | 630 | |||||||
| Electorate: 20,732 Valid: 10,211 (49.25%) Spoilt: 147 Quota: 2,043 Turnout: 10,358 (49.96%) | ||||||||||
Naas
| Naas - 5 seats | |||||||||||||||
|---|---|---|---|---|---|---|---|---|---|---|---|---|---|---|---|
| Party | Candidate | FPv% | Count 1 | Count 2 | Count 3 | Count 4 | Count 5 | Count 6 | Count 7 | Count 8 | Count 9 | Count 10 | Count 11 | ||
| Labour Party | Paddy McNamara | 8.81 | 1,254 | 1,320 | 1,373 | 1,384 | 1,494 | 1,552 | 1,574 | 1,983 | 2,063 | 2,158 | 2,267 | ||
| Fine Gael | Billy Hillis* | 8.71 | 1,240 | 1,246 | 1,261 | 1,276 | 1,288 | 1,484 | 1,499 | 1,639 | 1,678 | 1,752 | 2,267 | ||
| Independent | Mary Glennon* | 8.60 | 1,225 | 1,233 | 1,266 | 1,585 | 1,690 | 1,747 | 1,818 | 1,870 | 2,029 | 2,245 | 2,432 | ||
| Green Party | J.J. Power | 8.52 | 1,213 | 1,230 | 1,346 | 1,376 | 1,434 | 1,512 | 1,557 | 1,631 | 1,802 | 1,946 | 2,087 | ||
| Fianna Fáil | Rose Barrett-O'Donoghue | 8.48 | 1,207 | 1,284 | 1,320 | 1,329 | 1,354 | 1,384 | 1,538 | 1,623 | 1,680 | 1,808 | 1,892 | ||
| Fianna Fáil | Willie Callaghan* | 7.94 | 1,130 | 1,194 | 1,219 | 1,235 | 1,252 | 1,284 | 1,603 | 1,645 | 1,829 | 1,970 | 2,156 | ||
| Progressive Democrats | Pat Clear | 6.64 | 945 | 972 | 983 | 1,002 | 1,034 | 1,098 | 1,133 | 1,165 | 1,249 | ||||
| Fine Gael | Timmy Conway* | 6.29 | 896 | 906 | 917 | 926 | 964 | 1,118 | 1,193 | 1,222 | 1,348 | 1,547 | |||
| Independent | Seamus Moore | 6.05 | 862 | 872 | 901 | 927 | 974 | 1,005 | 1,058 | 1,089 | |||||
| Labour Party | John Hubbard | 6.03 | 859 | 862 | 889 | 903 | 921 | 940 | 960 | ||||||
| Fianna Fáil | Charlie Byrne | 5.44 | 775 | 808 | 830 | 845 | 873 | 896 | |||||||
| Fine Gael | Darren Scully | 5.14 | 732 | 748 | 757 | 766 | 796 | ||||||||
| Independent | Anthony Egan | 3.65 | 520 | 527 | 554 | 578 | |||||||||
| Independent | Tom Cross | 3.52 | 501 | 525 | 538 | ||||||||||
| Sinn Féin | Cristin McCauley | 3.40 | 484 | 495 | |||||||||||
| Fianna Fáil | Carmel Kelly | 2.79 | 397 | ||||||||||||
| Electorate: 28,018 Valid: 14,240 (50.82%) Spoilt: 295 Quota: 2,374 Turnout: 14,535 (51.88%) | |||||||||||||||
External links
| Preceded by 1999 Kildare County Council election |
Kildare County Council elections | Succeeded by 2009 Kildare County Council election |
This article is issued from Wikipedia. The text is licensed under Creative Commons - Attribution - Sharealike. Additional terms may apply for the media files.