2004 Dún Laoghaire–Rathdown County Council election
An election to Dún Laoghaire–Rathdown County Council took place on 11 June 2004 as part of that year's Irish local elections. 28 councillors were elected from six electoral divisions by PR-STV voting for a five-year term of office.
| |||||||||||||||||||||||||||||||||||||
All 28 seats to Dún Laoghaire–Rathdown County Council | |||||||||||||||||||||||||||||||||||||
|---|---|---|---|---|---|---|---|---|---|---|---|---|---|---|---|---|---|---|---|---|---|---|---|---|---|---|---|---|---|---|---|---|---|---|---|---|---|
| |||||||||||||||||||||||||||||||||||||
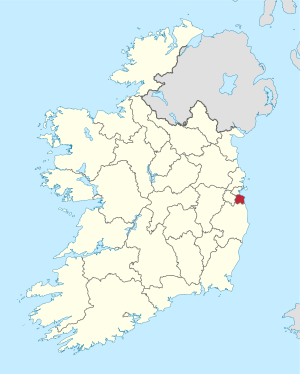 Map showing the area of Dún Laoghaire–Rathdown County Council | |||||||||||||||||||||||||||||||||||||
| |||||||||||||||||||||||||||||||||||||
Results by party
| Party | Seats | ± | First Pref. votes | FPv% | ±% | |
|---|---|---|---|---|---|---|
| Fine Gael | 9 | +1 | 19,613 | 24.06 | ||
| Fianna Fáil | 7 | -3 | 20,267 | 24.86 | ||
| Labour Party | 6 | - | 16,549 | 20.30 | ||
| Green Party | 4 | +3 | 8,432 | 10.34 | ||
| Progressive Democrats | 1 | -2 | 6,851 | 8.40 | ||
| Independent | 1 | +1 | 3,621 | 4.44 | ||
| Totals | 28 | - | 81,517 | 100% | — | |
Results by Electoral Area
Ballybrack
| Ballybrack - 6 seats | |||||||||
|---|---|---|---|---|---|---|---|---|---|
| Party | Candidate | FPv% | Count 1 | Count 2 | Count 3 | Count 4 | Count 5 | ||
| Fine Gael | Donal Marren* | 14.59 | 2,469 | ||||||
| Labour Party | Denis O'Callaghan* | 13.81 | 2,337 | 2,421 | |||||
| Fianna Fáil | Larry Butler* | 12.38 | 2,094 | 2,110 | 2,783 | ||||
| Fine Gael | Maria Bailey | 12.15 | 2,055 | 2,070 | 2,224 | 2,326 | 2,432 | ||
| Labour Party | Carrie Smyth* | 11.81 | 1,998 | 2,040 | 2,190 | 2,237 | 2,662 | ||
| Green Party | Tom Kivlehan | 8.98 | 1,519 | 1,604 | 1,657 | 1,700 | 2,085 | ||
| Progressive Democrats | Dr. Mazhar Bari | 8.33 | 1,410 | 764 | 779 | 806 | 808 | ||
| Fianna Fáil | Bernie Lowe* | 7.68 | 1,299 | 1,041 | 1,059 | 1,101 | 1,102 | ||
| Sinn Féin | Mick Nolan | 7.53 | 1,274 | 706 | 746 | 765 | 767 | ||
| Socialist Workers | Dave Lordan | 2.74 | 464 | 282 | 300 | ||||
| Electorate: 33,550 Valid: 16,919 (50.43%) Spoilt: 375 Quota: 2,418 Turnout: 17,294 (51.55%) | |||||||||
Blackrock
| Blackrock - 4 seats | ||||||||||
|---|---|---|---|---|---|---|---|---|---|---|
| Party | Candidate | FPv% | Count 1 | Count 2 | Count 3 | Count 4 | Count 5 | Count 6 | ||
| Labour Party | Niamh Bhreathnach* | 23.40 | 2,738 | |||||||
| Fine Gael | Marie Baker | 18.61 | 2,177 | 2,254 | 2,423 | |||||
| Progressive Democrats | Victor Boyhan* | 12.25 | 1,433 | 1,467 | 1,540 | 1,553 | 1,694 | 2,074 | ||
| Fianna Fáil | Barry Conway* | 11.91 | 1,393 | 1,423 | 1,456 | 1,459 | 2,124 | 2,319 | ||
| Green Party | Nessa Childers | 10.50 | 1,229 | 1,293 | 1,572 | 1,607 | 1,721 | 2,113 | ||
| Fianna Fáil | Lorcan Mooney | 9.26 | 1,083 | 1,108 | 1,138 | 1,141 | ||||
| Fine Gael | William Dockrell* | 9.06 | 1,060 | 1,091 | 1,137 | 1,165 | 1,247 | |||
| Labour Party | Angela Timlin | 5.02 | 587 | 723 | ||||||
| Electorate: 22,665 Valid: 11,700 (51.62%) Spoilt: 236 Quota: 2,341 Turnout: 11,936 (52.66%) | ||||||||||
Dundrum
| Dundrum - 6 seats | ||||||||||||||
|---|---|---|---|---|---|---|---|---|---|---|---|---|---|---|
| Party | Candidate | FPv% | Count 1 | Count 2 | Count 3 | Count 4 | Count 5 | Count 6 | Count 7 | Count 8 | Count 9 | Count 10 | ||
| Labour Party | Aidan Culhane* | 12.74 | 2,216 | 2,271 | 2,338 | 2,418 | 2,575 | |||||||
| Fianna Fáil | Tony Fox* | 12.20 | 2,121 | 2,156 | 2,258 | 2,377 | 2,598 | |||||||
| Green Party | Ciaran Fallon | 12.08 | 2,101 | 2,219 | 2,352 | 2,537 | ||||||||
| Fine Gael | Jim O'Leary | 10.64 | 1,850 | 1,942 | 1,986 | 2,015 | 2,205 | 2,216 | 2,237 | 2,241 | 2,525 | |||
| Fianna Fáil | Trevor Matthews* | 8.71 | 1,515 | 1,541 | 1,582 | 1,616 | 1,723 | 1,760 | 1,768 | 1,774 | 2,538 | |||
| Fianna Fáil | Tony Kelly* | 8.67 | 1,508 | 1,534 | 1,554 | 1,601 | 1,682 | 1,722 | 1,732 | 1,737 | ||||
| Fine Gael | Pat Hand* | 8.42 | 1,465 | 1,535 | 1,570 | 1,602 | 1,768 | 1,790 | 1,829 | 1,836 | 2,031 | 2,075 | ||
| Socialist Party | Lisa Maher | 7.40 | 1,287 | 1,311 | 1,448 | 1,757 | 1,814 | 1,817 | 1,829 | 1,859 | 1,982 | 1,991 | ||
| Progressive Democrats | Mary Fitzpatrick | 5.96 | 1,037 | 1,069 | 1,103 | 1,134 | ||||||||
| Sinn Féin | Ray O'Kelly | 5.63 | 979 | 1,003 | 1,075 | |||||||||
| Independent | Michael Langsdorf | 3.84 | 667 | 759 | ||||||||||
| Independent | Seamus O'Neill | 3.71 | 645 | |||||||||||
| Electorate: 32,053 Valid: 17,391 (54.26%) Spoilt: 413 Quota: 2,485 Turnout: 17,804 (55.55%) | ||||||||||||||
Dún Laoghaire
| Dún Laoghaire - 6 seats | ||||||||||||
|---|---|---|---|---|---|---|---|---|---|---|---|---|
| Party | Candidate | FPv% | Count 1 | Count 2 | Count 3 | Count 4 | Count 5 | Count 6 | Count 7 | Count 8 | ||
| Fine Gael | John Bailey | 12.08 | 2,189 | 2,222 | 2,268 | 2,500 | 2,603 | |||||
| Progressive Democrats | Mary Mitchell O'Connor | 11.14 | 2,018 | 2,100 | 2,142 | 2,282 | 2,360 | 2,576 | 2,771 | |||
| Fine Gael | Eugene Regan | 10.80 | 1,957 | 1,994 | 2,012 | 2,454 | 2,499 | 2,585 | 2,679 | |||
| Fianna Fáil | Cormac Devlin | 9.80 | 1,776 | 1,981 | 2,012 | 2,067 | 2,205 | 3,118 | ||||
| Green Party | Kealin Ireland* | 9.75 | 1,767 | 1,795 | 1,858 | 1,920 | 2,313 | 2,397 | 2,469 | 2,497 | ||
| Socialist Workers | Richard Boyd Barrett | 7.94 | 1,439 | 1,450 | 1,502 | 1,527 | ||||||
| Labour Party | Chris O'Malley* | 7.84 | 1,420 | 1,444 | 1,655 | 1,751 | 1,967 | 2,082 | 2,124 | 2,167 | ||
| Fianna Fáil | Brendan Kiely | 7.72 | 1,399 | 1,626 | 1,642 | 1,664 | 1,736 | |||||
| Labour Party | Jane Dillon-Byrne* | 7.43 | 1,346 | 1,364 | 1,748 | 1,816 | 2,117 | 2,207 | 2,274 | 2,288 | ||
| Fine Gael | Tom O'Higgins | 6.38 | 1,156 | 1,179 | 1,201 | |||||||
| Labour Party | Roger Cole | 4.99 | 905 | 914 | ||||||||
| Fianna Fáil | Eimear McAuliffe | 4.14 | 750 | |||||||||
| Electorate: 34,737 Valid: 18,122 (52.17%) Spoilt: 449 Quota: 2,589 Turnout: 18,571 (53.46%) | ||||||||||||
Glencullen
| Glencullen - 3 seats | |||||||||
|---|---|---|---|---|---|---|---|---|---|
| Party | Candidate | FPv% | Count 1 | Count 2 | Count 3 | Count 4 | Count 5 | ||
| Labour Party | Lettie McCarthy | 22.94 | 1,941 | 2,112 | 2,670 | ||||
| Fianna Fáil | Maria Corrigan* | 21.42 | 1,812 | 1,899 | 2,086 | 2,171 | |||
| Fianna Fáil | Tom Murphy* | 19.23 | 1,627 | 1,700 | 1,796 | 1,844 | 1,864 | ||
| Fine Gael | Tom Joyce* | 15.26 | 1,333 | 1,385 | 1,628 | 1,865 | 1,881 | ||
| Green Party | Terence Corish | 11.89 | 1,006 | 1,228 | |||||
| Sinn Féin | Joe Comerford | 8.76 | 741 | ||||||
| Electorate: 15,898 Valid: 8,460 (53.21%) Spoilt: 173 Quota: 2,116 Turnout: 8,633 (54.30%) | |||||||||
Stillorgan
| Stillorgan - 3 seats | ||||||||||
|---|---|---|---|---|---|---|---|---|---|---|
| Party | Candidate | FPv% | Count 1 | Count 2 | Count 3 | Count 4 | Count 5 | Count 6 | ||
| Independent | Gearóid O'Keeffe | 26.04 | 2,309 | |||||||
| Fianna Fáil | Gerry Horkan* | 16.74 | 1,497 | 1,730 | 1,748 | 1,831 | 1,900 | 2,262 | ||
| Labour Party | Margaret McCluskey | 8.70 | 1,061 | 1,078 | 1,093 | 1,421 | 1,523 | 1,764 | ||
| Fine Gael | Louise Cosgrave* | 17.03 | 1,039 | 1,070 | 1,084 | 1,208 | 1,800 | 2,210 | ||
| Progressive Democrats | Barry Saul* | 10.65 | 953 | 993 | 1,013 | 1,112 | 1,236 | |||
| Fine Gael | Shane Molloy | 9.65 | 863 | 887 | 898 | 942 | ||||
| Green Party | Simon Curtis | 9.06 | 810 | 824 | 838 | |||||
| Fianna Fáil | Mary White | 4.39 | 393 | |||||||
| Electorate: 15,589 Valid: 8,945 (57.38%) Spoilt: 161 Quota: 2,237 Turnout: 9,106 (58.41%) | ||||||||||
External links
| Preceded by 1999 Dún Laoghaire–Rathdown County Council election |
Dún Laoghaire–Rathdown County Council elections | Succeeded by 2009 Dún Laoghaire–Rathdown County Council election |
This article is issued from Wikipedia. The text is licensed under Creative Commons - Attribution - Sharealike. Additional terms may apply for the media files.