United States House of Representatives elections, 1994
|
| ||||||||||||||||||||||||||||||||||||||||||||||||||||||||||||||
| ||||||||||||||||||||||||||||||||||||||||||||||||||||||||||||||
All 435 seats to the United States House of Representatives 218 seats needed for a majority | ||||||||||||||||||||||||||||||||||||||||||||||||||||||||||||||
|---|---|---|---|---|---|---|---|---|---|---|---|---|---|---|---|---|---|---|---|---|---|---|---|---|---|---|---|---|---|---|---|---|---|---|---|---|---|---|---|---|---|---|---|---|---|---|---|---|---|---|---|---|---|---|---|---|---|---|---|---|---|---|
| ||||||||||||||||||||||||||||||||||||||||||||||||||||||||||||||
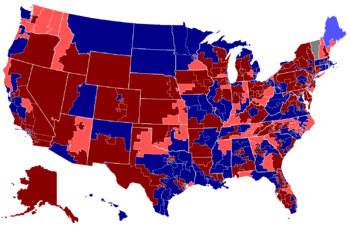 Results: Democratic gain Democratic hold Republican gain Republican hold Independent hold | ||||||||||||||||||||||||||||||||||||||||||||||||||||||||||||||
| ||||||||||||||||||||||||||||||||||||||||||||||||||||||||||||||
The 1994 United States House of Representatives election (also known as the Republican Revolution) was held on November 8, 1994, in the middle of President Bill Clinton's first term. As a result of a 54-seat swing in membership from Democrats to Republicans, the Republican Party gained a majority of seats in the United States House of Representatives for the first time since 1952 and a majority of votes for the first time since 1946. It was also the largest seat gain for the Republican Party since 1946, and the largest for either party since 1948.
The Democrats had run the House since 1954, and since 1932 there had only been 4 years when the House was under GOP control. But in 1994 the Republican Party ran against President Clinton's proposed healthcare reform.[2], benefited from impressions of corruption created by the Whitewater investigation, and picked up a majority of voters who had voted for Ross Perot in 1992. The Republicans argued that Clinton had abandoned the centrist New Democrat platform he campaigned on during the 1992 Presidential election and reverted to big government solutions. The GOP ran on Newt Gingrich's Contract with America.
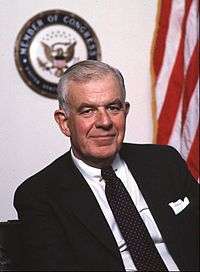
The incumbent Speaker, Democrat Tom Foley, lost re-election in his district, becoming the first Speaker of the House to lose re-election since Galusha Grow in 1862.[3] Other major upsets included the defeat of powerful long-serving Representatives such as Democratic Ways and Means Chairman Dan Rostenkowski and Democratic Judiciary Chairman Jack Brooks. In all, 34 incumbents (all Democrats) were defeated. Republicans also won the seats of retiring Democrats. Democrats won four Republican-held seats where the incumbents were stepping down. No Republican incumbent lost his or her seat in these elections.
The incumbent Republican Minority whip, Newt Gingrich, was re-elected in the Republican landslide and became Speaker as the incumbent Republican Minority Leader, Robert H. Michel, retired. The incumbent Democratic Majority Leader, Dick Gephardt, became Minority Leader. The new House leadership, under the Republicans, promised to bring a dozen legislative proposals to a vote in the first 100 days of the session, although the Senate did not always follow suit. A significant realigning election, the South underwent a drastic transformation. Before the election, House Democrats outnumbered House Republicans in the South. Afterwards, with the Republicans having picked up a total of 19 Southern seats, they were able to outnumber Democrats in the South for the first time since Reconstruction.[4] The Republicans would go on to remain the majority party of the House for the following 12 years, until the 2006 elections.
Voting patterns
GOP gains, 1992–1994
| Category | % Rep. 1992 |
% Rep. 1994 |
% shift to GOP 1992–94 |
size of group % /all |
|---|---|---|---|---|
| Southern whites | 53 | 65 | 12 | 24 |
| White men | 51 | 62 | 11 | 40 |
| White "Born Again" Christian | 66 | 76 | 10 | 20 |
| Whites 30–44 years old | 51 | 61 | 10 | 28 |
| Independents | 46 | 56 | 10 | 24 |
| White Protestants | 57 | 66 | 9 | 41 |
| Whites 60 and over | 46 | 55 | 9 | 26 |
| Whites | 50 | 58 | 8 | 79 |
| Men 30–44 years old | 49 | 57 | 8 | 17 |
| Republicans | 85 | 93 | 8 | 35 |
| Income under $15,000 | 31 | 38 | 7 | 11 |
| Conservatives | 72 | 79 | 7 | 34 |
| Men 60 and over | 44 | 51 | 7 | 12 |
| Whites 45-59 | 52 | 59 | 7 | 23 |
| Men | 48 | 54 | 6 | 49 |
| High school education | 42 | 48 | 6 | 22 |
| Some college | 47 | 53 | 6 | 32 |
| White women | 49 | 55 | 6 | 40 |
| Unmarried men | 42 | 48 | 6 | 14 |
| Country on "wrong track" | -- | 67 | 59 | |
| Disapprove of Clinton | -- | 82 | 49 | |
| 1992 Perot voters | -- | 67 | 12 |
- Source: Data from exit-poll surveys by Voter Research and Surveys and Mitofsky International published in the New York Times, November 13, 1994, p. 24.
Religious right
Evangelicals were an important group within the electorate and a significant voting block in the Republican party. The national exit poll by Mitofsky International showed 27% of all voters identified themselves as a born-again or evangelical Christians, up from 18% in 1988 and 24% in 1992. Republican House candidates outpolled Democrats among white evangelicals by a massive 52 points, 76% to 24%.[5]
According to a survey sponsored by the Christian Coalition, 33 percent of the 1994 voters were "religious conservatives," up from 24 percent in 1992 and 18 percent in 1988 (CQ Weekly Report), November 19, 1994, p. 3364; in the 1994 exit poll, 38 percent identified themselves as "conservatives," compared with 30 percent in 1992.[6]
- Party identification and ideology by selected religious groups 1994
| Party identification | Political ideology | ||||
| Religion | Democrats | Republicans | Liberal | Moderate | Conservative |
| White evangelical | 20% | 54% | 6% | 33% | 61% |
| Highly religious | 34 | 39 | 15 | 48 | 37 |
| Secular | 44 | 27 | 31 | 47 | 22 |
| Jewish | 57 | 13 | 36 | 50 | 14 |
| All voters | 41 | 35 | 18 | 47 | 35 |
- Source: Mitofsky International exit poll in Klinkner, p. 121.
Overall results
| 230 | 1 | 204 |
| Republican | I | Democratic |
| Party | Seats | Seat percentage | Vote percentage | Popular vote | ||||
|---|---|---|---|---|---|---|---|---|
| 1992 | Elected | Net Change | ||||||
| Republican Party | 176 | 230 | +54 | 52.9% | 51.9% | 36,569,698 | ||
| Democratic Party | 258 | 204 | -54 | 46.9% | 44.8% | 31,609,829 | ||
| Independent | 1 | 1 | 0 | 0.2% | 0.7% | 497,403 | ||
| Libertarian Party | 0 | 0 | 0 | 0.0% | 0.6% | 415,650 | ||
| U.S. Taxpayers' Party | 0 | 0 | 0 | 0.0% | 0.1% | 90,793 | ||
| Right to Life Party | 0 | 0 | 0 | 0.0% | 0.1% | 70,526 | ||
| Peace and Freedom Party | 0 | 0 | 0 | 0.0% | 0.1% | 63,450 | ||
| Natural Law Party | 0 | 0 | 0 | 0.0% | 0.1% | 62,556 | ||
| Conservative Party | 0 | 0 | 0 | 0.0% | 0.1% | 56,470 | ||
| Green Party | 0 | 0 | 0 | 0.0% | 0.1% | 52,096 | ||
| A Connecticut Party | 0 | 0 | 0 | 0.0% | <0.1% | 27,716 | ||
| Grassroots Party | 0 | 0 | 0 | 0.0% | <0.1% | 11,960 | ||
| Patriot Party | 0 | 0 | 0 | 0.0% | <0.1% | 11,053 | ||
| Independent American Party | 0 | 0 | 0 | 0.0% | <0.1% | 9,615 | ||
| American Party | 0 | 0 | 0 | 0.0% | <0.1% | 6,695 | ||
| Gun Control Party | 0 | 0 | 0 | 0.0% | <0.1% | 6,620 | ||
| Independence Fusion Party | 0 | 0 | 0 | 0.0% | <0.1% | 6,464 | ||
| Cash for Congress Party | 0 | 0 | 0 | 0.0% | <0.1% | 4,191 | ||
| Socialist Workers Party | 0 | 0 | 0 | 0.0% | <0.1% | 3,927 | ||
| LaRouche Was Right Party | 0 | 0 | 0 | 0.0% | <0.1% | 3,396 | ||
| Citizens with Szabo Party | 0 | 0 | 0 | 0.0% | <0.1% | 3,278 | ||
| United We Serve Party | 0 | 0 | 0 | 0.0% | <0.1% | 3,015 | ||
| Best Party | 0 | 0 | 0 | 0.0% | <0.1% | 2,815 | ||
| Concerns of People Party | 0 | 0 | 0 | 0.0% | <0.1% | 2,536 | ||
| United Independent Party | 0 | 0 | 0 | 0.0% | <0.1% | 1,918 | ||
| Workers League Party | 0 | 0 | 0 | 0.0% | <0.1% | 1,819 | ||
| Capitalist Party | 0 | 0 | 0 | 0.0% | <0.1% | 1,774 | ||
| Ax Taxes Party | 0 | 0 | 0 | 0.0% | <0.1% | 1,679 | ||
| Fed Up Party | 0 | 0 | 0 | 0.0% | <0.1% | 1,603 | ||
| Inflation Fighting Housewife Party | 0 | 0 | 0 | 0.0% | <0.1% | 1,598 | ||
| We the People Party | 0 | 0 | 0 | 0.0% | <0.1% | 1,494 | ||
| Liberty Union Party | 0 | 0 | 0 | 0.0% | <0.1% | 1,493 | ||
| Delaware Independent Party | 0 | 0 | 0 | 0.0% | <0.1% | 1,404 | ||
| Politicians Are Crooks Party | 0 | 0 | 0 | 0.0% | <0.1% | 1,319 | ||
| Democracy in Action Party | 0 | 0 | 0 | 0.0% | <0.1% | 1,122 | ||
| Perot Hispano American Party | 0 | 0 | 0 | 0.0% | <0.1% | 589 | ||
| Fascist Party | 0 | 0 | 0 | 0.0% | <0.1% | 436 | ||
| Others | 0 | 0 | 0 | 0.0% | 1.3% | 883,648 | ||
| Totals | 435 | 435 | +0 | 100.0% | 100.0% | 70,493,648 | ||
| Source: Election Statistics - Office of the Clerk | ||||||||
80+% Democratic |
80+% Republican |
60+ to 80% Democratic |
60+ to 80% Republican |
Up to 60% Democratic |
Up to 60% Republican |
80.1-100% Independent | |
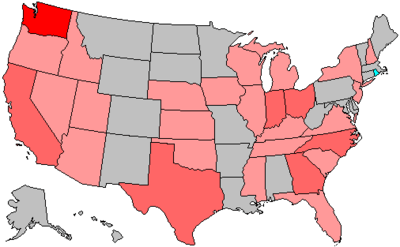
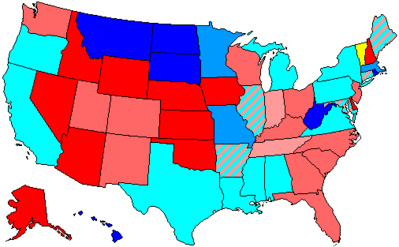
| House seats by party holding plurality in state | |
|---|---|
6+ Democratic gain |
6+ Republican gain |
3-5 Democratic gain |
3-5 Republican gain |
1-2 Democratic gain |
1-2 Republican gain |
no net change | |
Incumbents defeated
Every Republican incumbent standing won re-election. Thirty-four incumbent Democrats (including 16 "freshmen") were defeated in 1994. Democrats from Washington lost the most seats (5).
- Arizona 6: Karan English (first elected in 1992)
- California 1: Dan Hamburg (first elected in 1992)
- California 19: Richard H. Lehman (first elected in 1982)
- California 49: Lynn Schenk (first elected in 1992)
- Georgia 7: George "Buddy" Darden (first elected in 1983)
- Georgia 10: Clete Donald Johnson, Jr. (first elected in 1992)
- Idaho 1: Larry LaRocco (first elected in 1990)
- Illinois 5: Dan Rostenkowski (first elected in 1958, Ways and Means committee chairman)
- Indiana 4: Jill Long (first elected in 1989)
- Indiana 8: Frank McCloskey (first elected in 1982)
- Iowa 4: Neal Edward Smith (first elected in 1958, Appropriations subcommittee chairman)
- Kansas 4: Dan Glickman (first elected in 1976, Intelligence Committee chairman)
- Kentucky 1: Thomas Barlow (first elected in 1992)
- Nebraska 2: Peter Hoagland (first elected in 1988)
- Nevada 1: James Bilbray (first elected in 1986)
- New Hampshire 2: Dick Swett (first elected in 1990)
- New Jersey 8: Herb Klein (first elected in 1992)
- New York 1: George J. Hochbrueckner (first elected in 1986)
- North Carolina 3: Martin Lancaster (first elected in 1986)
- North Carolina 4: David Price (first elected in 1986)
- Ohio 1: David S. Mann (first elected in 1992)
- Ohio 6: Ted Strickland (first elected in 1992)
- Ohio 19: Eric Fingerhut (first elected in 1992)
- Pennsylvania 13: Marjorie Margolies-Mezvinsky (first elected in 1992)
- Texas 9: Jack Brooks (first elected in 1952, Judiciary Committee chairman, most senior member ever to have lost re-election)
- Texas 13: Bill Sarpalius (first elected in 1988)
- Utah 2: Karen Shepherd (first elected in 1992)
- Virginia 11: Leslie L. Byrne (first elected in 1992)
- Washington 1: Maria Cantwell (first elected in 1992)
- Washington 3: Jolene Unsoeld (first elected in 1988)
- Washington 4: Jay Inslee (first elected in 1992)
- Washington 5: Tom Foley (first elected in 1964, Speaker)
- Washington 9: Mike Kreidler (first elected in 1992)
- Wisconsin 1: Peter W. Barca (first elected in 1993)
Special elections
| District | Predecessor | Party | First elected | Results Sorted by election date | Candidates |
|---|---|---|---|---|---|
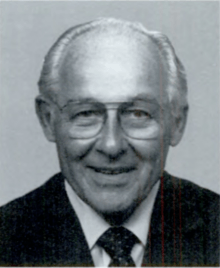
| Oklahoma 6 | Glenn English | Democratic | [Data unknown/missing.] | Incumbent resigned January 7, 1994 to become Vice President and General Manager of the National Rural Electric Cooperative Association. Winner elected May 10, 1994. Republican gain. Winner was subsequently re-elected in November. |
√ Frank Lucas (Republican) 54.2% Dan Webber (Democratic) 45.9% |
| Kentucky 2 | William H. Natcher | Democratic | [Data unknown/missing.] | Incumbent died March 29, 1994. Winner elected May 24, 1994. Republican gain. Winner was subsequently re-elected in November. |
√ Ron Lewis (Republican) 55.1% Joseph W. Prather (Democratic) 44.8% James E. Rice (Independent) 0.1% |
Alabama
| District | Incumbent | This race | |||
|---|---|---|---|---|---|
| Representative | Party | First elected |
Results | Candidates | |
| Alabama 1 | Sonny Callahan | Republican | 1984 | Incumbent re-elected. | √ Sonny Callahan (Republican) 67.3% Don Womack (Democratic) 32.7% |
| Alabama 2 | Terry Everett | Republican | 1992 | Incumbent re-elected. | √ Terry Everett (Republican) 73.6% Brian Dowling (Democratic) 26.4% |
| Alabama 3 | Glen Browder | Democratic | 1989 | Incumbent re-elected. | √ Glen Browder (Democratic) 63.6% Ben Hand (Republican) 36.4% |
| Alabama 4 | Tom Bevill | Democratic | 1966 | Incumbent re-elected. | √ Tom Bevill (Democratic) Unopposed |
| Alabama 5 | Robert E. Cramer | Democratic | 1990 | Incumbent re-elected. | √ Robert E. Cramer (Democratic) 50.5% Wayne Parker (Republican) 49.5% |
| Alabama 6 | Spencer Bachus | Republican | 1992 | Incumbent re-elected. | √ Spencer Bachus (Republican) 79.0% Larry Fortenberry (Democratic) 20.9% |
| Alabama 7 | Earl F. Hilliard | Democratic | 1992 | Incumbent re-elected. | √ Earl F. Hilliard (Democratic) 76.9% Alfred J. Middleton. Sr. (Republican) 23.0% |
Alaska
| District | Incumbent | This race | |||
|---|---|---|---|---|---|
| Representative | Party | First elected |
Results | Candidates | |
| Alaska at-large | Don Young | Republican | 1973 | Incumbent re-elected. | √ Don Young (Republican) 56.9% Tony Smith (Democratic) 32.7% Joni Whitmore (Green) 10.2% Write-In 0.2% |
Arizona
| District | Incumbent | This race | |||
|---|---|---|---|---|---|
| Representative | Party | First elected |
Results | Candidates | |
| Arizona 1 | Sam Coppersmith | Democratic | 1992 | Incumbent retired to run for U.S. Senator. New member elected. Republican gain. |
√ Matt Salmon (Republican) 56.0% Chuck Blanchard (Democratic) 39.1% Bob Howarth (Libertarian) 4.9% |
| Arizona 2 | Ed Pastor | Democratic | 1991 | Incumbent re-elected. | √ Ed Pastor (Democratic) 62.3% Robert MacDonald (Republican) 32.7% James Bertrand (Libertarian) 5.0% |
| Arizona 3 | Bob Stump | Republican | 1976 | Incumbent re-elected. | √ Bob Stump (Republican) 70.1% Howard Lee Sprague (Democratic) 29.9% |
| Arizona 4 | Jon Kyl | Republican | 1986 | Incumbent retired to run for U.S. Senator. New member elected. Republican hold. |
√ John Shadegg (Republican) 60.2% Carol Cure (Democratic) 36.0% Mark Yannone (Libertarian) 3.8% |
| Arizona 5 | Jim Kolbe | Republican | 1984 | Incumbent re-elected. | √ Jim Kolbe (Republican) 67.7% Gary Auerbach (Democratic) 28.7% Phillip W. Murphy (Libertarian) 3.5% |
| Arizona 6 | Karan English | Democratic | 1992 | Incumbent lost re-election. New member elected. Republican gain. |
√ J. D. Hayworth (Republican) 54.6% Karan English (Democratic) 41.5% Sequoia R. Fuller (Libertarian) 3.9% |
Arkansas
| District | Incumbent | This race | |||
|---|---|---|---|---|---|
| Representative | Party | First elected |
Results | Candidates | |
| Arkansas 1 | Blanche Lincoln | Democratic | 1992 | Incumbent re-elected. | √ Blanche Lincoln (Democratic) 53.4% Warren Dupwe (Republican) 46.6% |
| Arkansas 2 | Ray Thornton | Democratic | 1990 | Incumbent re-elected. | √ Ray Thornton (Democratic) 57.4% Bill Powell (Republican) 42.6% |
| Arkansas 3 | Tim Hutchinson | Republican | 1992 | Incumbent re-elected. | √ Tim Hutchinson (Republican) 67.7% Berta L. Seitz (Democratic) 32.3% |
| Arkansas 4 | Jay Dickey | Republican | 1992 | Incumbent re-elected. | √ Jay Dickey (Republican) 51.8% Jay Bradford (Democratic) 48.2% |
California
| District | Incumbent | This race | |||
|---|---|---|---|---|---|
| Representative | Party | First elected |
Results | Candidates | |
| California 1 | Dan Hamburg | Democratic | 1992 | Incumbent lost re-election. New member elected. Republican gain. |
√ Frank Riggs (Republican) 53.3% Dan Hamburg (Democratic) 46.7% |
| California 2 | Wally Herger | Republican | 1986 | Incumbent re-elected. | √ Wally Herger (Republican) 64.2% Mary Jacobs (Democratic) 26% Devvy Kidd (American Independence) 7.3% Harry H. "Doc" Pendery (Libertarian) 2.5% |
| California 3 | Vic Fazio | Democratic | 1978 | Incumbent re-elected. | √ Vic Fazio (Democratic) 49.7% Tim LeFever (Republican) 46.1% Ross Crain (Libertarian) 4.2% |
| California 4 | John Doolittle | Republican | 1990 | Incumbent re-elected. | √ John Doolittle (Republican) 61.3% Katie Hirning (Democratic) 34.9% Damon C. Falconi (Libertarian) 3.8% |
| California 5 | Bob Matsui | Democratic | 1978 | Incumbent re-elected. | √ Bob Matsui (Democratic) 68.5% Robert Dinsmore (Republican) 29% Gordon Mors (American Independence) 2.5% |
| California 6 | Lynn Woolsey | Democratic | 1992 | Incumbent re-elected. | √ Lynn Woolsey (Democratic) 58.1% Mike Nuget (Republican) 37.6% Louis Beary (Libertarian) 2.6% Ernest K. Jones, Jr. (Peace and Freedom) 1.7% |
| California 7 | George Miller | Democratic | 1974 | Incumbent re-elected. | √ George Miller (Democratic) 69.7% Charles Hughes (Republican) 27.4% William A. Callison (Peace and Freedom) 2.9% |
| California 8 | Nancy Pelosi | Democratic | 1987 | Incumbent re-elected. | √ Nancy Pelosi (Democratic) 81.8% Elsa Cheung (Republican) 18.2% |
| California 9 | Ron Dellums | Democratic | 1970 | Incumbent re-elected. | √ Ron Dellums (Democratic) 72.2% Deborah Wright (Republican) 22.6% Emma Wong Mar (Peace and Freedom) 5.1% |
| California 10 | Bill Baker | Republican | 1992 | Incumbent re-elected. | √ Bill Baker (Republican) 59.3% Ellen Schwartz (Democratic) 38.6% Craig W. Cooper (Peace and Freedom) 2.1% |
| California 11 | Richard Pombo | Republican | 1992 | Incumbent re-elected. | √ Richard Pombo (Republican) 62.1% Randy Perry (Democratic) 34.9% Joseph B. Miller (Libertarian) 3% |
| California 12 | Tom Lantos | Democratic | 1980 | Incumbent re-elected. | √ Tom Lantos (Democratic) 67.4% Deborah Wilder (Republican) 32.6% |
| California 13 | Pete Stark | Democratic | 1972 | Incumbent re-elected. | √ Pete Stark (Democratic) 64.6% Larry Molton (Republican) 30.2% Robert Gough (Libertarian) 5.1% |
| California 14 | Anna Eshoo | Democratic | 1992 | Incumbent re-elected. | √ Anna Eshoo (Democratic) 60.6% Ben Brink (Republican) 39.4% |
| California 15 | Norm Mineta | Democratic | 1974 | Incumbent re-elected. | √ Norm Mineta (Democratic) 59.9% Bob Wick (Republican) 40.1% |
| California 16 | Don Edwards | Democratic | 1962 | Incumbent retired. New member elected. Democratic hold. |
√ Zoe Lofgren (Democratic) 65% Lyle Smith (Republican) 35% |
| California 17 | Sam Farr | Democratic | 1993 | Incumbent re-elected. | √ Sam Farr (Democratic) 52.2% Bill McCampbell (Republican) 44.5% E. Craig Coffin (Green) 3.3% |
| California 18 | Gary Condit | Democratic | 1989 | Incumbent re-elected. | √ Gary Condit (Democratic) 65.5% Tom Carter (Republican) 31.7% James B. Morzella (Libertarian) 2.8% |
| California 19 | Richard H. Lehman | Democratic | 1982 | Incumbent lost re-election. New member elected. Republican gain. |
√ George Radanovich (Republican) 56.8% Richard H. Lehman (Democratic) 39.6% Dolores Comstock (Libertarian) 3.6% |
| California 20 | Cal Dooley | Democratic | 1990 | Incumbent re-elected. | √ Cal Dooley (Democratic) 56.7% Paul Young (Republican) 43.3% |
| California 21 | Bill Thomas | Republican | 1978 | Incumbent re-elected. | √ Bill Thomas (Republican) 68.1% John Evans (Democratic) 27.7% Mike Hodges (Libertarian) 4% Write-ins 0.2% |
| California 22 | Michael Huffington | Republican | 1992 | Incumbent retired to run for U.S. Senator. New member elected. Republican hold. |
√ Andrea Seastrand (Republican) 49.3% Walter Capps (Democratic) 48.5% David L. Bersohn (Libertarian) 2.2% |
| California 23 | Elton Gallegly | Republican | 1992 | Incumbent re-elected. | √ Elton Gallegly (Republican) 66.2% Kevin Ready (Democratic) 27.4% Bill Brown (Libertarian) 3.8% Robert Marston (Green) 2.6% |
| California 24 | Anthony C. Beilenson | Democratic | 1976 | Incumbent re-elected. | √ Anthony C. Beilenson (Democratic) 49.4% Rich Sybert (Republican) 47.5% John C. Koelher (Libertarian) 3.1% |
| California 25 | Howard McKeon | Republican | 1992 | Incumbent re-elected. | √ Howard McKeon (Republican) 64.9% James Gilmartin (Democratic) 31.4% Devin Cutler (Libertarian) 3.7% |
| California 26 | Howard Berman | Democratic | 1982 | Incumbent re-elected. | √ Howard Berman (Democratic) 62.6% Gary E. Forsch (Republican) 32.2% Erich D. Miller (Libertarian) 5.2% |
| California 27 | Carlos Moorhead | Republican | 1972 | Incumbent re-elected. | √ Carlos Moorhead (Republican) 53% Doug Kahn (Democratic) 42.1% Bill Gibbs (American Independence) 2.6% Dennis Decherd (Libertarian) 2.3% |
| California 28 | David Dreier | Republican | 1980 | Incumbent re-elected. | √ David Dreier (Republican) 67.1% Tommy Randle (Democratic) 30.4% Jorj Clayton Baker (Libertarian) 2.5% |
| California 29 | Henry Waxman | Democratic | 1974 | Incumbent re-elected. | √ Henry Waxman (Democratic) 68% Paul Stepanek (Republican) 28.3% Michael J. Binkley (Libertarian) 3.8% |
| California 30 | Xavier Becerra | Democratic | 1992 | Incumbent re-elected. | √ Xavier Becerra (Democratic) 66.2% David Ramirez (Republican) 28.2% R. William Weilberg (Libertarian) 5.6% |
| California 31 | Matthew G. Martinez | Democratic | 1982 | Incumbent re-elected. | √ Matthew G. Martinez (Democratic) 59.1% John Flores (Republican) 40.9% |
| California 32 | Julian C. Dixon | Democratic | 1978 | Incumbent re-elected. | √ Julian C. Dixon (Democratic) 77.6% Ernie Farhat (Republican) 17.6% John Honingsfeld (Peace and Freedom) 4.8% |
| California 33 | Lucille Roybal-Allard | Democratic | 1992 | Incumbent re-elected. | √ Lucille Roybal-Allard (Democratic) 81.5% Kermit Booker (Peace & Freedom) 18.5% |
| California 34 | Esteban Edward Torres | Democratic | 1982 | Incumbent re-elected. | √ Esteban Edward Torres (Democratic) 61.7% Albert Nunez (Republican) 34.1% Carl M. "Marty" Swinney (Libertarian) 4.2% |
| California 35 | Maxine Waters | Democratic | 1990 | Incumbent re-elected. | √ Maxine Waters (Democratic) 78.1% Nate Truman (Republican) 21.9% |
| California 36 | Jane Harman | Democratic | 1992 | Incumbent re-elected. | √ Jane Harman (Democratic) 48.0% Susan Brooks (Republican) 47.6% Jack Tyler (Libertarian) 2.5% Joseph G. "Joe" Fields (American Independence) 1.9% |
| California 37 | Walter R. Tucker III | Democratic | 1992 | Incumbent re-elected. | √ Walter R. Tucker III (Democratic) 77.4% Guy Wilson (Republican) 22.3% Write-in 0.3% |
| California 38 | Steve Horn | Republican | 1992 | Incumbent re-elected. | √ Steve Horn (Republican) 58.5% Peter Mathews (Democratic) 36.8% Lester W. Mueller (Libertarian) 2.6% Richard K. Green (Peace and Freedom) 2.1% |
| California 39 | Ed Royce | Republican | 1992 | Incumbent re-elected. | √ Ed Royce (Republican) 66.4% Bob Davis (Democratic) 29% Jack Dean (Libertarian) 4.6% |
| California 40 | Jerry Lewis | Republican | 1978 | Incumbent re-elected. | √ Jerry Lewis (Republican) 70.7% Don Rusk (Democratic) 29.3% |
| California 41 | Jay Kim | Republican | 1992 | Incumbent re-elected. | √ Jay Kim (Republican) 62.1% Ed Tessier (Democratic) 37.9% |
| California 42 | George Brown, Jr. | Democratic | 1962/1972 | Incumbent re-elected. | √ George Brown, Jr. (Democratic) 51.1% Rob Guzman (Republican) 48.8% Write-in 0.5% |
| California 43 | Ken Calvert | Republican | 1992 | Incumbent re-elected. | √ Ken Calvert (Republican) 54.7% Mark Takano (Democratic) 38.4% Gene L. Berkman (Libertarian) 6.2% Write-ins 0.6% |
| California 44 | Al McCandless | Republican | 1984 | Incumbent retired. New member elected. Republican hold. |
√ Sonny Bono (Republican) 55.6% Steve Clute (Democratic) 38.1% Donald Cochran (American Independence) 6.3% |
| California 45 | Dana Rohrabacher | Republican | 1988 | Incumbent re-elected. | √ Dana Rohrabacher (Republican) 69.1% Brett Williamson (Democratic) 30.9% |
| California 46 | Bob Dornan | Republican | 1976/1984 | Incumbent re-elected. | √ Bob Dornan (Republican) 57.1% Mike Farber (Democratic) 37.2% Richard G. Newhouse (Libertarian) 5.7% |
| California 47 | Christopher Cox | Republican | 1988 | Incumbent re-elected. | √ Christopher Cox (Republican) 71.7% Gary Kingbury (Democratic) 25% Victor A. Wagner, Jr. (Libertarian) 3.4% |
| California 48 | Ron Packard | Republican | 1982 | Incumbent re-elected. | √ Ron Packard (Republican) 73.4% Andrei Leshick (Democratic) 22.2% Donna White (Peace and Freedom) 4.4% |
| California 49 | Lynn Schenk | Democratic | 1992 | Incumbent lost re-election. New member elected. Republican gain. |
√ Brian Bilbray (Republican) 48.5% Lynn Schenk (Democratic) 46% Chris Hoogenboom (Libertarian) 2.8% Renate M. Kline (Peace and Freedom) 2.7% |
| California 50 | Bob Filner | Democratic | 1992 | Incumbent re-elected. | √ Bob Filner (Democratic) 56.7% Mary Alice Acevedo (Republican) 35.4% Richardo Duenez (Libertarian) 3.2% Guillermo Ramirez (Peace and Freedom) 2.9% Kip Krueger (Green) 1.9% |
| California 51 | Duke Cunningham | Republican | 1990 | Incumbent re-elected. | √ Duke Cunningham (Republican) 66.9% Rita Tamerius (Democratic) 27.7% Bill Holmes (Libertarian) 3.4% Miriam Clark (Peace and Freedom) 2% |
| California 52 | Duncan Hunter | Republican | 1980 | Incumbent re-elected. | √ Duncan Hunter (Republican) 64% Janet Gastil (Democratic) 31.1% Joe Shea (Libertarian) 3.1% Art Edelman (Peace and Freedom) 1.9% |
Colorado
| District | Incumbent | This race | |||
|---|---|---|---|---|---|
| Representative | Party | First elected |
Results | Candidates | |
| Colorado 1 | Patricia Schroeder | Democratic | 1972 | Incumbent re-elected. | √ Patricia Schroeder (Democratic) 60.0% William F. Eggert (Republican) 40.0% |
| Colorado 2 | David Skaggs | Democratic | 1986 | Incumbent re-elected. | √ David Skaggs (Democratic) 56.8% Patricia Miller (Republican) 46.2% |
| Colorado 3 | Scott McInnis | Republican | 1992 | Incumbent re-elected. | √ Scott McInnis (Republican) 69.6% Linda Powers (Democratic) 30.4% |
| Colorado 4 | Wayne Allard | Republican | 1990 | Incumbent re-elected. | √ Wayne Allard (Republican) 72.3% Cathy Kipp (Democratic) 27.7% |
| Colorado 5 | Joel Hefley | Republican | 1986 | Incumbent re-elected. | √ Joel Hefley (Republican) Unopposed |
| Colorado 6 | Daniel Schaefer | Republican | 1983 | Incumbent re-elected. | √ Daniel Schaefer (Republican) 69.8% John Hallen (Democratic) 28.0% John Heckman (Concerns of the People) 1.4% Stephen D. Dawson (Natural Law) 0.8% |
Connecticut
| District | Incumbent | This race | |||
|---|---|---|---|---|---|
| Representative | Party | First elected |
Results | Candidates | |
| Connecticut 1 | Barbara B. Kennelly | Democratic | 1982 | Incumbent re-elected. | √ Barbara B. Kennelly (Democratic) 73.5% Douglas Putnam (Republican) 24.7% John F. Forry III (Concerned Citizens) 1.8% |
| Connecticut 2 | Sam Gejdenson | Democratic | 1980 | Incumbent re-elected. | √ Sam Gejdenson (Democratic) 42.56% Edward W. Munster (Republican) 42.55% David Bingham (A Connecticut Party) 14.90% |
| Connecticut 3 | Rosa DeLauro | Democratic | 1990 | Incumbent re-elected. | √ Rosa DeLauro (Democratic) 63.4% Susan Johnson (Republican) 36.6% |
| Connecticut 4 | Chris Shays | Republican | 1987 | Incumbent re-elected. | √ Chris Shays (Republican) 74.4% Jonathan D. Kantrowitz (Democratic) 23.8% Irving Sussman (Libertarian) 1.3% Terry M. Nevas (Natural Law) 0.5% |
| Connecticut 5 | Gary Franks | Republican | 1990 | Incumbent re-elected. | √ Gary Franks (Republican) 52.2% James H. Maloney (Democratic) 45.5% Rosita Rodriguez (Concerned Citizens) 2.3% |
| Connecticut 6 | Nancy Johnson | Republican | 1982 | Incumbent re-elected. | √ Nancy Johnson (Republican) 63.9% Charlotte Koskoff (Democratic) 31.5% Patrick J. Danford (Concerned Citizens) 4.6% |
Delaware
| District | Incumbent | This race | |||
|---|---|---|---|---|---|
| Representative | Party | First elected |
Results | Candidates | |
| Delaware at-large | Michael N. Castle | Republican | 1992 | Incumbent re-elected. | √ Michael N. Castle (Republican) 70.7% Carol Ann DeSantis (Democratic) 26.6% Danny Ray Beaver (Libertarian) 2.0% Donald M. Hockmuth (A Delaware Party) 0.7% |
Florida
| District | Incumbent | This race | |||
|---|---|---|---|---|---|
| Representative | Party | First elected |
Results | Candidates | |
| Florida 1 | Earl Hutto | Democratic | 1978 | Incumbent retired. New member elected. Republican gain. |
√ Joe Scarborough (Republican) 61.6% Vince Whibbs, Jr. (Democratic) 38.4% |
| Florida 2 | Pete Peterson | Democratic | 1990 | Incumbent re-elected. | √ Pete Peterson (Democratic) 61.3% Carole Griffin (Republican) 38.7% |
| Florida 3 | Corrine Brown | Democratic | 1992 | Incumbent re-elected. | √ Corrine Brown (Democratic) 57.7% Marc Little (Republican) 42.3% |
| Florida 4 | Tillie Fowler | Republican | 1992 | Incumbent re-elected. | √ Tillie Fowler (Republican) Unopposed |
| Florida 5 | Karen Thurman | Democratic | 1992 | Incumbent re-elected. | √ Karen Thurman (Democratic) 57.2% Don Garlits (Republican) 42.8% |
| Florida 6 | Cliff Stearns | Republican | 1988 | Incumbent re-elected. | √ Cliff Stearns (Republican) Unopposed |
| Florida 7 | John Mica | Republican | 1992 | Incumbent re-elected. | √ John Mica (Republican) 73.4% Edward D. Goddard (Democratic) 26.6% |
| Florida 8 | Bill McCollum | Republican | 1980 | Incumbent re-elected. | √ Bill McCollum (Republican) Unopposed |
| Florida 9 | Michael Bilirakis | Republican | 1982 | Incumbent re-elected. | √ Michael Bilirakis (Republican) Unopposed |
| Florida 10 | Bill Young | Republican | 1970 | Incumbent re-elected. | √ Bill Young (Republican) Unopposed |
| Florida 11 | Sam Gibbons | Democratic | 1962 | Incumbent re-elected. | √ Sam Gibbons (Democratic) 51.6% Mark Sharpe (Republican) 48.2% |
| Florida 12 | Charles T. Canady | Republican | 1992 | Incumbent re-elected. | √ Charles T. Canady (Republican) 65.0% Robert Connors (Democratic) 35.0% |
| Florida 13 | Dan Miller | Republican | 1992 | Incumbent re-elected. | √ Dan Miller (Republican) Unopposed |
| Florida 14 | Porter Goss | Republican | 1988 | Incumbent re-elected. | √ Porter J. Goss (Republican) Unopposed |
| Florida 15 | Jim Bacchus | Democratic | 1990 | Incumbent retired. New member elected. Republican gain. |
√ Dave Weldon (Republican) 53.7% Sue Munsey (Democratic) 46.1% |
| Florida 16 | Tom Lewis | Republican | 1982 | Incumbent retired. New member elected. Republican hold. |
√ Mark Foley (Republican) 58.1% John P. Comerford (Democratic) 41.9% |
| Florida 17 | Carrie Meek | Democratic | 1992 | Incumbent re-elected. | √ Carrie P. Meek (Democratic) Unopposed |
| Florida 18 | Ileana Ros-Lehtinen | Republican | 1989 (Special) | Incumbent re-elected. | √ Ileana Ros-Lehtinen (Republican) Unopposed |
| Florida 19 | Harry Johnston | Democratic | 1988 | Incumbent re-elected. | √ Harry Johnston (Democratic) 66.1% Peter J. Tsakanikas (Republican) 33.9% |
| Florida 20 | Peter Deutsch | Democratic | 1992 | Incumbent re-elected. | √ Peter Deutsch (Democratic) 61.2% Beverly Kennedy (Republican) 38.8% |
| Florida 21 | Lincoln Diaz-Balart | Republican | 1992 | Incumbent re-elected. | √ Lincoln Diaz-Balart (Republican) Unopposed |
| Florida 22 | Clay Shaw | Republican | 1980 | Incumbent re-elected. | √ Clay Shaw (Republican) 63.4% Hermine L. Wiener (Democratic) 36.6% |
| Florida 23 | Alcee Hastings | Democratic | 1992 | Incumbent re-elected. | √ Alcee Hastings (Democratic) Unopposed |
Georgia
| District | Incumbent | This race | |||
|---|---|---|---|---|---|
| Representative | Party | First elected |
Results | Candidates | |
| Georgia 1 | Jack Kingston | Republican | 1992 | Incumbent re-elected. | √ Jack Kingston (Republican) 76.6% Raymond Beckworth (Democratic) 23.4% |
| Georgia 2 | Sanford Bishop | Democratic | 1992 | Incumbent re-elected. | √ Sanford Bishop (Democratic) 66.2% John Clayton (Republican) 33.8% |
| Georgia 3 | Mac Collins | Republican | 1992 | Incumbent re-elected. | √ Mac Collins (Republican) 65.5% Fred Overby (Democratic) 34.5% |
| Georgia 4 | John Linder | Republican | 1992 | Incumbent re-elected. | √ John Linder (Republican) 57.9% Comer Yates (Democratic) 42.1% |
| Georgia 5 | John Lewis | Democratic | 1986 | Incumbent re-elected. | √ John Lewis (Democratic) 69.1% Dale Dixon (Republican) 30.9% |
| Georgia 6 | Newt Gingrich | Republican | 1978 | Incumbent re-elected. | √ Newt Gingrich (Republican) 64.2% Ben L. Jones (Democratic) 35.8% |
| Georgia 7 | George Darden | Democratic | 1983 | Incumbent lost re-election. New member elected. Republican gain. |
√ Bob Barr (Republican) 51.9% George Darden (Democratic) 48.1% |
| Georgia 8 | J. Roy Rowland | Democratic | 1982 | Incumbent retired. New member elected. Republican gain. |
√ Saxby Chambliss (Republican) 62.7% Craig Mathis (Democratic) 37.3% |
| Georgia 9 | Nathan Deal | Democratic | 1992 | Incumbent re-elected. | √ Nathan Deal (Democratic) 57.9% Robert L. Castello (Republican) 42.1% |
| Georgia 10 | Don Johnson | Democratic | 1992 | Incumbent lost re-election. New member elected. Republican gain. |
√ Charlie Norwood (Republican) 65.2% Don Johnson (Democratic) 34.8% |
| Georgia 11 | Cynthia McKinney | Democratic | 1992 | Incumbent re-elected. | √ Cynthia McKinney (Democratic) 65.6% Woodrow Lovett (Republican) 34.4% |
Hawaii
| District | Incumbent | This race | |||
|---|---|---|---|---|---|
| Representative | Party | First elected |
Results | Candidates | |
| Hawaii 1 | Neil Abercrombie | Democratic | 1990 | Incumbent re-elected. | √ Neil Abercrombie (Democratic) 53.6% Orson Swindle (Republican) 43.4% Alexandria Kaan (Best) 1.6% Roger Lee Taylor (Libertarian) 1.4% |
| Hawaii 2 | Patsy Mink | Democratic | 1990 | Incumbent re-elected. | √ Patsy Mink (Democratic) 70.1% Robert H. Garner (Republican) 24.2% Larry Bartley (Libertarian) 5.7% |
Idaho
| District | Incumbent | This race | |||
|---|---|---|---|---|---|
| Representative | Party | First elected |
Results | Candidates | |
| Idaho 1 | Larry LaRocco | Democratic | 1990 | Incumbent lost re-election. New member elected. Republican gain. |
√ Helen Chenoweth (Republican) 55.4% Larry LaRocco (Democratic) 44.6% |
| Idaho 2 | Mike Crapo | Republican | 1992 | Incumbent re-elected. | √ Mike Crapo (Republican) 75.0% Penny Fletcher (Democratic) 25.0% |
Illinois
| District | Incumbent | This race | |||
|---|---|---|---|---|---|
| Representative | Party | First elected |
Results | Candidates | |
| Illinois 1 | Bobby Rush | Democratic | 1992 | Incumbent re-elected. | √ Bobby Rush (Democratic) 75.7% William J. Kelly (Republican) 24.3% |
| Illinois 2 | Mel Reynolds | Democratic | 1992 | Incumbent re-elected. | √ Mel Reynolds (Democratic) Unopposed |
| Illinois 3 | Bill Lipinski | Democratic | 1982 | Incumbent re-elected. | √ Bill Lipinski (Democratic) 54.2% Jim Nalepa (Republican) 45.8% |
| Illinois 4 | Luis Gutiérrez | Democratic | 1992 | Incumbent re-elected. | √ Luis Gutiérrez (Democratic) 75.2% Steven Valtierra (Republican) 24.8% |
| Illinois 5 | Dan Rostenkowski | Democratic | 1958 | Incumbent lost re-election. New member elected. Republican gain. |
√ Michael Patrick Flanagan (Republican) 54.4% Dan Rostenkowski (Democratic) 45.6% |
| Illinois 6 | Henry Hyde | Republican | 1974 | Incumbent re-elected. | √ Henry Hyde (Republican) 73.5% Tom Berry (Democratic) 23.6% Robert L. Hogan (Libertarian) 1.7% Robert L. Wheat (United Independent) 1.2% |
| Illinois 7 | Cardiss Collins | Democratic | 1973 | Incumbent re-elected. | √ Cardiss Collins (Democratic) 79.6% Charles Mobley (Republican) 20.4% |
| Illinois 8 | Phil Crane | Republican | 1969 | Incumbent re-elected. | √ Phil Crane (Republican) 64.9% Robert C. Walberg (Democratic) 35.1% |
| Illinois 9 | Sidney R. Yates | Democratic | 1964 | Incumbent re-elected. | √ Sidney R. Yates (Democratic) 66.1% George Edward Larney (Republican) 33.9% |
| Illinois 10 | John Porter | Republican | 1980 | Incumbent re-elected. | √ John Porter (Republican) 75.1% Andrew M. Krupp (Democratic) 24.9% |
| Illinois 11 | George E. Sangmeister | Democratic | 1988 | Incumbent retired. New member elected. Republican gain. |
√ Jerry Weller (Republican) 60.6% Frank Giglio (Democratic) 39.4% |
| Illinois 12 | Jerry Costello | Democratic | 1988 | Incumbent re-elected. | √ Jerry Costello (Democratic) 65.9% Jan Morris (Republican) 34.1% |
| Illinois 13 | Harris W. Fawell | Republican | 1984 | Incumbent re-elected. | √ Harris W. Fawell (Republican) 73.1% William A. Riley (Democratic) 26.9% |
| Illinois 14 | Dennis Hastert | Republican | 1986 | Incumbent re-elected. | √ Dennis Hastert (Republican) 76.5% Steve Denari (Democratic) 23.5% |
| Illinois 15 | Thomas W. Ewing | Republican | 1991 | Incumbent re-elected. | √ Thomas W. Ewing (Republican) 68.2% Paul Alexander (Democratic) 31.8% |
| Illinois 16 | Donald A. Manzullo | Republican | 1992 | Incumbent re-elected. | √ Donald A. Manzullo (Republican) 70.6% Pete Sullivan (Democratic) 29.4% |
| Illinois 17 | Lane Evans | Democratic | 1982 | Incumbent re-elected. | √ Lane Evans (Democratic) 54.5% Jim Anderson (Republican) 45.5% |
| Illinois 18 | Robert H. Michel | Republican | 1956 | Incumbent retired. New member elected. Republican hold. |
√ Ray LaHood (Republican) 60.2% G. Douglas Stephens (Democratic) 39.3% |
| Illinois 19 | Glenn Poshard | Democratic | 1988 | Incumbent re-elected. | √ Glenn Poshard (Democratic) 58.4% Brent Winters (Republican) 41.6% |
| Illinois 20 | Richard Durbin | Democratic | 1982 | Incumbent re-elected. | √ Richard Durbin (Democratic) 54.8% Bill Owens (Republican) 45.2% |
Indiana
| District | Incumbent | This race | |||
|---|---|---|---|---|---|
| Representative | Party | First elected |
Results | Candidates | |
| Indiana 1 | Pete Visclosky | Democratic | 1984 | Incumbent re-elected. | √ Pete Visclosky (Democratic) 56.5% John Larson (Republican) 43.5% |
| Indiana 2 | Philip Sharp | Democratic | 1974 | Incumbent retired. New member elected. Republican gain. |
√ David M. McIntosh (Republican) 54.5% Joe Hogsett (Democratic) 45.5% |
| Indiana 3 | Timothy J. Roemer | Democratic | 1990 | Incumbent re-elected. | √ Timothy J. Roemer (Democratic) 55.2% Richard Burkett (Republican) 44.8% |
| Indiana 4 | Jill L. Long | Democratic | 1989 | Incumbent lost re-election. New member elected. Republican gain. |
√ Mark Souder (Republican) 55.4% Jill L. Long (Democratic) 44.6% |
| Indiana 5 | Steve Buyer | Republican | 1992 | Incumbent re-elected. | √ Steve Buyer (Republican) 69.5% J. D. Beatty (Democratic) 28.3% Clayton L. Alfred (Independent) 2.1% |
| Indiana 6 | Dan Burton | Republican | 1982 | Incumbent re-elected. | √ Dan Burton (Republican) 77.0% Natalie M. Bruner (Democratic) 23.0% |
| Indiana 7 | John T. Myers | Republican | 1966 | Incumbent re-elected. | √ John T. Myers (Republican) 65.1% Michael M. Harmless (Democratic) 34.9% |
| Indiana 8 | Frank McCloskey | Democratic | 1982 | Incumbent lost re-election. New member elected. Republican gain. |
√ John Hostettler (Republican) 52.4% Frank McCloskey (Democratic) 47.6% |
| Indiana 9 | Lee H. Hamilton | Democratic | 1964 | Incumbent re-elected. | √ Lee H. Hamilton (Democratic) 52.0% Jean Leising (Republican) 48.0% |
| Indiana 10 | Andrew Jacobs, Jr. | Democratic | 1964 | Incumbent re-elected. | √ Andrew Jacobs, Jr. (Democratic) 53.5% Marvin Scott (Republican) 46.5% |
Iowa
| District | Incumbent | This race | |||
|---|---|---|---|---|---|
| Representative | Party | First elected |
Results | Candidates | |
| Iowa 1 | Jim Leach | Republican | 1976 | Incumbent re-elected. | √ Jim Leach (Republican) 60.2% Glen Winekauf (Democratic) 37.9% Jan J. Zonneveld (Independent) 1.2% Michael Cuddehe (Natural Law) 0.7% |
| Iowa 2 | Jim Nussle | Republican | 1990 | Incumbent re-elected. | √ Jim Nussle (Republican) 56.0% David R. Nagle (Democratic) 43.4% Albert W. Schoeman (Libertarian) 0.6% |
| Iowa 3 | Jim Ross Lightfoot | Republican | 1984 | Incumbent re-elected. | √ Jim Ross Lightfoot (Republican) 57.8% Elaine Baxter (Democratic) 41.0% Derrick P. Grimmer (Grassroots) 1.2% |
| Iowa 4 | Neal Edward Smith | Democratic | 1958 | Incumbent lost re-election. New member elected. Republican gain. |
√ Greg Ganske (Republican) 52.5% Neal Edward Smith (Democratic) 46.4% Joshua A. Roberts (Natural Law) 0.4% William C. Oviatt (Grassroots) 0.4% Angela L. Lariscy (Socialist Workers) 0.3% |
| Iowa 5 | Fred Grandy | Republican | 1986 | Incumbent retired to run for Governor of Iowa. New member elected. Republican hold. |
√ Tom Latham (Republican) 60.8% Sheila McGuire Riggs (Democratic) 39.0% |
Kansas
| District | Incumbent | This race | |||
|---|---|---|---|---|---|
| Representative | Party | First elected |
Results | Candidates | |
| Kansas 1 | Pat Roberts | Republican | 1980 | Incumbent re-elected. | √ Pat Roberts (Republican) 77.4% Terry L. Nichols (Democratic) 22.6% |
| Kansas 2 | Jim Slattery | Democratic | 1982 | Incumbent retired to run for Governor of Kansas. New member elected. Republican gain. |
√ Sam Brownback (Republican) 65.6% John W. Carlin (Democratic) 34.4% |
| Kansas 3 | Jan Meyers | Republican | 1984 | Incumbent re-elected. | √ Jan Meyers (Republican) 56.6% Richard Burkett (Democratic) 43.4% |
| Kansas 4 | Dan Glickman | Democratic | 1976 | Incumbent lost re-election. New member elected. Republican gain. |
√ Todd Tiahrt (Republican) 52.9% Dan Glickman (Democratic) 47.1% |
Kentucky
| District | Incumbent | This race | |||
|---|---|---|---|---|---|
| Representative | Party | First elected |
Results | Candidates | |
| Kentucky 1 | Thomas Barlow | Democratic | 1992 | Incumbent lost re-election. New member elected. Republican gain. |
√ Ed Whitfield (Republican) 51.0% Thomas Barlow (Democratic) 49.0% |
| Kentucky 2 | Ron Lewis | Republican | 1994 | Incumbent re-elected. | √ Ron Lewis (Republican) 59.8% David Adkisson (Democratic) 40.2% |
| Kentucky 3 | Romano L. Mazzoli | Democratic | 1970 | Incumbent retired. New member elected. Democratic hold. |
√ Mike Ward (Democratic) 44.4% Susan Stokes (Republican) 44.1% Richard Lewis (Taxpayers) 11.6% |
| Kentucky 4 | Jim Bunning | Republican | 1986 | Incumbent re-elected. | √ Jim Bunning (Republican) 74.1% Sally Harris Skaggs (Democratic) 25.9% |
| Kentucky 5 | Hal Rogers | Republican | 1980 | Incumbent re-elected. | √ Hal Rogers (Republican) 79.4% Walter Blevins (Democratic) 20.6% |
| Kentucky 6 | Scotty Baesler | Democratic | 1992 | Incumbent re-elected. | √ Scotty Baesler (Democratic) 58.8% Mathhew Eric Wills (Republican) 41.2% |
Louisiana
| District | Incumbent | This race | |||
|---|---|---|---|---|---|
| Representative | Party | First elected |
Results | Candidates | |
| Louisiana 1 | Bob Livingston | Republican | 1977 | Incumbent re-elected. | √ Bob Livingston (Republican) 81.2% Forrest McNeir (Democratic) 11.9% Clark Simmons (Independent) 6.9% |
| Louisiana 2 | William J. Jefferson | Democratic | 1990 | Incumbent re-elected. | √ William J. Jefferson (Democratic) 77.6% Robert Namer (Republican) 19.2% Julius Leahman (Democratic) 3.2% |
| Louisiana 3 | Billy Tauzin | Democratic | 1980 | Incumbent re-elected. | √ Billy Tauzin (Democratic) 76.2% Nicholas J. Accardo (Independent) 23.8% |
| Louisiana 4 | Cleo Fields | Democratic | 1992 | Incumbent re-elected. | √ Cleo Fields (Democratic) 69.9% Patricia Slocum (Republican) 30.1% |
| Louisiana 5 | Jim McCrery | Republican | 1988 | Incumbent re-elected. | √ Jim McCrery (Republican) 79.8% Paul Henry Kidd (Democratic) 16.2% E. Austin Simmons (Independent) 4.0% |
| Louisiana 6 | Richard Baker | Republican | 1986 | Incumbent re-elected. | √ Richard Baker (Republican) 81.1% Darryl Paul Ward (Democratic) 18.9% |
| Louisiana 7 | Jimmy Hayes | Democratic | 1986 | Incumbent re-elected. | √ Jimmy Hayes (Democratic) 53.0% Clyde C. Holloway (Republican) 39.7% Ron Caesar (Independent) 7.3% |
Maine
| District | Incumbent | This race | |||
|---|---|---|---|---|---|
| Representative | Party | First elected |
Results | Candidates | |
| Maine 1 | Thomas Andrews | Democratic | 1990 | Incumbent retired to run for U.S. Senator. New member elected. Republican gain. |
√ James B. Longley, Jr. (Republican) 51.9% Dennis L. Dutremble (Democratic) 48.1% |
| Maine 2 | Olympia Snowe | Republican | 1978 | Incumbent retired to run for U.S. Senator. New member elected. Democratic gain. |
√ John Baldacci (Democratic) 45.7% Richard A. Bennett (Republican) 40.8% John M. Michael (Independent) 8.8% Charles Fitzgerald (G) 4.7% |
Maryland
| District | Incumbent | This race | |||
|---|---|---|---|---|---|
| Representative | Party | First elected |
Results | Candidates | |
| Maryland 1 | Wayne Gilchrest | Republican | 1990 | Incumbent re-elected. | √ Wayne Gilchrest (Republican) 67.7% Ralph T. Gies (Democratic) 32.3% Wayne Boyle (Democratic) 0.1% |
| Maryland 2 | Helen Delich Bentley | Republican | 1984 | Incumbent retired to run for Governor of Maryland. New member elected. |
√ Robert Ehrlich (Republican) 62.7% Gerry L. Brewster (Democratic) 37.2% |
| Maryland 3 | Ben Cardin | Democratic | 1986 | Incumbent re-elected. | √ Ben Cardin (Democratic) 71.0% Robert Ryan Tousey (Republican) 29.0% |
| Maryland 4 | Albert Wynn | Democratic | 1992 | Incumbent re-elected. | √ Albert Wynn (Democratic) 75.0% Michele H. Dyson (Republican) 25.0% |
| Maryland 5 | Steny Hoyer | Democratic | 1981 | Incumbent re-elected. | √ Steny Hoyer (Democratic) 58.8% Donald Devine (Republican) 41.2% |
| Maryland 6 | Roscoe Bartlett | Republican | 1992 | Incumbent re-elected. | √ Roscoe Bartlett (Republican) 65.9% Paul Muldowney (Democratic) 34.1% |
| Maryland 7 | Kweisi Mfume | Democratic | 1986 | Incumbent re-elected. | √ Kweisi Mfume (Democratic) 81.5% Kenneth Kondner (Republican) 18.5% |
| Maryland 8 | Connie Morella | Republican | 1986 | Incumbent re-elected. | √ Connie Morella (Republican) 70.3% Steven Van Grack (Democratic) 29.7% |
Massachusetts
| District | Incumbent | This race | |||
|---|---|---|---|---|---|
| Representative | Party | First elected |
Results | Candidates | |
| Massachusetts 1 | John Olver | Democratic | 1991 | Incumbent re-elected. | √ John Olver (Democratic) Unopposed |
| Massachusetts 2 | Richard Neal | Democratic | 1988 | Incumbent re-elected. | √ Richard Neal (Democratic) 58.6% John M. Briare (Republican) 36.3% Kate Ross (Natural Law) 5.1% |
| Massachusetts 3 | Peter I. Blute | Republican | 1992 | Incumbent re-elected. | √ Peter I. Blute (Republican) 54.6% Kevin O'Sullivan (Democratic) 44.2% Dale E. Friedgen (Natural Law) 1.1% |
| Massachusetts 4 | Barney Frank | Democratic | 1980 | Incumbent re-elected. | √ Barney Frank (Democratic) Unopposed |
| Massachusetts 5 | Marty Meehan | Democratic | 1992 | Incumbent re-elected. | √ Marty Meehan (Democratic) 69.8% David E. Coleman (Republican) 30.1% |
| Massachusetts 6 | Peter G. Torkildsen | Republican | 1992 | Incumbent re-elected. | √ Peter G. Torkildsen (Republican) 50.5% John F. Tierney (Democratic) 47.4% Benjamin A. Gatchell (Independent) 2.1% |
| Massachusetts 7 | Ed Markey | Democratic | 1976 | Incumbent re-elected. | √ Ed Markey (Democratic) 64.4% Brad Bailey (Republican) 35.5% |
| Massachusetts 8 | Joe Kennedy | Democratic | 1986 | Incumbent re-elected. | √ Joe Kennedy (Democratic) Unopposed |
| Massachusetts 9 | Joe Moakley | Democratic | 1972 | Incumbent re-elected. | √ Joe Moakley (Democratic) 69.8% Michael M. Murphy (Republican) 30.2% |
| Massachusetts 10 | Gerry Studds | Democratic | 1972 | Incumbent re-elected. | √ Gerry Studds (Democratic) 68.7% Keith Jason Hemeon (Republican) 31.2% |
Michigan
| District | Incumbent | This race | |||
|---|---|---|---|---|---|
| Representative | Party | First elected |
Results | Candidates | |
| Michigan 1 | Bart Stupak | Democratic | 1992 | Incumbent re-elected. | √ Bart Stupak (Democratic) 56.9% Gil Ziegler (Republican) 42.0% Michael McPeak (Natural Law) 1.1% |
| Michigan 2 | Pete Hoekstra | Republican | 1992 | Incumbent re-elected. | √ Pete Hoekstra (Republican) 75.3% Marcus Hoover (Democratic) 23.7% Lu Wiggins (Natural Law) 1.0% |
| Michigan 3 | Vern Ehlers | Republican | 1993 | Incumbent re-elected. | √ Vern Ehlers (Republican) 73.9% Betsy J. Flory (Democratic) 23.5% Barrie Leslie Konicov (Libertarian) 1.6% Susan H. Normandin (Natural Law) 1.0% |
| Michigan 4 | David Lee Camp | Republican | 1990 | Incumbent re-elected. | √ David Lee Camp (Republican) 73.1% Damion Frasier (Democratic) 25.5% Michael Lee (Natural Law) 1.4% |
| Michigan 5 | James A. Barcia | Democratic | 1992 | Incumbent re-elected. | √ James A. Barcia (Democratic) 65.5% William T. Anderson (Republican) 31.8% Larry L. Fairchild (Independent) 1.6% Susan I. Arnold (Natural Law) 1.2% |
| Michigan 6 | Fred Upton | Republican | 1986 | Incumbent re-elected. | √ Fred Upton (Republican) 73.5% David Taylor (Democratic) 25.5% Ennis A. Berker (Natural Law) 1.0% |
| Michigan 7 | Nick Smith | Republican | 1992 | Incumbent re-elected. | √ Nick Smith (Republican) 65.1% Kim McCaughtry (Democratic) 32.3% Ken Proctor (Libertarian) 1.9% Scott K. Williamson (Natural Law) 0.7% |
| Michigan 8 | Bob Carr | Democratic | 1982 | Incumbent retired to run for U.S. Senator. New member elected. Republican gain. |
√ Dick Chrysler (Republican) 51.6% Bob Mitchell (Democratic) 44.9% Gerald Ralph Turcotte, Jr. (Libertarian) 2.0% Susan Ilene McPeak (Natural Law) 1.4% |
| Michigan 9 | Dale E. Kildee | Democratic | 1976 | Incumbent re-elected. | √ Dale E. Kildee (Democratic) 51.2% Megan O'Neill (Republican) 47.0% Karen Blasdell-Wilkinson (Natural Law) 1.7% |
| Michigan 10 | David E. Bonior | Democratic | 1976 | Incumbent re-elected. | √ David E. Bonior (Democratic) 62.2% Donald J. Lobsinger (Republican) 37.7% |
| Michigan 11 | Joe Knollenberg | Republican | 1992 | Incumbent re-elected. | √ Joe Knollenberg (Republican) 68.2% Mike Breshgold (Democratic) 30.5% John R. Hocking (Natural Law) 1.3% |
| Michigan 12 | Sander M. Levin | Democratic | 1982 | Incumbent re-elected. | √ Sander M. Levin (Democratic) 52.0% John Pappageorge (Republican) 46.6% Jerome White (Independent) 0.7% Eric R. Anderson (Natural Law) 0.7% |
| Michigan 13 | William D. Ford | Democratic | 1964 | Incumbent retired. New member elected. Democratic hold. |
√ Lynn N. Rivers (Democratic) 51.9% John A. Schall (Republican) 45.1% Craig L. Seymour (Libertarian) 1.8% Helen Halyard (Independent) 0.8% Gail Anne Petrosoff (Natural Law) 0.4% |
| Michigan 14 | John Conyers | Democratic | 1964 | Incumbent re-elected. | √ John Conyers (Democratic) 81.5% Richard Charles Fournier (Republican) 16.6% Richard R. Miller (Natural Law) 1.9% |
| Michigan 15 | Barbara-Rose Collins | Democratic | 1990 | Incumbent re-elected. | √ Barbara-Rose Collins (Democratic) 84.1% John W. Savage II (Republican) 14.1% Cynthia M. Jaquith (Independent) 0.7% Henry Ogden Clark (Natural Law) 0.6% Larry Roberts (Independent) 0.5% |
| Michigan 16 | John Dingell | Democratic | 1955 | Incumbent re-elected. | √ John Dingell (Democratic) 59.1% Ken Larkin (Republican) 39.8% Noha Fouad Hamze (Natural Law) 1.1% |
Minnesota
| District | Incumbent | This race | |||
|---|---|---|---|---|---|
| Representative | Party | First elected |
Results | Candidates | |
| Minnesota 1 | Tim Penny | Democratic | 1982 | Incumbent retired. New member elected. Republican gain. |
√ Gil Gutknecht (Republican) 55.2% John C. Hottinger (Democratic) 44.7% |
| Minnesota 2 | David Minge | Democratic | 1992 | Incumbent re-elected. | √ David Minge (Democratic) 52.0% Gary Revier (Republican) 45.0% Stan Bentz (Reform) 3.0% |
| Minnesota 3 | Jim Ramstad | Republican | 1990 | Incumbent re-elected. | √ Jim Ramstad (Republican) 73.2% Bob Olson (Democratic) 26.3% |
| Minnesota 4 | Bruce Vento | Democratic | 1976 | Incumbent re-elected. | √ Bruce Vento (Democratic) 54.7% Dennis Newinski (Republican) 41.8% Dan R. Vacek (Grassroots) 2.9% |
| Minnesota 5 | Martin Olav Sabo | Democratic | 1978 | Incumbent re-elected. | √ Martin Olav Sabo (Democratic) 61.9% Dorothy Legrand (Republican) 37.3% |
| Minnesota 6 | Rod Grams | Republican | 1992 | Incumbent retired to run for U.S. Senator. New member elected. Democratic gain. |
√ Bill Luther (Democratic) 49.9% Tad Jude (Republican) 49.7% |
| Minnesota 7 | Collin Peterson | Democratic | 1990 | Incumbent re-elected. | √ Collin Peterson (Democratic) 51.2% Bernie Omann (Republican) 48.6% |
| Minnesota 8 | Jim Oberstar | Democratic | 1974 | Incumbent re-elected. | √ Jim Oberstar (Democratic) 65.7% Phil Herwig (Republican) 34.2% |
Mississippi
| District | Incumbent | This race | |||
|---|---|---|---|---|---|
| Representative | Party | First elected |
Results | Candidates | |
| Mississippi 1 | Jamie L. Whitten | Democratic | 1941 | Incumbent retired. New member elected. Republican gain. |
√ Roger Wicker (Republican) 63.1% Bill Wheeler (Democratic) 36.9% |
| Mississippi 2 | Bennie Thompson | Democratic | 1993 | Incumbent re-elected. | √ Bennie Thompson (Democratic) 53.7% Bill Jordan (Republican) 38.9% Vincent P. Thornton (Taxpayers) 7.4% |
| Mississippi 3 | Sonny Montgomery | Democratic | 1966 | Incumbent re-elected. | √ Sonny Montgomery (Democratic) 67.6% Dutch Dabbs (Republican) 32.4% |
| Mississippi 4 | Michael Parker | Democratic | 1988 | Incumbent re-elected. | √ Michael Parker (Democratic) 68.5% Mike Wood (Republican) 31.5% |
| Mississippi 5 | Gene Taylor | Democratic | 1989 | Incumbent re-elected. | √ Gene Taylor (Democratic) 60.1% George Barlos (Republican) 39.9% |
Missouri
| District | Incumbent | This race | |||
|---|---|---|---|---|---|
| Representative | Party | First elected |
Results | Candidates | |
| Missouri 1 | Bill Clay | Democratic | 1968 | Incumbent re-elected. | √ Bill Clay (Democratic) 63.4% Donald R. Counts (Republican) 32.9% Craig W. Williamson (Libertarian) 3.7% |
| Missouri 2 | Jim Talent | Republican | 1992 | Incumbent re-elected. | √ Jim Talent (Republican) 67.3% Pat Kelly (Democratic) 30.6% James Higgins (Libertarian) 2.1% |
| Missouri 3 | Dick Gephardt | Democratic | 1976 | Incumbent re-elected. | √ Dick Gephardt (Democratic) 57.7% Gary Gill (Republican) 39.7% Bradley Ems (Libertarian) 2.6% |
| Missouri 4 | Ike Skelton | Democratic | 1976 | Incumbent re-elected. | √ Ike Skelton (Democratic) 67.8% James A. Noland, Jr. (Republican) 32.3% |
| Missouri 5 | Alan Wheat | Democratic | 1982 | Incumbent retired to run for U.S. Senator. New member elected. Democratic hold. |
√ Karen McCarthy (Democratic) 56.6% Ron Freeman (Republican) 43.4% |
| Missouri 6 | Pat Danner | Democratic | 1992 | Incumbent re-elected. | √ Pat Danner (Democratic) 66.1% Tina Tucker (Republican) 33.9% |
| Missouri 7 | Mel Hancock | Republican | 1988 | Incumbent re-elected. | √ Mel Hancock (Republican) 57.3% James R. Fossard (Democratic) 39.7% Doug Burlison (Libertarian) 3.0% |
| Missouri 8 | Bill Emerson | Republican | 1980 | Incumbent re-elected. | √ Bill Emerson (Republican) 70.1% James L. Thompson (Democratic) 26.6% Greg Tlapek (Libertarian) 3.4% |
| Missouri 9 | Harold Volkmer | Democratic | 1976 | Incumbent re-elected. | √ Harold Volkmer (Democratic) 50.5% Kenny Hulshof (Republican) 45.0% Mitchell J. Moore (Libertarian) 4.5% |
Montana
| District | Incumbent | This race | |||
|---|---|---|---|---|---|
| Representative | Party | First elected |
Results | Candidates | |
| Montana at-large | Pat Williams | Democratic | 1978 | Incumbent re-elected. | √ Pat Williams (Democratic) 48.7% Cy Jamison (Republican) 42.2% Steve Kelly (Independent) 9.1% |
Nebraska
| District | Incumbent | This race | |||
|---|---|---|---|---|---|
| Representative | Party | First elected |
Results | Candidates | |
| Nebraska 1 | Doug Bereuter | Republican | 1978 | Incumbent re-elected. | √ Doug Bereuter (Republican) 62.6% Patrick Combs (Democratic) 37.3% |
| Nebraska 2 | Peter Hoagland | Democratic | 1988 | Incumbent lost re-election. New member elected. Republican gain. |
√ Jon Lynn Christensen (Republican) 49.9% Peter Hoagland (Democratic) 49.0% |
| Nebraska 3 | Bill Barrett | Republican | 1990 | Incumbent re-elected. | √ Bill Barrett (Republican) 78.7% Gil Chapin (Democratic) 21.3% |
Nevada
| District | Incumbent | This race | |||
|---|---|---|---|---|---|
| Representative | Party | First elected |
Results | Candidates | |
| Nevada 1 | James Bilbray | Democratic | 1986 | Incumbent lost re-election. New member elected. Republican gain. |
√ John Ensign (Republican) 48.5% James Bilbray (Democratic) 47.5% Gary Wood (Libertarian) 4.0% |
| Nevada 2 | Barbara Vucanovich | Republican | 1982 | Incumbent re-elected. | √ Barbara Vucanovich (Republican) 63.5% Janet Greeson (Democratic) 29.2% Thomas F. Jefferson (Ind. American) 4.3% Lois Avery (Natural Law) 3.0% |
New Hampshire
| District | Incumbent | This race | |||
|---|---|---|---|---|---|
| Representative | Party | First elected |
Results | Candidates | |
| New Hampshire 1 | Bill Zeliff | Republican | 1990 | Incumbent re-elected. | √ Bill Zeliff (Republican) 65.6% Bill Verge (Democratic) 28.7% Scott Tosti (Independent) 2.8% Paul Lannon (Libertarian) 2.4% Merle Braley (Natural Law) 0.4% |
| New Hampshire 2 | Richard Swett | Democratic | 1990 | Incumbent lost re-election. New member elected. Republican gain. |
√ Charlie Bass (Republican) 51.4% Richard Swett (Democratic) 46.0% John A. Lewicke (Libertarian) 1.8% Linda Spitzfaden (Natural Law) 0.8% |
New Jersey
| District | Incumbent | This race | |||
|---|---|---|---|---|---|
| Representative | Party | First elected |
Results | Candidates | |
| New Jersey 1 | Rob Andrews | Democratic | 1990 | Incumbent re-elected. | √ Rob Andrews (Democratic) 72.3% James N. Hogan (Republican) 27.7% |
| New Jersey 2 | William J. Hughes | Democratic | 1974 | Incumbent retired. New member elected. Republican gain. |
√ Frank LoBiondo (Republican) 64.6% Louis N. Magazzu (Democratic) 35.4% |
| New Jersey 3 | Jim Saxton | Republican | 1984 | Incumbent re-elected. | √ Jim Saxton (Republican) 66.4% James B. Smith (Democratic) 31.2% D. James Hill (United We Serve) 1.7% Arthur Fulvio Croce (Democracy in Action) 0.6% |
| New Jersey 4 | Chris Smith | Republican | 1980 | Incumbent re-elected. | √ Chris Smith (Republican) 67.9% Ralph Walsh (Democratic) 30.6% Leonard P. Marshall (NJ Conservative) 1.0% Arnold Kokans (Natural Law) 0.5% |
| New Jersey 5 | Marge Roukema | Republican | 1980 | Incumbent re-elected. | √ Marge Roukema (Republican) 74.2% Bill Auer (Democratic) 21.9% William J. Leonard (Independent) 2.0% Roger W. Bacon (Libertarian) 1.5% Helen Hamilton (Natural Law) 0.3% |
| New Jersey 6 | Frank Pallone | Democratic | 1988 | Incumbent re-elected. | √ Frank Pallone (Democratic) 60.4% Mike Herson (Republican) 37.5% Charles H. Dickson (Independent) 1.2% Gary J. Rich (Conservative) 0.5% Richard Quinn (Natural Law) 0.4% |
| New Jersey 7 | Bob Franks | Republican | 1992 | Incumbent re-elected. | √ Bob Franks (Republican) 59.6% Karen Carroll (Democratic) 38.7% James J. Cleary (LaRouche) 1.4% Claire Greene (Natural Law) 0.3% |
| New Jersey 8 | Herbert Klein | Democratic | 1992 | Incumbent lost re-election. New member elected. Republican gain. |
√ William J. Martini (Republican) 49.9% Herbert Klein (Democratic) 48.6% Bernard George (NJ Conservative) 1.6% |
| New Jersey 9 | Robert Torricelli | Democratic | 1982 | Incumbent re-elected. | √ Robert Torricelli (Democratic) 62.5% Peter J. Russo (Republican) 36.1% Gregory Pason (Independent) 0.9% Kenneth Ebel (Natural Law) 0.5% |
| New Jersey 10 | Donald M. Payne | Democratic | 1988 | Incumbent re-elected. | √ Donald M. Payne (Democratic) 75.9% Jim Ford (Republican) 21.9% Rose Monyek (Independent) 1.6% Maurice Williams (Socialist Workers) 0.6% |
| New Jersey 11 | Dean Gallo | Republican | 1984 | Incumbent died November 6, 1994. New member elected. Republican hold. |
√ Rodney P. Frelinghuysen (Republican) 71.2% Frank Herbert (Democratic) 28.0% Mary Frueholz (LaRouche) 0.6% Stuart Bacha (Independent) 0.2% |
| New Jersey 12 | Dick Zimmer | Republican | 1990 | Incumbent re-elected. | √ Dick Zimmer (Republican) 68.3% Joseph D. Youssouf (Democratic) 30.4% Anthony M. Provenzano (NJ Conservative) 1.3% |
| New Jersey 13 | Bob Menendez | Democratic | 1992 | Incumbent re-elected. | √ Bob Menendez (Democratic) 70.9% Fernando A. Alonso (Republican) 25.2% Frank J. Rubino, Jr. (We the People) 1.6% Herbert H. Shaw (Politicians are Crooks) 1.4% Steven Marshall (Socialist Workers) 0.9% |
New Mexico
| District | Incumbent | This race | |||
|---|---|---|---|---|---|
| Representative | Party | First elected |
Results | Candidates | |
| New Mexico 1 | Steven Schiff | Republican | 1988 | Incumbent re-elected. | √ Steven Schiff (Republican) 73.9% Peter L. Zollinger (Democratic) 26.1% |
| New Mexico 2 | Joe Skeen | Republican | 1980 | Incumbent re-elected. | √ Joe Skeen (Republican) 63.3% Benjamin Anthony Chavez (Democratic) 31.9% Rex R. Johnson (Green) 4.9% |
| New Mexico 3 | Bill Richardson | Democratic | 1982 | Incumbent re-elected. | √ Bill Richardson (Democratic) 63.6% F. Gregg Bemis, Jr. (Republican) 34.1% Edward D. Nagel (Libertarian) 2.4% |
New York
| District | Incumbent | This race | |||
|---|---|---|---|---|---|
| Representative | Party | First elected |
Results | Candidates | |
| New York 1 | George J. Hochbrueckner | Democratic | 1986 | Incumbent lost re-election. New member elected. Republican gain. |
√ Michael Forbes (Republican) 49.1% George J. Hochbrueckner (Democratic) 43.5% Michael Strong (Fed Up) 0.9% Scattered votes 6.4% |
| New York 2 | Rick Lazio | Republican | 1992 | Incumbent re-elected. | √ Rick Lazio (Republican) 61.6% Jame L. Manfre (Democratic) 25.3% Alice Cort Ross (Right to Life) 3.4% Scattered votes 9.7% |
| New York 3 | Peter T. King | Republican | 1992 | Incumbent re-elected. | √ Peter T. King (Republican) 52.7% Norma Grill (Democratic) 35.6% John A. DePrima (Liberal) 0.7% Scattered votes 11.1% |
| New York 4 | David A. Levy | Republican | 1992 | Incumbent lost renomination. New member elected. Republican hold. |
√ Daniel Frisa (Republican) 44.6% Philip Schiliro (Democratic) 33.2% David A. Levy (Conservative) 7.7% Vincent P. Garbitelli (Right to Life) 2.7% Robert S. Berkowitz (Liberal) 0.7% Scattered votes 11.0% |
| New York 5 | Gary Ackerman | Democratic | 1983 | Incumbent re-elected. | √ Gary Ackerman (Democratic) 49.2% Grant M. Lally (Republican) 38.7% Edward Elkowitz (Right to Life) 1.5% Scattered votes 10.6% |
| New York 6 | Floyd H. Flake | Democratic | 1986 | Incumbent re-elected. | √ Floyd H. Flake (Democratic) 61.3% Dianand D. Bhagwandin (Republican) 14.9% Scattered votes 23.9% |
| New York 7 | Thomas J. Manton | Democratic | 1984 | Incumbent re-elected. | √ Thomas J. Manton (Democratic) 47.6% Robert E. Hurley (Conservative) 7.0% Scattered votes 45.4% |
| New York 8 | Jerrold Nadler | Democratic | 1992 | Incumbent re-elected. | √ Jerrold Nadler (Democratic) 68.2% David L. Askren (Republican) 13.1% Margaret V. Byrnes (Conservative) 1.9% Scattered votes 16.8% |
| New York 9 | Chuck Schumer | Democratic | 1980 | Incumbent re-elected. | √ Chuck Schumer (Democratic) 59.9% James P. McCall (Republican) 22.6% Scattered votes 17.5% |
| New York 10 | Ed Towns | Democratic | 1982 | Incumbent re-elected. | √ Ed Towns (Democratic) 66.3% Amelia Smith Parker (Republican) 6.9% Mildred K. Mahoney (Conservative) 1.3% Scattered votes 25.5% |
| New York 11 | Major Owens | Democratic | 1982 | Incumbent re-elected. | √ Major Owens (Democratic) 67.1% Gary S. Popkin (Republican) 7.2% Michael Gaffney (Conservative) 1.2% Scattered votes 24.4% |
| New York 12 | Nydia Velázquez | Democratic | 1992 | Incumbent re-elected. | √ Nydia Velázquez (Democratic) 59.2% Genevieve R. Brennan (Conservative) 4.1% Eric Ruano-Melendez (Perot Hispano American) 0.9% Scattered votes 35.8% |
| New York 13 | Susan Molinari | Republican | 1990 | Incumbent re-elected. | √ Susan Molinari (Republican) 60.9% Tyrone G. Butler (Democratic) 21.4% Elisa Disimone (Right to Life) 2.9% Scattered votes 14.8% |
| New York 14 | Carolyn B. Maloney | Democratic | 1992 | Incumbent re-elected. | √ Carolyn B. Maloney (Democratic) 58.2% Charles E.F. Millard (Republican) 32.1% Thomas K. Leighton (Green) 0.3% Scattered votes 9.5% |
| New York 15 | Charles B. Rangel | Democratic | 1970 | Incumbent re-elected. | √ Charles B. Rangel (Democratic) 71.7% Jose Augustine Suero (Right to Life) 2.6% Scattered votes 25.7% |
| New York 16 | José Serrano | Democratic | 1990 | Incumbent re-elected. | √ José Serrano (Democratic) 68.5% Michael Walters (Conservative) 2.6% Scattered votes 28.9% |
| New York 17 | Eliot L. Engel | Democratic | 1988 | Incumbent re-elected. | √ Eliot L. Engel (Democratic) 61.6% Edward T. Marshall (Republican) 14.2% Kevin Brawley (Conservative) 1.8% Ann M. Noonan (Right to Life) 1.7% Scattered votes 20.6% |
| New York 18 | Nita Lowey | Democratic | 1988 | Incumbent re-elected. | √ Nita Lowey (Democratic) 50.2% Andrew C. Hartzell, Jr. (Republican) 35.9% Florence T. O'Grady (Right to Life) 1.6% Scattered votes 12.3% |
| New York 19 | Hamilton Fish IV | Republican | 1968 | Incumbent retired. New member elected. Republican hold. |
√ Sue W. Kelly (Republican) 48.0% Hamilton Fish V (Democratic) 33.9% Joseph J. DioGuardi (Conservative) 9.5% Catherine Portman-Laux (Ax Taxes) 0.8% Scattered votes 7.8% |
| New York 20 | Benjamin A. Gilman | Republican | 1972 | Incumbent re-elected. | √ Benjamin A. Gilman (Republican) 59.2% Gregory B. Julian (Democratic) 25.8% Lois M. Colandrea (Right to Life) 2.8% Scattered votes 12.3% |
| New York 21 | Michael R. McNulty | Democratic | 1988 | Incumbent re-elected. | √ Michael R. McNulty (Democratic) 61.1% Joseph A. Gomez (Republican) 28.4% Timothy J. Wood (Right to Life) 1.7% Scattered votes 8.8% |
| New York 22 | Gerald B. H. Solomon | Republican | 1978 | Incumbent re-elected. | √ Gerald B. H. Solomon (Republican) 67.1% L. Robert Lawrence, Jr. (Democratic) 24.3% Scattered votes 8.6% |
| New York 23 | Sherwood Boehlert | Republican | 1982 | Incumbent re-elected. | √ Sherwood Boehlert (Republican) 60.5% Charles W. Skeele, Jr. (Democratic) 19.8% Donald J. Thomas (Right to Life) 5.5% Scattered votes 14.2% |
| New York 24 | John M. McHugh | Republican | 1992 | Incumbent re-elected. | √ John M. McHugh (Republican) 67.4% Danny M. Francis (Democratic) 18.4% Scattered votes 14.2% |
| New York 25 | James T. Walsh | Republican | 1988 | Incumbent re-elected. | √ James T. Walsh (Republican) 54.3% Rhea Jezer (Democratic) 40.0% Scattered votes 5.7% |
| New York 26 | Maurice Hinchey | Democratic | 1992 | Incumbent re-elected. | √ Maurice Hinchey (Democratic) 46.2% Bob Moppert (Republican) 45.6% Tom Kovach (Right to Life) 2.3% Scattered votes 5.9% |
| New York 27 | Bill Paxon | Republican | 1988 | Incumbent re-elected. | √ Bill Paxon (Republican) 65.0% William A. Long, Jr. (Democratic) 23.6% Scattered votes 7.2% |
| New York 28 | Louise McIntosh Slaughter | Democratic | 1986 | Incumbent re-elected. | √ Louise Slaughter (Democratic) 53.5% Renee Forgensi Davison (Republican) 37.9% John A. Clendenin (Independence Fusion) 3.1% Scattered votes 5.5% |
| New York 29 | John J. LaFalce | Democratic | 1974 | Incumbent re-elected. | √ John J. LaFalce (Democratic) 53.2% William E. Miller, Jr. (Republican) 41.5% Patrick Murty (Right to Life) 1.7% Scattered votes 3.7% |
| New York 30 | Jack Quinn | Republican | 1992 | Incumbent re-elected. | √ Jack Quinn (Republican) 61.7% David A. Franczyk (Democratic) 30.4% Scattered votes 8.0% |
| New York 31 | Amo Houghton | Republican | 1986 | Incumbent re-elected. | √ Amo Houghton (Republican) 61.3% Gretchen S. McManus (Right to Life) 11.1% Scattered votes 27.1% |
North Carolina
| District | Incumbent | This race | |||
|---|---|---|---|---|---|
| Representative | Party | First elected |
Results | Candidates | |
| North Carolina 1 | Eva M. Clayton | Democratic | 1992 | Incumbent re-elected. | √ Eva M. Clayton (Democratic) 61.1% Ted Tyler (Republican) 38.9% |
| North Carolina 2 | Tim Valentine | Democratic | 1982 | Incumbent retired. New member elected. Republican gain. |
√ David Funderburk (Republican) 56.0% Richard H. Moore (Democratic) 44.0% |
| North Carolina 3 | Martin Lancaster | Democratic | 1986 | Incumbent lost re-election. New member elected. Republican gain. |
√ Walter B. Jones (Republican) 52.7% Martin Lancaster (Democratic) 47.3% |
| North Carolina 4 | David Price | Democratic | 1986 | Incumbent lost re-election. New member elected. Republican gain. |
√ Fred Heineman (Republican) 50.4% David Price (Democratic) 49.6% |
| North Carolina 5 | Stephen L. Neal | Democratic | 1974 | Incumbent retired. New member elected. Republican gain. |
√ Richard Burr (Republican) 57.3% A. P. Sands (Democratic) 42.7% |
| North Carolina 6 | Howard Coble | Republican | 1984 | Incumbent re-elected. | √ Howard Coble (Republican) Unopposed |
| North Carolina 7 | Charlie Rose | Democratic | 1972 | Incumbent re-elected. | √ Charlie Rose (Democratic) 51.6% Robert C. Anderson (Republican) 48.4% |
| North Carolina 8 | Bill Hefner | Democratic | 1974 | Incumbent re-elected. | √ Bill Hefner (Democratic) 52.4% Sherrill Morgan (Republican) 47.6% |
| North Carolina 9 | Alex McMillan | Republican | 1984 | Incumbent retired. New member elected. Republican hold. |
√ Sue Wilkins Myrick (Republican) 65.0% Rory Blake (Democratic) 35.0% |
| North Carolina 10 | Cass Ballenger | Republican | 1986 | Incumbent re-elected. | √ Cass Ballenger (Republican) 71.5% Robert Wayne Avery (Democratic) 28.5% |
| North Carolina 11 | Charles H. Taylor | Republican | 1990 | Incumbent re-elected. | √ Charles H. Taylor (Republican) 60.1% Maggie Palmer Lauterer (Democratic) 39.9% |
| North Carolina 12 | Mel Watt | Democratic | 1992 | Incumbent re-elected. | √ Mel Watt (Democratic) 65.8% Joseph A. Martino (Republican) 34.2% |
North Dakota
| District | Incumbent | This race | |||
|---|---|---|---|---|---|
| Representative | Party | First elected |
Results | Candidates | |
| North Dakota at-large | Earl Pomeroy | Democratic | 1992 | Incumbent re-elected. | √ Earl Pomeroy (Democratic) 52.3% Gary Porter (Republican) 45.0% James Germalic (Independent) 2.7% |
Ohio
| District | Incumbent | This race | |||
|---|---|---|---|---|---|
| Representative | Party | First elected |
Results | Candidates | |
| Ohio 1 | David S. Mann | Democratic | 1992 | Incumbent lost re-election. New member elected. Republican gain. |
√ Steve Chabot (Republican) 56.1% David S. Mann (Democratic) 43.9% |
| Ohio 2 | Rob Portman | Republican | 1993 | Incumbent re-elected. | √ Rob Portman (Republican) 77.6% Les Mann (Democratic) 22.4% |
| Ohio 3 | Tony P. Hall | Democratic | 1978 | Incumbent re-elected. | √ Tony P. Hall (Democratic) 59.3% David A. Westbrock (Republican) 40.7% |
| Ohio 4 | Mike Oxley | Republican | 1981 | Incumbent re-elected. | √ Mike Oxley (Republican) Unopposed |
| Ohio 5 | Paul Gillmor | Republican | 1988 | Incumbent re-elected. | √ Paul Gillmor (Republican) 73.4% Jarrod Tudor (Democratic) 26.6% |
| Ohio 6 | Ted Strickland | Democratic | 1992 | Incumbent lost re-election. New member elected. Republican gain. |
√ Frank Cremeans (Republican) 50.9% Ted Strickland (Democratic) 49.1% |
| Ohio 7 | Dave Hobson | Republican | 1991 | Incumbent re-elected. | √ Dave Hobson (Republican) Unopposed |
| Ohio 8 | John Boehner | Republican | 1990 | Incumbent re-elected. | √ John Boehner (Republican) Unopposed |
| Ohio 9 | Marcy Kaptur | Democratic | 1982 | Incumbent re-elected. | √ Marcy Kaptur (Democratic) 75.3% Randy Whitman (Republican) 24.7% |
| Ohio 10 | Martin Hoke | Republican | 1992 | Incumbent re-elected. | √ Martin Hoke (Republican) 51.9% Francis E. Gaul (Democratic) 38.6% Joseph J. Jacobs, Jr. (Independent) 9.5% |
| Ohio 11 | Louis Stokes | Democratic | 1968 | Incumbent re-elected. | √ Louis Stokes (Democratic) 77.2% James J. Sykora (Republican) 22.8% |
| Ohio 12 | John Kasich | Republican | 1982 | Incumbent re-elected. | √ John Kasich (Republican) 66.5% Cynthia L. Ruccia (Democratic) 33.2% |
| Ohio 13 | Sherrod Brown | Democratic | 1992 | Incumbent re-elected. | √ Sherrod Brown (Democratic) 49.1% Gregory A. White (Republican) 45.5% Howard Mason (Independent) 4.1% John Michael Ryan (Independent) 1.3% |
| Ohio 14 | Thomas C. Sawyer | Democratic | 1986 | Incumbent re-elected. | √ Thomas C. Sawyer (Democratic) 51.9% Lynn Slaby (Republican) 48.1% |
| Ohio 15 | Deborah Pryce | Republican | 1992 | Incumbent re-elected. | √ Deborah Pryce (Republican) 70.7% Bill Buckel (Democratic) 29.1% |
| Ohio 16 | Ralph Regula | Republican | 1972 | Incumbent re-elected. | √ Ralph Regula (Republican) 75.0% J. Michael Finn (Democratic) 25.0% |
| Ohio 17 | James Traficant | Democratic | 1984 | Incumbent re-elected. | √ James Traficant (Democratic) 77.4% Mike G. Meister (Republican) 22.6% |
| Ohio 18 | Douglas Applegate | Democratic | 1976 | Incumbent retired. New member elected. Republican gain. |
√ Bob Ney (Republican) 54.0% Greg DiDonato (Democratic) 46.0% |
| Ohio 19 | Eric Fingerhut | Democratic | 1992 | Incumbent lost re-election. New member elected. Republican gain. |
√ Steve LaTourette (Republican) 48.5% Eric Fingerhut (Democratic) 43.5% Ron Young (Independent) 5.5% Jerome A. Brentar (Independent) 2.5% |
Oklahoma
| District | Incumbent | This race | |||
|---|---|---|---|---|---|
| Representative | Party | First elected |
Results | Candidates | |
| Oklahoma 1 | Jim Inhofe | Republican | 1986 | Incumbent retired to run for U.S. Senator. New member elected. Republican hold. |
√ Steve Largent (Republican) 62.7% Stuart Price (Democratic) 37.3% |
| Oklahoma 2 | Mike Synar | Democratic | 1978 | Incumbent lost renomination. New member elected. Republican gain. |
√ Tom Coburn (Republican) 52.1% Virgil R. Cooper (Democratic) 47.9% |
| Oklahoma 3 | William K. Brewster | Democratic | 1990 | Incumbent re-elected. | √ William K. Brewster (Democratic) 73.8% Darrel Dewayne Tallant (Republican) 26.2% |
| Oklahoma 4 | Dave McCurdy | Democratic | 1980 | Incumbent retired to run for U.S. Senator. New member elected. Republican gain. |
√ J. C. Watts (Republican) 51.6% David Perryman (Democratic) 43.3% Bill Tiffee (Independent) 5.1% |
| Oklahoma 5 | Ernest Istook | Republican | 1992 | Incumbent re-elected. | √ Ernest Istook (Republican) 78.1% Tom Keith (Democratic) 21.9% |
| Oklahoma 6 | Frank Lucas | Republican | 1994 | Incumbent re-elected. | √ Frank Lucas (Republican) 70.2% Jeffrey S. Tollett (Democratic) 29.8% |
Oregon
| District | Incumbent | This race | |||
|---|---|---|---|---|---|
| Representative | Party | First elected |
Results | Candidates | |
| Oregon 1 | Elizabeth Furse | Democratic | 1992 | Incumbent re-elected. | √ Elizabeth Furse (Democratic) 47.7% Bill Witt (Republican) 47.6% Brewster Gillett (American) 2.6% Daniel E. Wilson (Libertarian) 2.0% |
| Oregon 2 | Bob Smith | Republican | 1982 | Incumbent retired. New member elected. Republican hold. |
√ Wes Cooley (Republican) 57.3% Sue C. Kupillas (Democratic) 38.7% Gary L. Sublett (Libertarian) 3.9% |
| Oregon 3 | Ron Wyden | Democratic | 1980 | Incumbent re-elected. | √ Ron Wyden (Democratic) 72.5% Everett Hall (Republican) 19.4% Mark Brunelle (Independent) 6.1% Gene Nanni (Libertarian) 1.9% |
| Oregon 4 | Peter DeFazio | Democratic | 1986 | Incumbent re-elected. | √ Peter DeFazio (Democratic) 66.8% John D. Newkirk (Republican) 33.2% |
| Oregon 5 | Michael J. Kopetski | Democratic | 1990 | Incumbent retired. New member elected. Republican gain. |
√ Jim Bunn (Republican) 49.8% Catherine Webber (Democratic) 46.8% Jon E. Zimmer (Libertarian) 3.3% |
Pennsylvania
| District | Incumbent | This race | |||
|---|---|---|---|---|---|
| Representative | Party | First elected |
Results | Candidates | |
| Pennsylvania 1 | Thomas M. Foglietta | Democratic | 1980 | Incumbent re-elected. | √ Thomas M. Foglietta (Democratic) 81.5% Roger F. Gordon (Republican) 18.5% |
| Pennsylvania 2 | Lucien E. Blackwell | Democratic | 1990 | Incumbent lost renomination. New member elected. Democratic hold. |
√ Chaka Fattah (Democratic) 85.9% Lawrence R. Watson (Republican) 14.1% |
| Pennsylvania 3 | Robert A. Borski, Jr. | Democratic | 1982 | Incumbent re-elected. | √ Robert A. Borski, Jr. (Democratic) 62.7% James C. Hasher (Republican) 37.3% |
| Pennsylvania 4 | Ron Klink | Democratic | 1992 | Incumbent re-elected. | √ Ron Klink (Democratic) 64.2% Ed Peglow (Republican) 35.8% |
| Pennsylvania 5 | William F. Clinger, Jr. | Republican | 1978 | Incumbent re-elected. | √ William F. Clinger, Jr. (Republican) Unopposed |
| Pennsylvania 6 | Tim Holden | Democratic | 1992 | Incumbent re-elected. | √ Tim Holden (Democratic) 56.7% Frederick C. Levering (Republican) 43.3% |
| Pennsylvania 7 | Curt Weldon | Republican | 1986 | Incumbent re-elected. | √ Curt Weldon (Republican) 69.7% Sara R. Nichols (Democratic) 30.3% |
| Pennsylvania 8 | James C. Greenwood | Republican | 1992 | Incumbent re-elected. | √ James C. Greenwood (Republican) 66.1% John P. Murray (Democratic) 26.7% Jay Timothy Russell (Libertarian) 4.7% Robert J. Cash (Cash for Congress) 2.5% |
| Pennsylvania 9 | Bud Shuster | Republican | 1972 | Incumbent re-elected. | √ Bud Shuster (Republican) Unopposed |
| Pennsylvania 10 | Joseph M. McDade | Republican | 1962 | Incumbent re-elected. | √ Joseph M. McDade (Republican) 65.7% Daniel J. Schreffler (Democratic) 31.1% Albert A. Smith (Libertarian) 3.2% |
| Pennsylvania 11 | Paul E. Kanjorski | Democratic | 1984 | Incumbent re-elected. | √ Paul E. Kanjorski (Democratic) 66.5% J. Andrew Podolak (Republican) 33.5% |
| Pennsylvania 12 | John Murtha | Democratic | 1974 | Incumbent re-elected. | √ John Murtha (Democratic) 68.9% Bill Choby (Republican) 31.1% |
| Pennsylvania 13 | Marjorie Margolies- Mezvinsky |
Democratic | 1992 | Incumbent lost re-election. New member elected. Republican gain. |
√ Jon D. Fox (Republican) 49.4% Marjorie Margolies-Mezvinsky (Democratic) 45.2% Lee D. Hustead (Libertarian) 3.7% Frank W. Szabo (Independent) 1.7% |
| Pennsylvania 14 | William J. Coyne | Democratic | 1980 | Incumbent re-elected. | √ William J. Coyne (Democratic) 64.1% John Robert Clark (Republican) 32.4% Edward L. Stewart (Independent) 2.3% Paul Scherrer (Independent) 1.1% |
| Pennsylvania 15 | Paul F. McHale, Jr. | Democratic | 1992 | Incumbent re-elected. | √ Paul F. McHale, Jr. (Democratic) 47.8% Jim Yeager (Republican) 47.4% Victor J. Mazziotti (Patriot) 4.8% |
| Pennsylvania 16 | Robert Smith Walker | Republican | 1976 | Incumbent re-elected. | √ Robert Smith Walker (Republican) 69.7% Bill Chertok (Democratic) 30.3% |
| Pennsylvania 17 | George Gekas | Republican | 1982 | Incumbent re-elected. | √ George Gekas (Republican) Unopposed |
| Pennsylvania 18 | Rick Santorum | Republican | 1990 | Incumbent retired to run for U.S. Senator. New member elected. Democratic gain. |
√ Michael F. Doyle (Democratic) 54.8% John McCarty (Republican) 45.2% |
| Pennsylvania 19 | William F. Goodling | Republican | 1974 | Incumbent re-elected. | √ William F. Goodling (Republican) Unopposed |
| Pennsylvania 20 | Austin J. Murphy | Democratic | 1976 | Incumbent retired. New member elected. Democratic hold. |
√ Frank Mascara (Democratic) 53.1% Mike McCormick (Republican) 46.9% |
| Pennsylvania 21 | Tom Ridge | Republican | 1982 | Incumbent retired to run for Governor of Pennsylvania. New member elected. Republican hold. |
√ Phil English (Republican) 49.5% Bill Leavens (Democratic) 46.9% Arthur E. Drew (Independent) 3.6% |
Rhode Island
| District | Incumbent | This race | |||
|---|---|---|---|---|---|
| Representative | Party | First elected |
Results | Candidates | |
| Rhode Island 1 | Ronald Machtley | Republican | 1988 | Incumbent retired to run for Governor of Rhode Island. New member elected. Democratic gain. |
√ Patrick J. Kennedy (Democratic) 54.1% Kevin Vigilante (Republican) 45.9% |
| Rhode Island 2 | Jack Reed | Democratic | 1990 | Incumbent re-elected. | √ Jack Reed (Democratic) 68.0% A. John Elliot (Republican) 32.0% |
South Carolina
| District | Incumbent | This race | |||
|---|---|---|---|---|---|
| Representative | Party | First elected |
Results | Candidates | |
| South Carolina 1 | Arthur Ravenel, Jr. | Republican | 1986 | Incumbent retired to run for Governor of South Carolina. New member elected. Republican hold. |
√ Mark Sanford (Republican) 66.3% Robert Barber (Democratic) 32.4% Robert Payne (Libertarian) 1.2% |
| South Carolina 2 | Floyd Spence | Republican | 1970 | Incumbent re-elected. | √ Floyd Spence (Republican) Unopposed |
| South Carolina 3 | Butler Derrick | Democratic | 1974 | Incumbent retired. New member elected. Republican gain. |
√ Lindsey Graham (Republican) 60.1% James E. Bryan, Jr. (Democratic) 39.9% |
| South Carolina 4 | Bob Inglis | Republican | 1992 | Incumbent re-elected. | √ Bob Inglis (Republican) 73.5% Jerry L. Fowler (Democratic) 26.4% |
| South Carolina 5 | John M. Spratt, Jr. | Democratic | 1982 | Incumbent re-elected. | √ John M. Spratt, Jr. (Democratic) 52.1% Larry Bigham (Republican) 47.8% |
| South Carolina 6 | Jim Clyburn | Democratic | 1992 | Incumbent re-elected. | √ Jim Clyburn (Democratic) 63.8% Gary McLeod (Republican) 36.2% |
South Dakota
| District | Incumbent | This race | |||
|---|---|---|---|---|---|
| Representative | Party | First elected |
Results | Candidates | |
| South Dakota at-large | Tim Johnson | Democratic | 1986 | Incumbent re-elected. | √ Tim Johnson (Democratic) 59.8% Jan Berkhout (Republican) 36.6% Ronald Wieczorek (Independent) 3.5% |
Tennessee
| District | Incumbent | This race | |||
|---|---|---|---|---|---|
| Representative | Party | First elected |
Results | Candidates | |
| Tennessee 1 | Jimmy Quillen | Republican | 1962 | Incumbent re-elected. | √ Jimmy Quillen (Republican) 72.9% J. Carr Christian (Democratic) 24.6% George Mauer (Independent) 2.5% |
| Tennessee 2 | Jimmy Duncan | Republican | 1988 | Incumbent re-elected. | √ Jimmy Duncan (Republican) 90.5% Randon J. Krieg (Independent) 4.8% Greg Samples (Independent) 4.7% |
| Tennessee 3 | Marilyn Lloyd | Democratic | 1974 | Incumbent retired. New member elected. Republican gain. |
√ Zach Wamp (Republican) 52.3% Randy Button (Democratic) 45.6% Thomas Ed Morrrell (Independent) 1.2% Richard M. Sims (Independent) 0.9% |
| Tennessee 4 | Jim Cooper | Democratic | 1982 | Incumbent retired to run for U.S. Senator. New member elected. Republican gain. |
√ Van Hilleary (Republican) 56.6% Jeff Whorley (Democratic) 42.0% J. Patrick Lyons (Independent) 1.4% |
| Tennessee 5 | Bob Clement | Democratic | 1988 | Incumbent re-elected. | √ Bob Clement (Democratic) 60.2% John Osborne (Republican) 38.7% Lloyd Botway (Independent) 0.6% Chuck Lokey (Independent) 0.4% |
| Tennessee 6 | Bart Gordon | Democratic | 1984 | Incumbent re-elected. | √ Bart Gordon (Democratic) 50.6% Steve Gill (Republican) 49.4% |
| Tennessee 7 | Don Sundquist | Republican | 1982 | Incumbent retired to run for Governor of Tennessee. New member elected. Republican hold. |
√ Ed Bryant (Republican) 60.2% Harold Byrd (Democratic) 38.6% Tom Jeanette (Independent) 1.1% |
| Tennessee 8 | John S. Tanner | Democratic | 1988 | Incumbent re-elected. | √ John S. Tanner (Democratic) 63.8% Neal R. Morris (Republican) 36.2% |
| Tennessee 9 | Harold Ford, Sr. | Democratic | 1974 | Incumbent re-elected. | √ Harold Ford, Sr. (Democratic) 57.8% Roderick DeBerry (Republican) 42.2% |
Texas
| District | Incumbent | This race | |||
|---|---|---|---|---|---|
| Representative | Party | First elected |
Results | Candidates | |
| Texas 1 | Jim Chapman | Democratic | 1985 | Incumbent re-elected. | √ Jim Chapman (Democratic) 55.3% Mike Blankenship (Republican) 40.9% Thomas Mosser (Independent) 3.8% |
| Texas 2 | Charlie Wilson | Democratic | 1972 | Incumbent re-elected. | √ Charlie Wilson (Democratic) 57.0% Donna Peterson (Republican) 43.0% |
| Texas 3 | Sam Johnson | Republican | 1991 | Incumbent re-elected. | √ Sam Johnson (Republican) 91.0% Tom Donahue (Libertarian) 9.0% |
| Texas 4 | Ralph Hall | Democratic | 1980 | Incumbent re-elected. | √ Ralph Hall (Democratic) 58.8% David L. Bridges (Republican) 39.8% Steven Rothacker (Libertarian) 1.4% |
| Texas 5 | John Wiley Bryant | Democratic | 1982 | Incumbent re-elected. | √ John Wiley Bryant (Democratic) 50.1% Pete Sessions (Republican) 47.3% Barbara Morgan (Independent) 1.4% Noel Kopala (Libertarian) 0.7% Regina Arashvand (Independent) 0.5% |
| Texas 6 | Joe Barton | Republican | 1984 | Incumbent re-elected. | √ Joe Barton (Republican) 75.6% Terry Jesmore (Democratic) 22.0% Bill Baird (Libertarian) 2.3% |
| Texas 7 | Bill Archer | Republican | 1970 | Incumbent re-elected. | √ Bill Archer (Republican) Unopposed |
| Texas 8 | Jack Fields | Republican | 1980 | Incumbent re-elected. | √ Jack Fields (Republican) 92.0% Russ Klecka (Independent) 8.0% |
| Texas 9 | Jack Brooks | Democratic | 1952 | Incumbent lost re-election. New member elected. Republican gain. |
√ Steve Stockman (Republican) 51.9% Jack Brooks (Democratic) 45.7% Bill Felton (Independent) 1.4% Darla K. Beenau (Libertarian) 1.1% |
| Texas 10 | J. J. Pickle | Democratic | 1963 | Incumbent retired. New member elected. Democratic hold. |
√ Lloyd Doggett (Democratic) 56.3% Jo Baylor (Republican) 39.8% Jeff Hill (Libertarian) 1.5% Michael L. Brandes (Independent) 1.3% Jeff Davis (Independent) 1.2% |
| Texas 11 | Chet Edwards | Democratic | 1990 | Incumbent re-elected. | √ Chet Edwards (Democratic) 59.2% James W. Broyles (Republican) 40.8% |
| Texas 12 | Pete Geren | Democratic | 1989 | Incumbent re-elected. | √ Pete Geren (Democratic) 68.7% Ernest J. Anderson, Jr. (Republican) 31.3% |
| Texas 13 | Bill Sarpalius | Democratic | 1988 | Incumbent lost re-election. New member elected. Republican gain. |
√ Mac Thornberry (Republican) 55.4% Bill Sarpalius (Democratic) 44.6% |
| Texas 14 | Greg Laughlin | Democratic | 1992 | Incumbent re-elected. | √ Greg Laughlin (Democratic) 55.6% Jim Deats (Republican) 44.4% |
| Texas 15 | Kika de la Garza | Democratic | 1964 | Incumbent re-elected. | √ Kika de la Garza (Democratic) 59.0% Tom Haughey (Republican) 39.4% John Hamilton (Independent) 1.6% |
| Texas 16 | Ronald D. Coleman | Democratic | 1982 | Incumbent re-elected. | √ Ronald D. Coleman (Democratic) 57.1% Bobby Ortiz (Republican) 42.9% |
| Texas 17 | Charles Stenholm | Democratic | 1978 | Incumbent re-elected. | √ Charles Stenholm (Democratic) 53.6% Phil Boone (Republican) 46.3% |
| Texas 18 | Craig Anthony Washington | Democratic | 1989 | Incumbent lost renomination. New member elected. Democratic hold. |
√ Sheila Jackson-Lee (Democratic) 73.5% Jerry Burley (Republican) 24.4% J. Larry Snellings (Independent) 1.1% George M. Hollenbeck (Libertarian) 1.0% |
| Texas 19 | Larry Combest | Republican | 1984 | Incumbent re-elected. | √ Larry Combest (Republican) Unopposed |
| Texas 20 | Henry B. Gonzalez | Democratic | 1961 | Incumbent re-elected. | √ Henry B. Gonzalez (Democratic) 62.5% Carl Bill Colyer (Republican) 37.5% |
| Texas 21 | Lamar S. Smith | Republican | 1986 | Incumbent re-elected. | √ Lamar S. Smith (Republican) 90.0% Kerry L. Lowry (Independent) 10.0% |
| Texas 22 | Tom DeLay | Republican | 1984 | Incumbent re-elected. | √ Tom DeLay (Republican) 73.7% Scott Douglas Cunningham (Democratic) 23.8% Gregory D. Pepper (Independent) 2.5% |
| Texas 23 | Henry Bonilla | Republican | 1992 | Incumbent re-elected. | √ Henry Bonilla (Republican) 62.6% Rolando L. Rios (Democratic) 37.4% |
| Texas 24 | Martin Frost | Democratic | 1978 | Incumbent re-elected. | √ Martin Frost (Democratic) 52.8% Ed Harrison (Republican) 47.2% |
| Texas 25 | Michael A. Andrews | Democratic | 1982 | Incumbent retired to run for U.S. Senator. New member elected. Democratic hold. |
√ Ken Bentsen, Jr. (Democratic) 52.3% Gene Fontenot (Republican) 45.0% Sarah Klein-Tower (Independent) 1.7% Robert F. Lockhart (Libertarian) 1.0% |
| Texas 26 | Dick Armey | Republican | 1984 | Incumbent re-elected. | √ Dick Armey (Republican) 76.4% LeEarl Ann Bryant (Democratic) 22.4% Alfred Adask (Libertarian) 1.1% |
| Texas 27 | Solomon P. Ortiz | Democratic | 1982 | Incumbent re-elected. | √ Solomon P. Ortiz (Democratic) 59.4% Erol A. Stone (Republican) 40.06% |
| Texas 28 | Frank Tejeda | Democratic | 1992 | Incumbent re-elected. | √ Frank Tejeda (Democratic) 70.9% David C. Slatter (Republican) 27.6% Stephan Rothstein (Libertarian) 1.5% |
| Texas 29 | Gene Green | Democratic | 1992 | Incumbent re-elected. | √ Gene Green (Democratic) 73.4% Harold Eide (Republican) 26.6% |
| Texas 30 | Eddie Bernice Johnson | Democratic | 1992 | Incumbent re-elected. | √ Eddie Bernice Johnson (Democratic) 72.6% Lucy Cain (Republican) 25.7% Ken Ashby (Libertarian) 1.7% |
Utah
| District | Incumbent | This race | |||
|---|---|---|---|---|---|
| Representative | Party | First elected |
Results | Candidates | |
| Utah 1 | James V. Hansen | Republican | 1980 | Incumbent re-elected. | √ James V. Hansen (Republican) 64.5% Bobbie Coray (Democratic) 35.5% |
| Utah 2 | Karen Shepherd | Democratic | 1992 | Incumbent lost re-election. New member elected. Republican gain. |
√ Enid Greene Waldholtz (Republican) 45.8% Karen Shepherd (Democratic) 35.9% Merrill Cook (Independent) 18.3% |
| Utah 3 | Bill Orton | Democratic | 1990 | Incumbent re-elected. | √ Bill Orton (Democratic) 59.0% Dixie Thompson (Republican) 39.9% Barbara Greenway (Socialist Workers) 1.2% |
Vermont
| District | Incumbent | This race | |||
|---|---|---|---|---|---|
| Representative | Party | First elected |
Results | Candidates | |
| Vermont at-large | Bernie Sanders | Independent | 1990 | Incumbent re-elected. | √ Bernie Sanders (Independent) 49.9% John Carroll (Republican) 46.6% Carole Banus (Natural Law) 1.4% Jack Rogers (VT Grassroots) 1.3% Annette Larson (Liberty Union) 0.7% |
Virginia
| District | Incumbent | This race | |||
|---|---|---|---|---|---|
| Representative | Party | First elected |
Results | Candidates | |
| Virginia 1 | Herbert H. Bateman | Republican | 1982 | Incumbent re-elected. | √ Herbert H. Bateman (Republican) 74.3% Mary F. Sinclair (Democratic) 23.5% Matt B. Voorhees (Independent) 2.3% |
| Virginia 2 | Owen B. Pickett | Democratic | 1986 | Incumbent re-elected. | √ Owen B. Pickett (Democratic) 59.0% J. L. Chapman (Republican) 40.9% |
| Virginia 3 | Bobby Scott | Democratic | 1992 | Incumbent re-elected. | √ Bobby Scott (Democratic) 79.4% Thomas E. Ward (Republican) 20.6% |
| Virginia 4 | Norman Sisisky | Democratic | 1982 | Incumbent re-elected. | √ Norman Sisisky (Democratic) 61.6% A. George Sweet III (Republican) 38.4% |
| Virginia 5 | Lewis Payne | Democratic | 1988 | Incumbent re-elected. | √ Lewis Payne (Democratic) 53.3% George Landrith (Republican) 46.7% |
| Virginia 6 | Bob Goodlatte | Republican | 1992 | Incumbent re-elected. | √ Bob Goodlatte (Republican) Unopposed |
| Virginia 7 | Thomas J. Bliley, Jr. | Republican | 1980 | Incumbent re-elected. | √ Thomas J. Bliley, Jr. (Republican) 84.0% Gerald E. Berg (Independent) 15.8% |
| Virginia 8 | Jim Moran | Democratic | 1990 | Incumbent re-elected. | √ Jim Moran (Democratic) 59.3% Kyle E. McSlarrow (Republican) 39.3% Ward Edmonds (Independent) 0.9% William C. Jones (Independent) 0.4% |
| Virginia 9 | Rick Boucher | Democratic | 1982 | Incumbent re-elected. | √ Rick Boucher (Democratic) 58.8% S. H. Fast (Republican) 41.2% |
| Virginia 10 | Frank Wolf | Republican | 1980 | Incumbent re-elected. | √ Frank Wolf (Republican) 87.3% Alan Ogden (Independent) 7.8% Robert Rilee (Independent) 0.2% |
| Virginia 11 | Leslie L. Byrne | Democratic | 1992 | Incumbent lost re-election. New member elected. Republican gain. |
√ Tom Davis (Republican) 52.9% Leslie L. Byrne (Democratic) 45.3% Gordon Cruickshank (Independent) 1.7% |
Washington
| District | Incumbent | This race | |||
|---|---|---|---|---|---|
| Representative | Party | First elected |
Results | Candidates | |
| Washington 1 | Maria Cantwell | Democratic | 1992 | Incumbent lost re-election. New member elected. Republican gain. |
√ Rick White (Republican) 51.7% Maria Cantwell (Democratic) 48.3% |
| Washington 2 | Al Swift | Democratic | 1978 | Incumbent retired. New member elected. Republican gain. |
√ Jack Metcalf (Republican) 54.7% Harriet Spanel (Democratic) 45.3% |
| Washington 3 | Jolene Unsoeld | Democratic | 1988 | Incumbent lost re-election. New member elected. Republican gain. |
√ Linda Smith (Republican) 52.0% Jolene Unsoeld (Democratic) 44.6% Caitlin Davis Carlson (Gun Control) 3.4% |
| Washington 4 | Jay Inslee | Democratic | 1992 | Incumbent lost re-election. New member elected. Republican gain. |
√ Doc Hastings (Republican) 53.3% Jay Inslee (Democratic) 46.7% |
| Washington 5 | Tom Foley | Democratic | 1964 | Incumbent lost re-election. New member elected. Republican gain. |
√ George Nethercutt (Republican) 50.9% Tom Foley (Democratic) 49.1% |
| Washington 6 | Norman D. Dicks | Democratic | 1976 | Incumbent re-elected. | √ Norman D. Dicks (Democratic) 58.3% Benjamin Gregg (Democratic) 41.7% |
| Washington 7 | Jim McDermott | Democratic | 1988 | Incumbent re-elected. | √ Jim McDermott (Democratic) 75.1% Keith Harris (Republican) 24.9% |
| Washington 8 | Jennifer Dunn | Republican | 1992 | Incumbent re-elected. | √ Jennifer Dunn (Republican) 76.1% Jim Wyrick (Democratic) 23.9% |
| Washington 9 | Mike Kreidler | Democratic | 1992 | Incumbent lost re-election. New member elected. Republican gain. |
√ Randy Tate (Republican) 51.8% Mike Kreidler (Democratic) 48.2% |
West Virginia
| District | Incumbent | This race | |||
|---|---|---|---|---|---|
| Representative | Party | First elected |
Results | Candidates | |
| West Virginia 1 | Alan Mollohan | Democratic | 1982 | Incumbent re-elected. | √ Alan Mollohan (Democratic) 70.3% Sally Rossy Riley (Republican) 29.7% |
| West Virginia 2 | Bob Wise | Democratic | 1982 | Incumbent re-elected. | √ Bob Wise (Democratic) 63.7% Samuel A. Cravotta (Republican) 36.3% |
| West Virginia 3 | Nick Rahall | Democratic | 1976 | Incumbent re-elected. | √ Nick Rahall (Democratic) 63.9% Ben Waldman (Republican) 36.1% |
Wisconsin
| District | Incumbent | This race | |||
|---|---|---|---|---|---|
| Representative | Party | First elected |
Results | Candidates | |
| Wisconsin 1 | Peter W. Barca | Democratic | 1993 | Incumbent lost re-election. New member elected. Republican gain. |
√ Mark Neumann (Republican) 49.4% Peter W. Barca (Democratic) 48.8% Edward Kozak (Libertarian) 1.8% |
| Wisconsin 2 | Scott L. Klug | Republican | 1990 | Incumbent re-elected. | √ Scott L. Klug (Republican) 69.2% Thomas Hecht (Democratic) 28.7% John Stumpf (Taxpayers) 1.4% Joseph Schumacher (Independent) 0.7% |
| Wisconsin 3 | Steve Gunderson | Republican | 1980 | Incumbent re-elected. | √ Steve Gunderson (Republican) 55.7% Harvey Stower (Democratic) 41.0% Chuck Lee (Taxpayers) 1.8% Mark Weinhold (Independent) 1.4% |
| Wisconsin 4 | Jerry Kleczka | Democratic | 1984 | Incumbent re-elected. | √ Jerry Kleczka (Democratic) 53.7% Thomas G. Reynolds (Republican) 44.8% James Harold Hause (Taxpayers) 1.5% |
| Wisconsin 5 | Tom Barrett | Democratic | 1992 | Incumbent re-elected. | √ Tom Barrett (Democratic) 62.4% Stephen Hollingshead (Republican) 36.4% David Schall (Independent) 1.1% |
| Wisconsin 6 | Tom Petri | Republican | 1979 | Incumbent re-elected. | √ Tom Petri (Republican) Unopposed |
| Wisconsin 7 | Dave Obey | Democratic | 1969 | Incumbent re-elected. | √ Dave Obey (Democratic) 54.3% Scott West (Republican) 45.7% |
| Wisconsin 8 | Toby Roth | Republican | 1978 | Incumbent re-elected. | √ Toby Roth (Republican) 63.7% Stan Gruszynski (Democratic) 36.3% |
| Wisconsin 9 | Jim Sensenbrenner | Republican | 1978 | Incumbent re-elected. | √ Jim Sensenbrenner (Republican) Unopposed |
Wyoming
| District | Incumbent | This race | |||
|---|---|---|---|---|---|
| Representative | Party | First elected |
Results | Candidates | |
| Wyoming at-large | Craig L. Thomas | Republican | 1989 | Incumbent retired to run for U.S. Senator. New member elected. Republican hold. |
√ Barbara Cubin (Republican) 53.2% Bob Schuster (Democratic) 41.3% Dave Dawson (Libertarian) 5.5% |
Non-voting delegates
| District | Incumbent | This race | |||
|---|---|---|---|---|---|
| Representative | Party | First elected |
Results | Candidates | |
| U.S. Virgin Islands at-large | Ron de Lugo | Democratic | 1980 | Incumbent retired. New member elected. Independent gain. |
√ Victor O. Frazer (Independent)[7] Eileen Peterson (Democratic) |
See also
References
- 1 2 "Congress Profiles 104th Congress (1995–1997)". Office of the Historian, United States House of Representatives. Retrieved August 18, 2015.
- ↑ Chard, R.E. (2004). The Mediating Effect of Public Opinion on Public Policy: Exploring the Realm of Health Care. State University of New York Press. p. 123. ISBN 9780791460535. Retrieved October 5, 2014.
- ↑ "Thomas Foley, House Speaker, Dies at 84". New York Times. October 18, 2013. Retrieved March 21, 2014.
- ↑ Peter Applebome (11 November 1994). "THE 1994 ELECTIONS: THE SOUTH; The Rising G.O.P. Tide Overwhelms the Democratic Levees in the South". New York Times. Retrieved September 22, 2014.
- ↑ Klinkner 118.
- ↑ Hotline, November 12, 1994.
- ↑ "Democratic Delegate Loses In U.S. Virgin Islands Runoff". Washington Post. November 24, 1994. Retrieved July 27, 2011.
External links
- Statistics of the Congressional Election of November 8, 1994, Office of the Clerk U.S. House of Representatives
Further reading
- Jenkins, Shannon, Douglas D. Roscoe, John P. Frendreis and Alan R. Gitelson. 2007. "Ten Years After the Revolution: 1994 and Partisan Control of Government" in Green, John C. and Daniel J. Coffey, eds. The State of the Parties, 5th ed. Lanham, MD: Rowman and Littlefield.
- Klinkner; Philip A. Midterm: The Elections of 1994 in Context Westview Press, 1996
- Ladd, Everett Carll. "The 1994 congressional elections: The postindustrial realignment continues," Political Science Quarterly (1995) 110#1 pp 1–22 in JSTOR
- Steeper, F. "This swing is different: Analysis of 1994 election exit polls". The Cook Political Report (February 8, 1995)
- Teixeira, Ruy A. "The Economics of the 1994 Election and U.S. Politics Today" Challenge. Volume: 39. Issue: 1. 1996. pp 26+.
- Wattenberg; Martin P. "The Democrats' Decline in the House during the Clinton Presidency: An Analysis of Partisan Swings" Presidential Studies Quarterly, Vol. 29, 1999